Using the Table Designer to Create Graph Tables in Azure Data Studio
Applies to: ![]() SQL Server
SQL Server ![]() Azure SQL Database
Azure SQL Database ![]() Azure SQL Managed Instance
Azure SQL Managed Instance
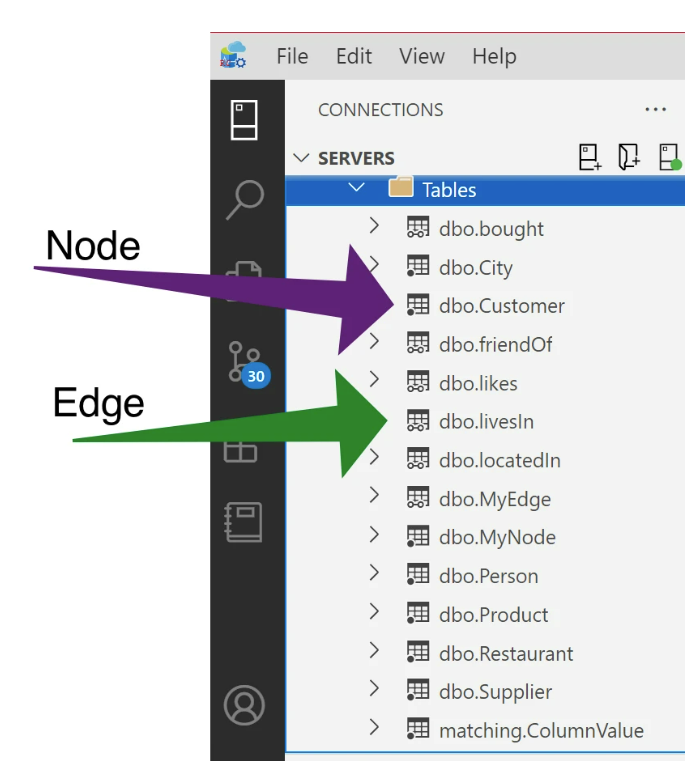
Graph tables are used to establish relationships between entities in your database using node and edge table relationships. In Azure Data Studio, you can easily create these relationships directly in the GUI without having to manually type out long lines of T-SQL code. To learn more about graph tables, check out this documentation on SQL Graph Architecture. The table type can be seen in the Connections Pane by the icon shown to the left of the table name. A single dot represents a node graph table, while the two unshaded dots represent edge graph tables as shown below:
Creating a graph table is done directly in the Properties pane.
Note
Please note that to create graph tables, a new table has to be created. Graph tables can't be implemented for existing tables.
In this example below, we will use the table designer GUI to create two node tables; Person, City, and an edge table called "lives" with an edge constraint to establish the relationship between the two node tables (i.e Person lives in City). For a T-SQL script version of this example, see Create a graph database and run some pattern matching queries using T-SQL.
Create the node tables
Create a table and name it City. Before saving this new table, in the Table Properties pane, change the Graph Table option to Node from the drop-down.

Notice that the script is updated to include the "as node" syntax.
Once this configuration is set, publish this update to the database. Once published, you will see that a new column for the node ID is created and this ID is referenced in the script pane as shown above.
Create another node table and name it Person, with the same settings as above.
Create the edge table
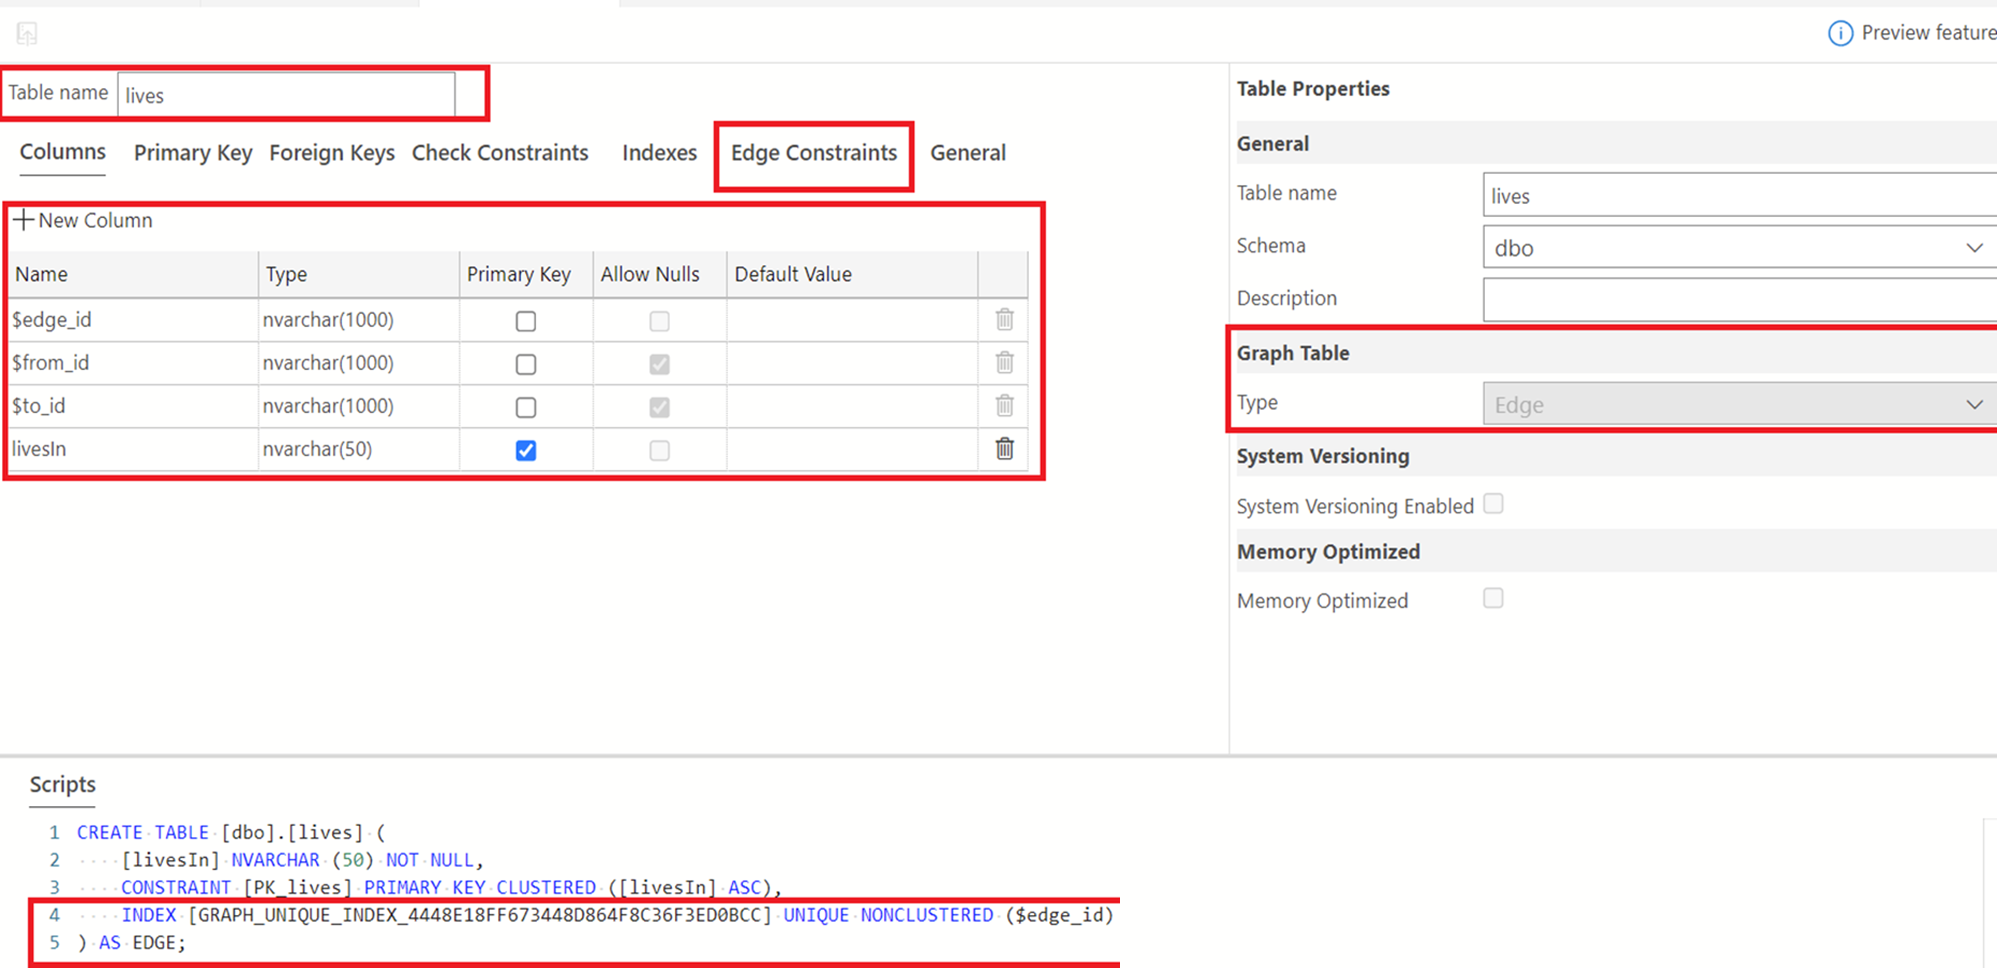
Now, as mentioned earlier, we'll create our edge table, "lives". To do this, right-click on the Tables folder to create a new table. Change the name of this table from its default to "lives". To indicate that this is an edge table, select the Graph Table Type drop-down in the Table Properties pane and select "Edge". See below.
To create the relationship between the node and edge graphs, select "Edge Constraints". Please refer to the edge constraints documentation to learn more about edge constraints. Select the plus sign next to "New Edge Constraint" to create a new constraint. A default name of "EC-1" is provided as seen below. Feel free to change the name as you please. For the purpose of this tutorial, we will leave this as is.
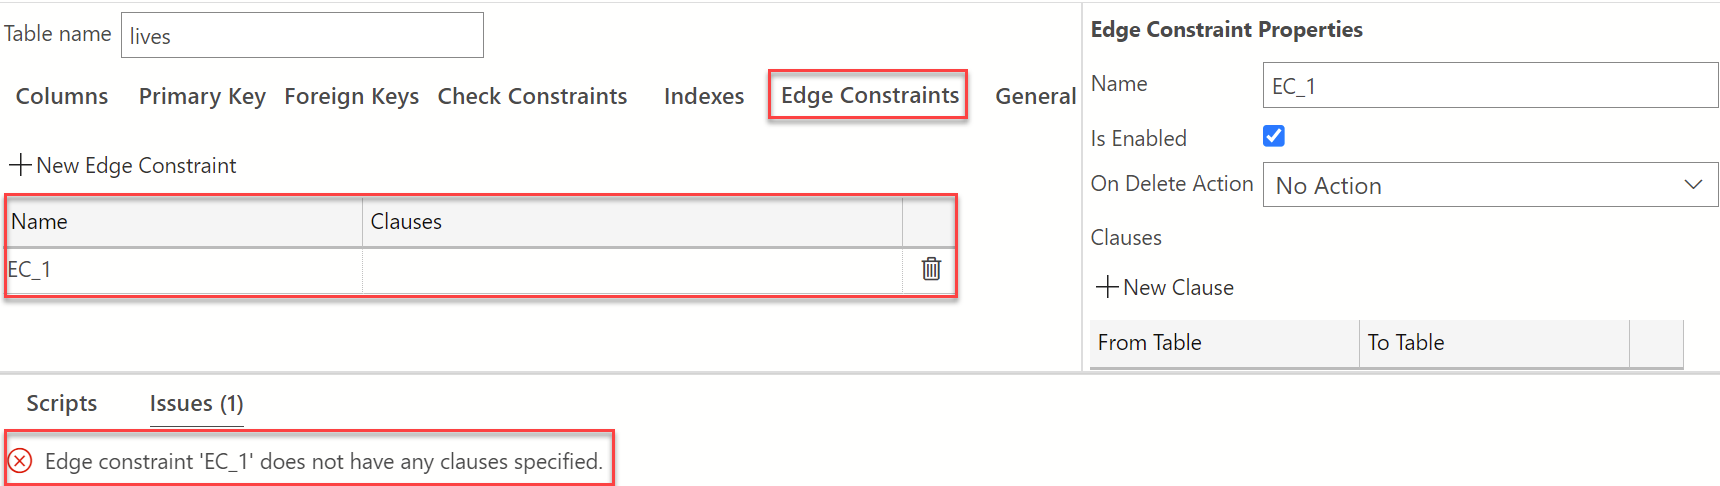
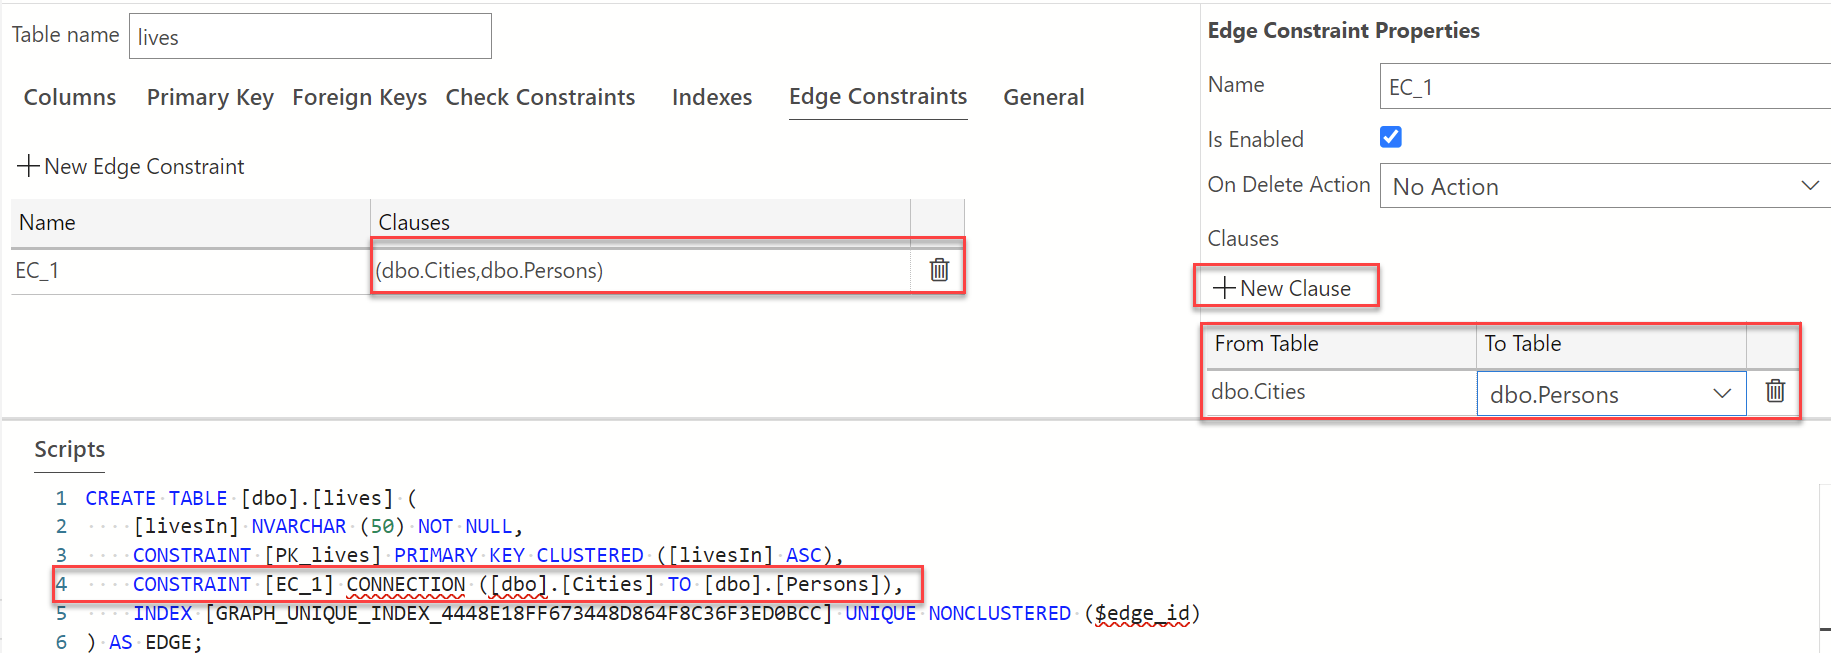
As seen in script pane in the image above, a warning appears indicating that a clause has not been specified. We need to create the clause that will establish the edge constraint between our Person and City node graph tables. On the "Edge Constraint Properties" pane, under Clauses, select +New Clause. The From and To values will now appear in the clauses section. Hover over the From Table to view the drop-down, select dbo.Persons and from the To Table drop-down, select dbo.City. Be sure to publish changes to save your work. See below for the overview of what the Table Designer view should look like after performing these steps described above.
You can add as few or as many constraints as needed depending on the nature of the relationships between the different tables in your database.
Next steps
Visszajelzés
Hamarosan elérhető: 2024-ben fokozatosan kivezetjük a GitHub-problémákat a tartalom visszajelzési mechanizmusaként, és lecseréljük egy új visszajelzési rendszerre. További információ: https://aka.ms/ContentUserFeedback.
Visszajelzés küldése és megtekintése a következőhöz: