Manage your alert rules
Manage your alert rules in the Azure portal, or using the CLI or PowerShell.
Manage alert rules in the Azure portal
In the portal, select Monitor, then Alerts.
From the top command bar, select Alert rules. The page shows all your alert rules on all subscriptions.
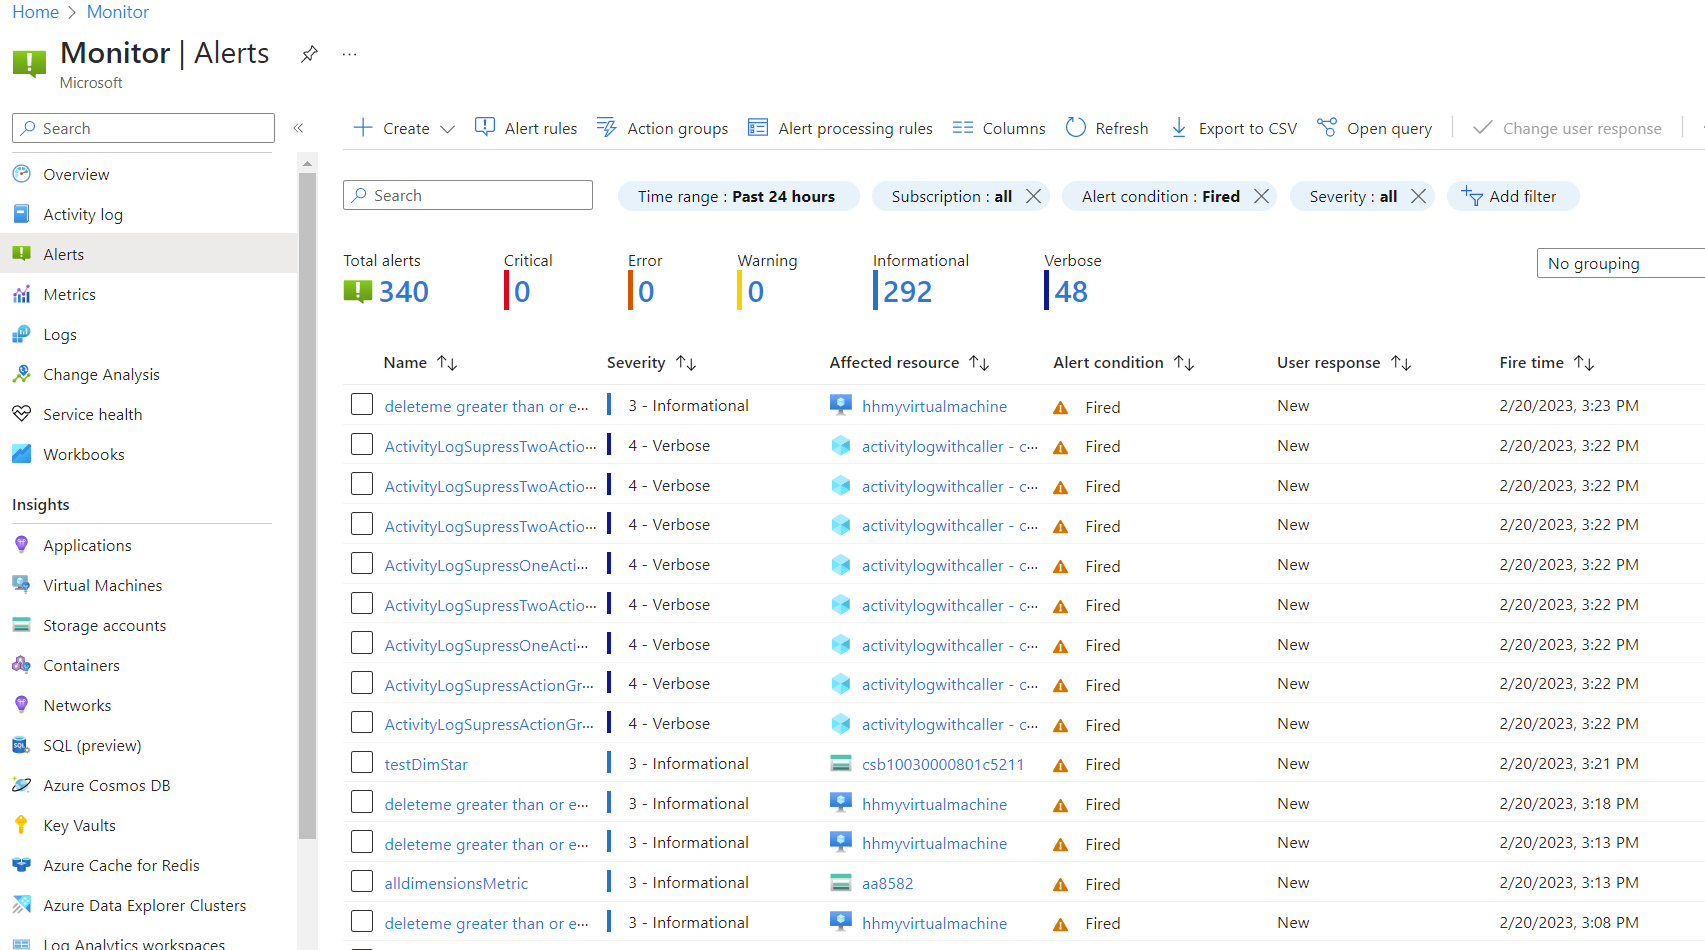
You can filter the list of rules using the available filters:
- Subscription
- Alert condition
- Severity
- User response
- Monitor service
- Signal type
- Resource group
- Target resource type
- Resource name
- Suppression status
Note
If you filter on a
target resource typescope, the alerts rules list doesn’t include resource health alert rules. To see the resource health alert rules, remove theTarget resource typefilter, or filter the rules based on theResource grouporSubscription.Select an alert rule or use the checkboxes on the left to select multiple alert rules.
If you select multiple alert rules, you can enable or disable the selected rules. Selecting multiple rules can be useful when you want to perform maintenance on specific resources.
If you select a single alert rule, you can edit, disable, duplicate, or delete the rule in the alert rule pane.
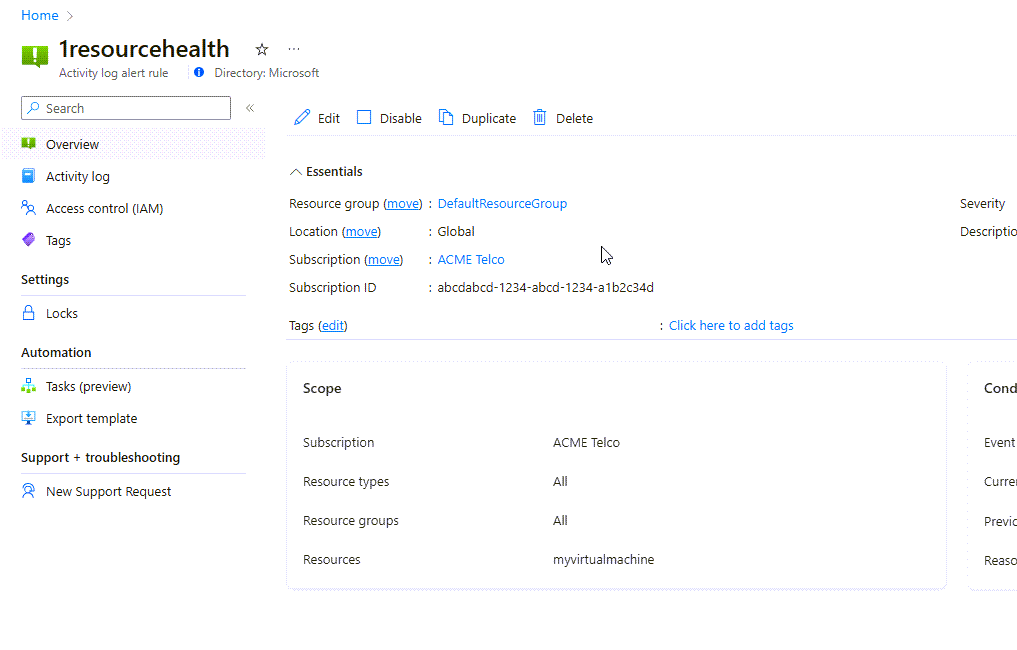
To edit an alert rule, select Edit, and then edit any of the fields in the following sections. You can't edit the Alert Rule Name, or the Signal type of an existing alert rule.
- Scope. You can edit the scope for all alert rules other than:
- Log search alert rules
- Metric alert rules that monitor a custom metric
- Smart detection alert rules
- Condition. Learn more about conditions for metric alert rules, log search alert rules, and activity log alert rules
- Actions
- Alert rule details
- Scope. You can edit the scope for all alert rules other than:
Select Save on the top command bar.
Note
This section describes how to manage alert rules created in the latest UI or using an API version later than 2018-04-16. See View and manage log search alert rules created in previous versions for information about how to view and manage log search alert rules created in the previous UI.
Enable recommended alert rules in the Azure portal
You can create a new alert rule, or enable recommended out-of-the-box alert rules in the Azure portal.
The system compiles a list of recommended alert rules based on:
- The resource provider’s knowledge of important signals and thresholds for monitoring the resource.
- Data that tells us what customers commonly alert on for this resource.
Note
The alert rule recommendations feature is enabled for:
- Virtual machines
- AKS resources
- Log Analytics workspaces
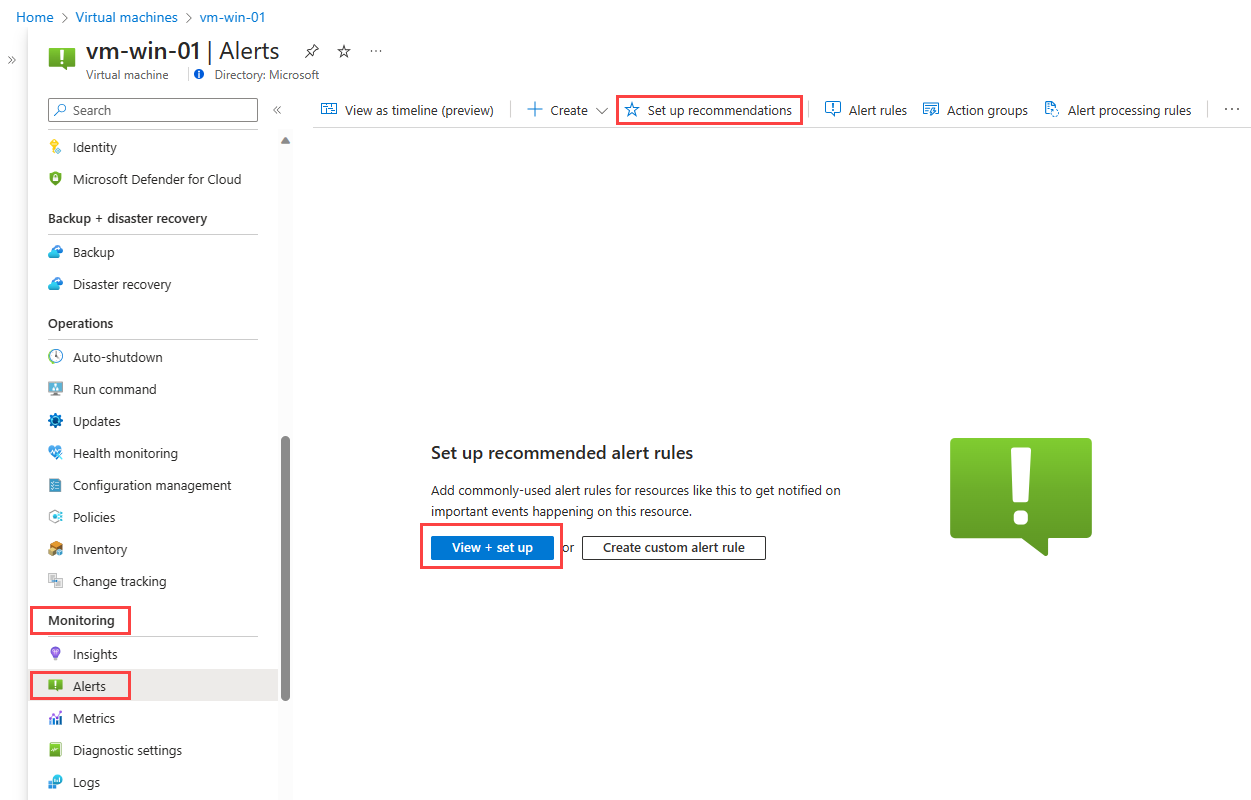
To enable recommended alert rules:
In the left pane, select Alerts.
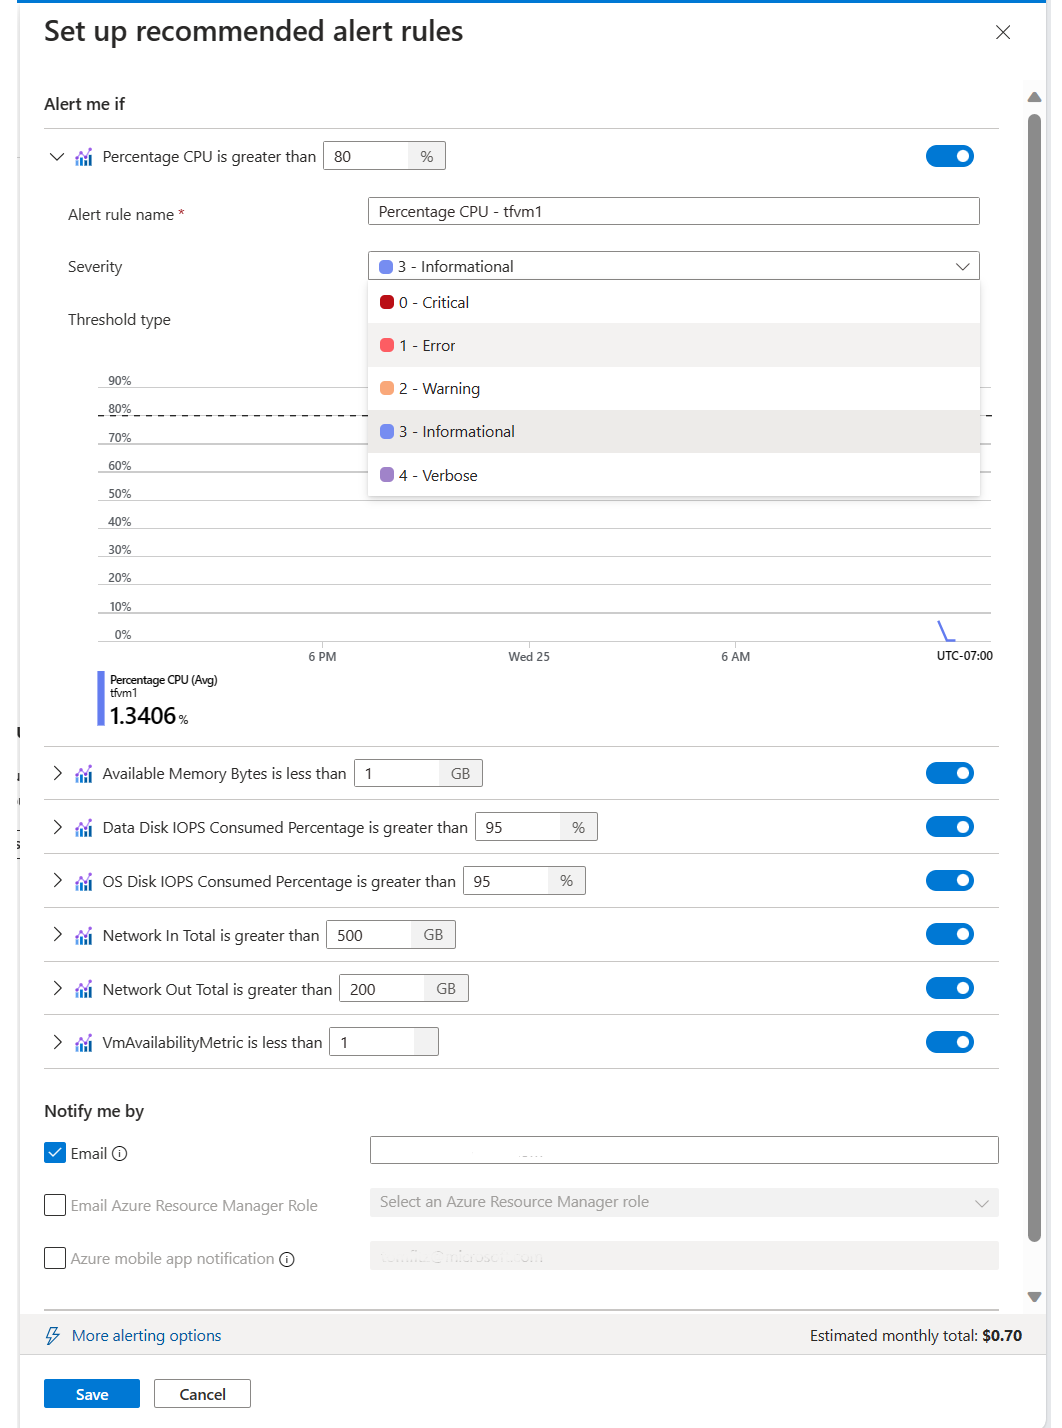
Select View + set up. The Set up recommended alert rules pane opens with a list of recommended alert rules based on your type of resource.
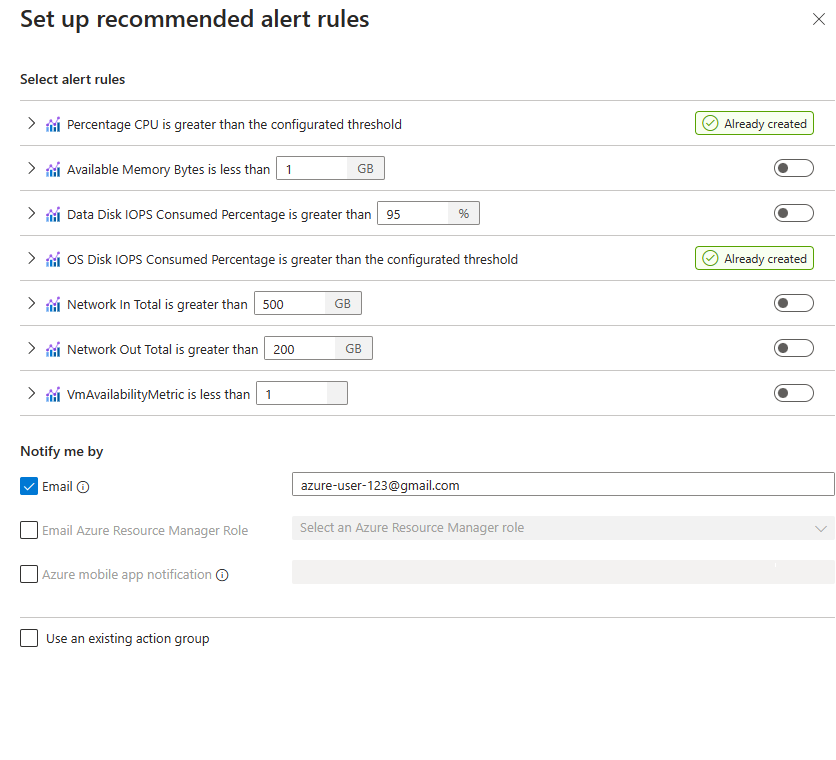
In the Select alert rules section, all recommended alerts are populated with the default values for the rule condition, such as the percentage of CPU usage that you want to trigger an alert. You can change the default values if you would like, or turn off an alert.
Expand each of the alert rules to see its details. By default, the severity for each is Informational. You can change to another severity if you'd like.
In the Notify me by section, select the way you want to be notified if an alert is fired.
Select Use an existing action group, and enter the details of the existing action group if you want to use an action group that already exists.
Select Save.
See the history of when an alert rule triggered
To see the history of an alert rule, you must have a role with read permissions on the subscription containing the resource on which the alert fired.
In the portal, select Monitor, then Alerts.
From the top command bar, select Alert rules. The page shows all your alert rules on all subscriptions.

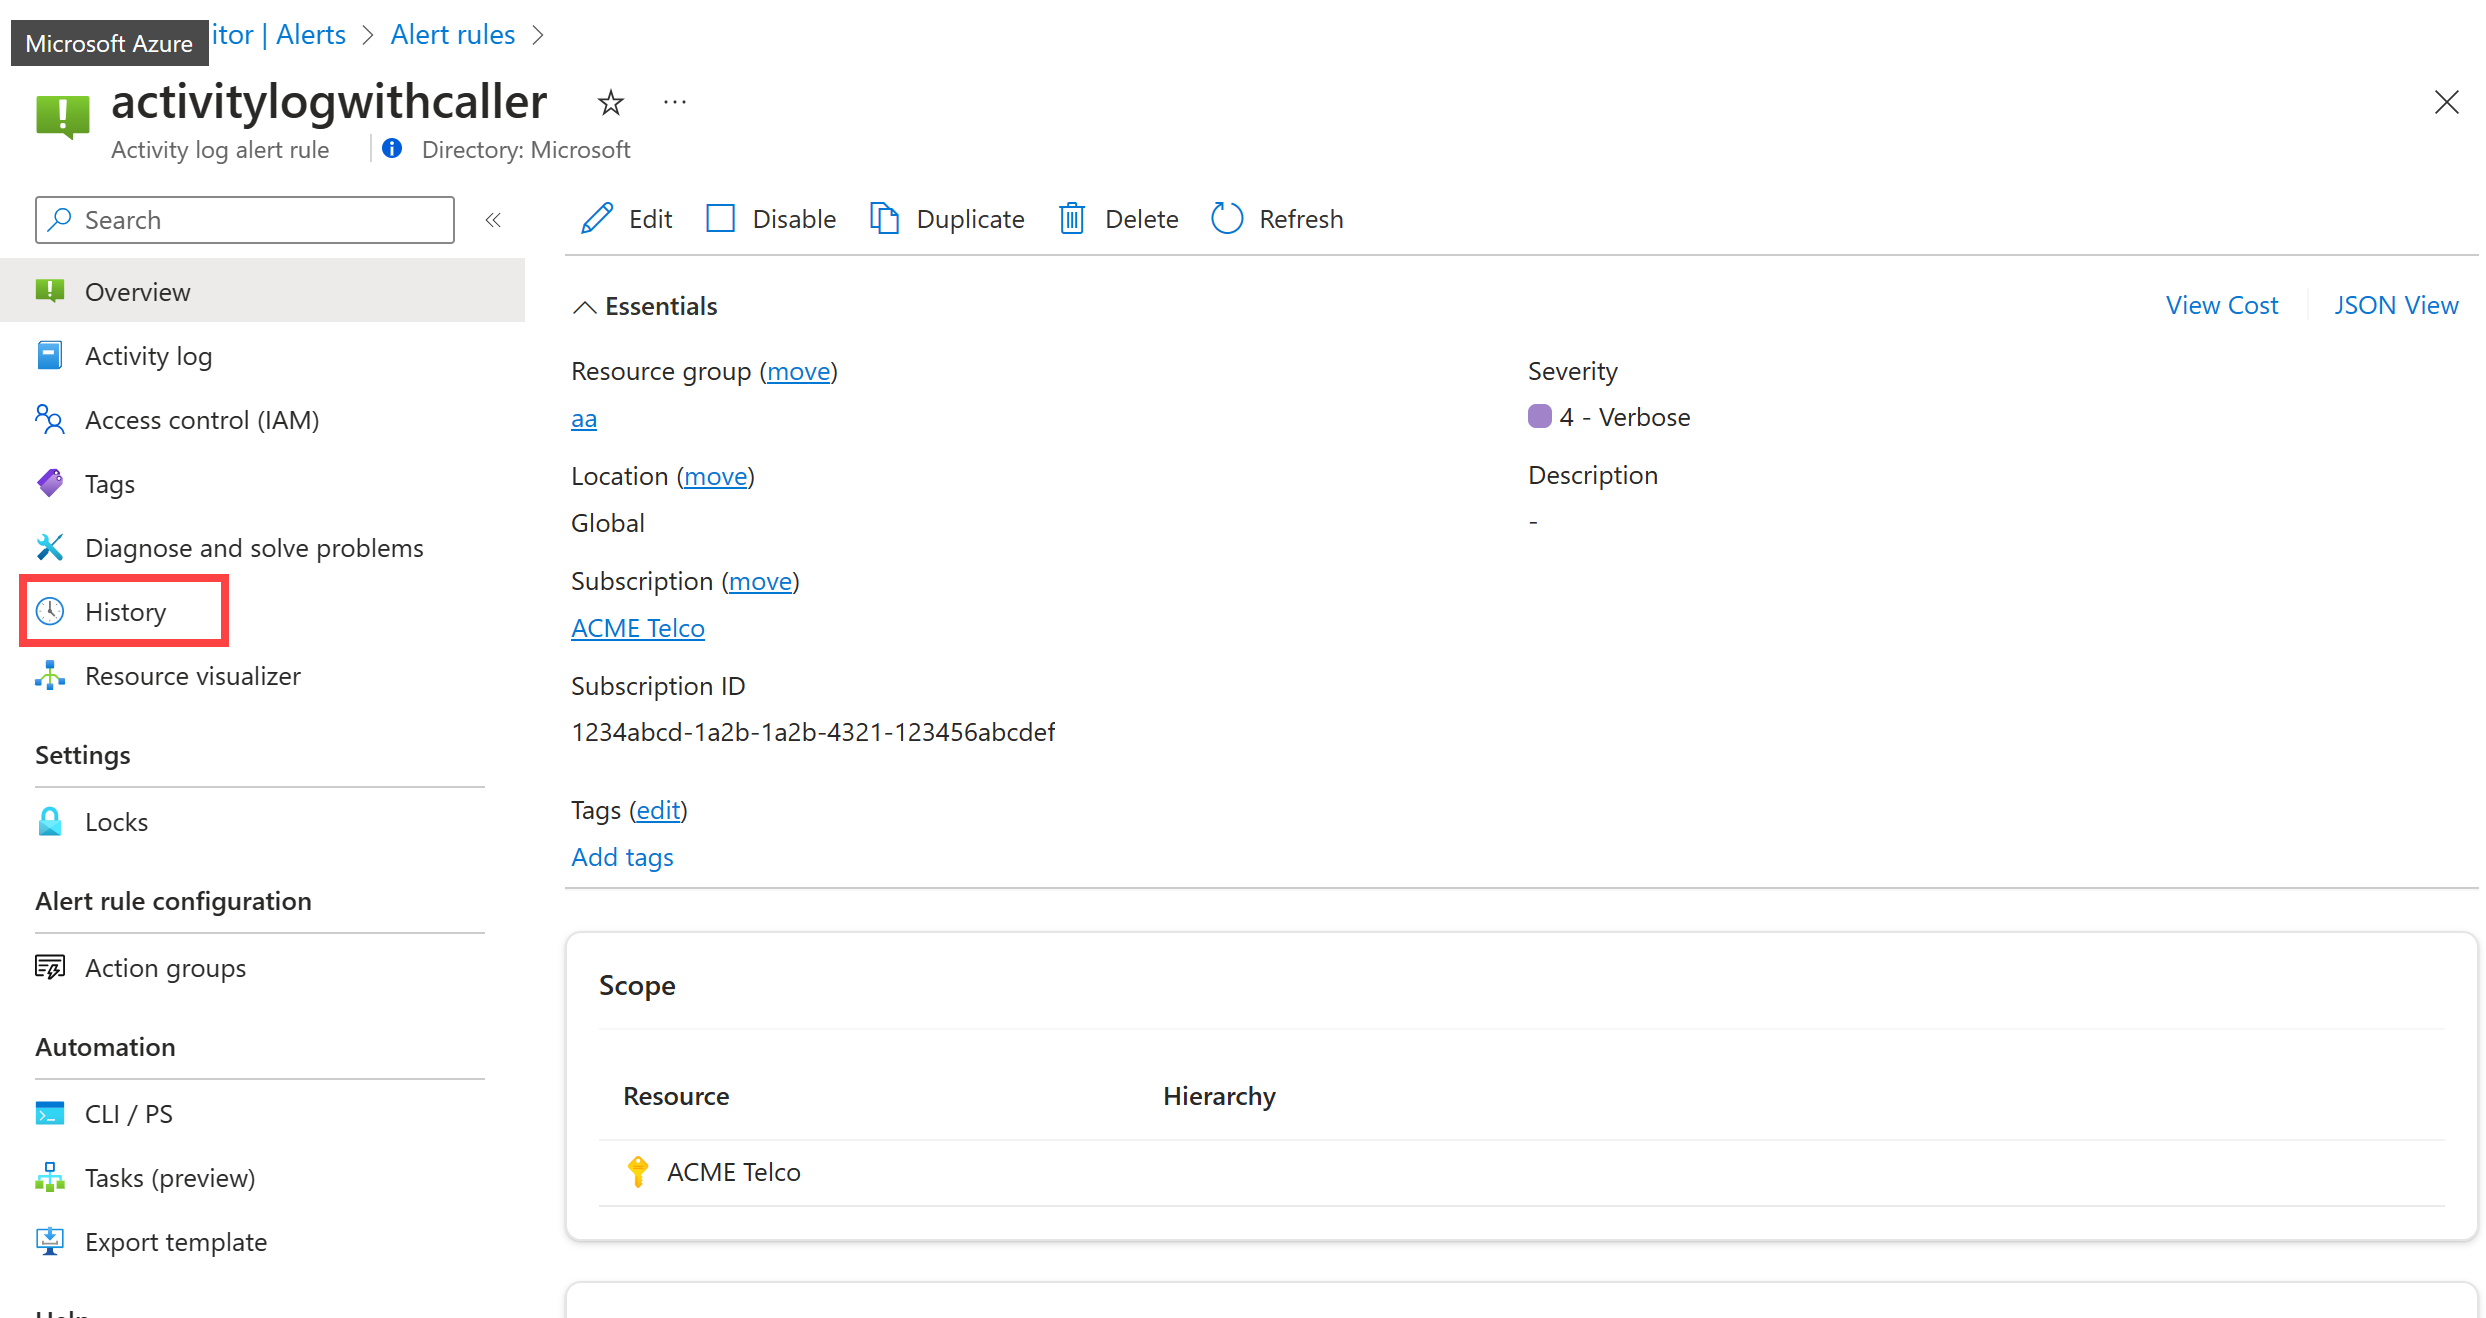
Select an alert rule, and then select History on the left pane to see the history of when the alert rule triggered.
Manage metric alert rules with the Azure CLI
This section describes how to manage metric alert rules using the cross-platform Azure CLI. The following examples use Azure Cloud Shell.
In the portal, select Cloud Shell.
Use these options of the
az monitor metrics alertCLI command in this table:What you want to do CLI command View all the metric alerts in a resource group az monitor metrics alert list -g {ResourceGroup}See the details of a metric alert rule az monitor metrics alert show -g {ResourceGroup} -n {AlertRuleName}az monitor metrics alert show --ids {RuleResourceId}Disable a metric alert rule az monitor metrics alert update -g {ResourceGroup} -n {AlertRuleName} --enabled falseDelete a metric alert rule az monitor metrics alert delete -g {ResourceGroup} -n {AlertRuleName}Learn more about the command az monitor metrics alert --help
Manage metric alert rules with PowerShell
Metric alert rules have these dedicated PowerShell cmdlets:
- Add-AzMetricAlertRuleV2: Create a new metric alert rule or update an existing one.
- Get-AzMetricAlertRuleV2: Get one or more metric alert rules.
- Remove-AzMetricAlertRuleV2: Delete a metric alert rule.
Manage metric alert rules with REST API
- Create Or Update: Create a new metric alert rule or update an existing one.
- Get: Get a specific metric alert rule.
- List By Resource Group: Get a list of metric alert rules in a specific resource group.
- List By Subscription: Get a list of metric alert rules in a specific subscription.
- Update: Update a metric alert rule.
- Delete: Delete a metric alert rule.
Delete metric alert rules defined on a deleted resource
When you delete an Azure resource, associated metric alert rules aren't deleted automatically. To delete alert rules associated with a resource that's been deleted:
- Open the resource group in which the deleted resource was defined.
- In the list that displays the resources, select the Show hidden types checkbox.
- Filter the list by Type == microsoft.insights/metricalerts.
- Select the relevant alert rules and select Delete.
Check the number of metric alert rules in use
To check the current number of metric alert rules in use, follow the next steps.
From the Azure portal
- Open the Alerts screen and select Manage alert rules.
- Filter to the relevant subscription by using the Subscription dropdown box.
- Make sure not to filter to a specific resource group, resource type, or resource.
- In the Signal type dropdown box, select Metrics.
- Verify that the Status dropdown box is set to Enabled.
- The total number of metric alert rules are displayed above the alert rules list.
Using the API
- PowerShell: Get-AzMetricAlertRuleV2
- REST API: List by subscription
- Azure CLI: az monitor metrics alert list
Manage log search alert rules using the CLI
This section describes how to manage log search alerts using the cross-platform Azure CLI. The following examples use Azure Cloud Shell.
Note
Azure CLI support is only available for the scheduledQueryRules API version 2021-08-01 and later. Previous API versions can use the Azure Resource Manager CLI with templates as described below. If you use the legacy Log Analytics Alert API, you will need to switch to use CLI. Learn more about switching.
In the portal, select Cloud Shell.
Use these options of the
az monitor scheduled-query alertCLI command in this table:What you want to do CLI command View all the log alert rules in a resource group az monitor scheduled-query list -g {ResourceGroup}See the details of a log alert rule az monitor scheduled-query show -g {ResourceGroup} -n {AlertRuleName}az monitor scheduled-query show --ids {RuleResourceId}Disable a log alert rule az monitor scheduled-query update -g {ResourceGroup} -n {AlertRuleName} --disabled trueDelete a log alert rule az monitor scheduled-query delete -g {ResourceGroup} -n {AlertRuleName}Learn more about the command az monitor scheduled-query --help
Manage log search alert rules using the Azure Resource Manager CLI with templates
az login
az deployment group create \
    --name AlertDeployment \
    --resource-group ResourceGroupofTargetResource \
    --template-file mylogalerttemplate.json \
    --parameters @mylogalerttemplate.parameters.json
A 201 response is returned on successful creation. 200 is returned on successful updates.
Manage log search alert rules with PowerShell
Log search alert rules have this dedicated PowerShell cmdlet:
- New-AzScheduledQueryRule: Creates a new log search alert rule or updates an existing log search alert rule.
Check the number of log alert rules in use
In the Azure portal
- On the Alerts screen in Azure Monitor, select Alert rules.
- In the Subscription dropdown control, filter to the subscription you want. (Make sure you don't filter to a specific resource group, resource type, or resource.)
- In the Signal type dropdown control, select Log Search.
- Verify that the Status dropdown control is set to Enabled.
The total number of log search alert rules is displayed above the rules list.
Using the API
- PowerShell - Get-AzScheduledQueryRule
- CLI: az monitor scheduled-query list
- REST API - List by subscription
Manage activity log alert rules using PowerShell
Activity log alerts have these dedicated PowerShell cmdlets:
- Set-AzActivityLogAlert: Creates a new activity log alert or updates an existing activity log alert.
- Get-AzActivityLogAlert: Gets one or more activity log alert resources.
- Enable-AzActivityLogAlert: Enables an existing activity log alert and sets its tags.
- Disable-AzActivityLogAlert: Disables an existing activity log alert and sets its tags.
- Remove-AzActivityLogAlert: Removes an activity log alert.
