Megjegyzés
Az oldalhoz való hozzáféréshez engedély szükséges. Megpróbálhat bejelentkezni vagy módosítani a címtárat.
Az oldalhoz való hozzáféréshez engedély szükséges. Megpróbálhatja módosítani a címtárat.
Fontos
2025.02.26-ától a MedTech szolgáltatás már nem érhető el a következő régiókban: Egyesült Királyság nyugati régiója, Egyesült Arab Emírségek északi régiója, Észak-Dél-Afrika, Katar középső régiója.
In this article, learn how to use the MedTech service monitoring and health check tabs in the Azure portal. The monitoring and health check tabs provide access to crucial MedTech service metrics and health checks. These metrics and health checks can be used in assessing the health and performance of your MedTech service and can be useful seeing patterns and/or trends or assisting with troubleshooting your MedTech service.
Use the MedTech service monitoring tab
Within your Azure Health Data Services workspace, select MedTech service under Services.

Select the MedTech service that you would like to display metrics for. For this example, we'll select a MedTech service named mt-azuredocsdemo. You'll be selecting a MedTech service within your own Azure Health Data Services workspace.

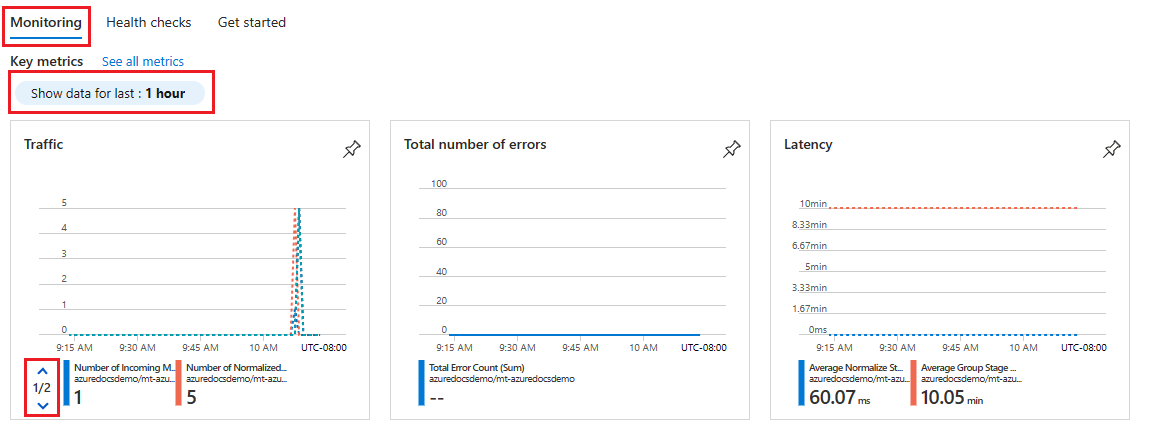
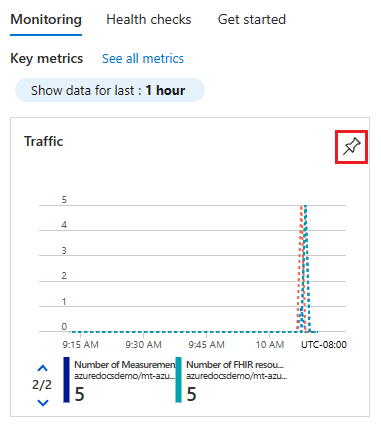
The MedTech service monitoring tab opens, displaying a subset of the supported MedTech service metrics. By default, the Show data for last option is set to 1 hour. To adjust the time duration, select the Show data for last option, select the time period you would like to view, and select Apply. Select the down arrow in the Traffic MedTech service metrics tile to display the next set of MedTech service traffic metrics.
Fontos
If you leave the MedTech service monitoring tab, any customized settings you have made to the monitoring settings are lost and will have to be recreated. If you would like to save your customizations for future viewing, you can pin them to an Azure portal dashboard as a tile.
To learn how to customize and save metrics settings to an Azure portal dashboard and tile, see How to configure the MedTech service metrics.
Optional - Select the pin icon to save the metrics tile to an Azure portal dashboard of your choosing.
Jótanács
To learn more about advanced metrics display and sharing options, see Analyze metrics with Azure Monitor metrics explorer.


Available metrics for the MedTech service
This table shows the available MedTech service metrics and the information that the metrics are capturing. The metrics in bold are the metrics displayed within the Monitoring tab:
| Metric category | Metric name | Metric description |
|---|---|---|
| Elérhetőség | IotConnector Health Status | The overall health of the MedTech service. |
| Errors | Total Error Count | The total number of errors. |
| Latencia | Average Group Stage Latency | The average latency of the group stage. The group stage performs buffering, aggregating, and grouping on normalized messages. |
| Latencia | Average Normalize Stage Latency | The average latency of the normalized stage. The normalized stage performs normalization on raw incoming messages. |
| Traffic | Number of Fhir resources saved | The total number of FHIR® resources updated or persisted by the MedTech service. |
| Traffic | Number of Incoming Messages | The number of received raw incoming messages (for example, the device events) from the configured source event hub. |
| Traffic | Number of Measurements | The number of normalized value readings received by the FHIR transformation stage of the MedTech service. |
| Traffic | Number of Message Groups | The number of groups that have messages aggregated in the designated time window. |
| Traffic | Number of Normalized Messages | The number of normalized messages. |
Use the MedTech service health checks tab
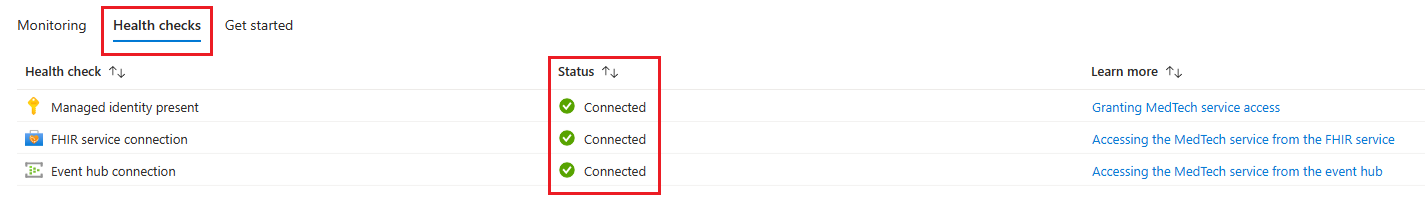
Select the Health checks tab within your MedTech service to display the health checks. In the example, the MedTech service is passing all health checks as indicated by the Status row and the Connected status.
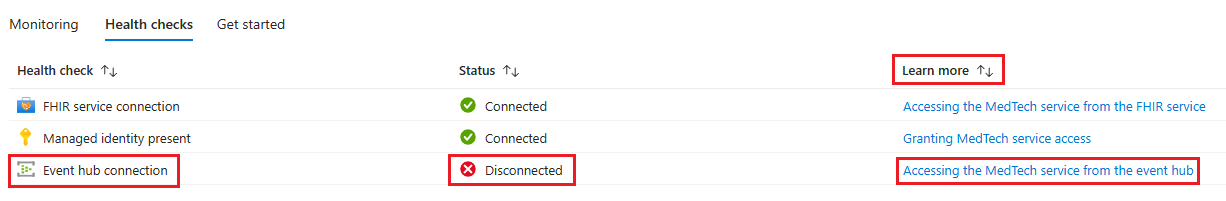
In this example, we can see that the MedTech service is indicating that the Health check for Event hub connection is showing a Status of Disconnected. To find out how to troubleshoot this failed health check, you can select the Accessing the MedTech service from the event hub link under the Learn more row to be directed to the MedTech service troubleshooting guide section for addressing this failed health check.


Következő lépések
A MedTech szolgáltatásmetrikáinak konfigurálása
Diagnosztikai beállítások engedélyezése a MedTech szolgáltatáshoz
Megjegyzés:
Az FHIR® a HL7 bejegyzett védjegye, amelyet a HL7 engedélyével használnak.