Megjegyzés
Az oldalhoz való hozzáféréshez engedély szükséges. Megpróbálhat bejelentkezni vagy módosítani a címtárat.
Az oldalhoz való hozzáféréshez engedély szükséges. Megpróbálhatja módosítani a címtárat.
This guide describes how to access, view, and filter Microsoft Purview asset insight reports for your data.
In this guide, you'll learn how to:
- View data estate insights from your Microsoft Purview account.
- Get a bird's eye view of your data.
- Drill down for more asset count details.
Prerequisites
Before getting started with Microsoft Purview Data Estate Insights, make sure that you've completed the following steps:
- Set up a storage resource and populated the account with data.
- Set up and completed a scan your storage source. For more information to create and complete a scan, see the manage data sources in Microsoft Purview article.
- Permissions depending on your current experience:
- If using the classic Microsoft Purview Catalog, you need the data curator role or insight reader role.
- If using the new Microsoft Purview Unified Catalog, you need data health reader permissions.
Understand your asset inventory in Data Estate Insights
In Microsoft Purview Data Estate Insights, you can get an overview of the assets that have been scanned into the Data Map and view key gaps that can be closed by governance stakeholders, for better governance of the data estate.
Open the Microsoft Purview portal.
If you're using the classic Microsoft Purview portal, select the Data estate insights
 menu item. If you're using the new Microsoft Purview portal open Unified Catalog, select the Health Management drop down, and then select Reports.
Select the Assets report.
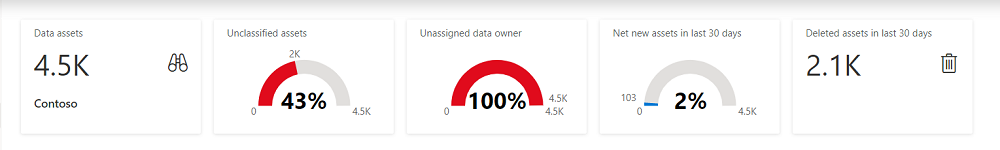
The Assets Summary report provides several high-level KPIs, with these graphs:
- Unclassified assets: Assets with no system or custom classification on the entity or its columns.
- Unassigned data owner: Assets that have the owner attribute within "Contacts" tab as blank.
- Net new assets in last 30 days: Assets that were added to the Purview account, via data scan or Atlas API pushes.
- Deleted assets in last 30 days: Assets that were deleted from the Purview account, as a result of deletion from data sources.
Below these KPIs, you can also view your data asset distribution by collection.
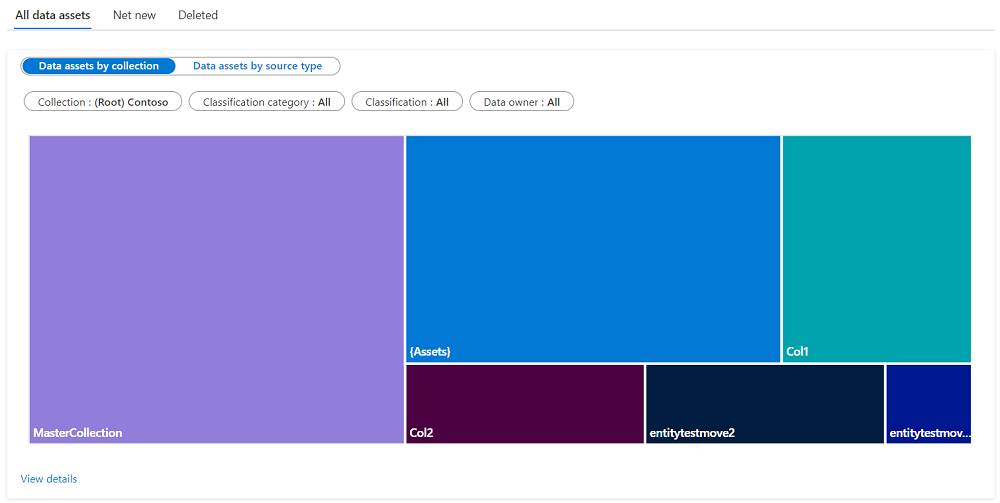
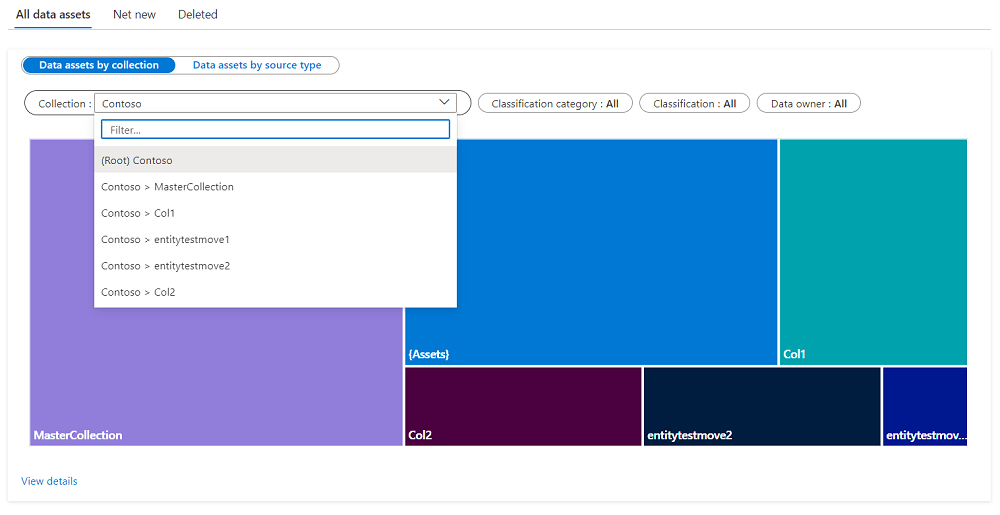
Using filters you can drill down to assets within a specific collection or classification category.
Note
Each classification filter has some common values:
- Applied: Any filter value is applied
- Not Applied: No filter value is applied. For example, if you pick a classification filter with value as "Not Applied", the graph will show all assets with no classification.
- All: Filter values are cleared. Meaning the graph will show all assets, with or without classification.
- Specific: You have picked a specific classification from the filter, and only that classification will be shown.
To learn more about which specific assets are shown in the graph, select View details.
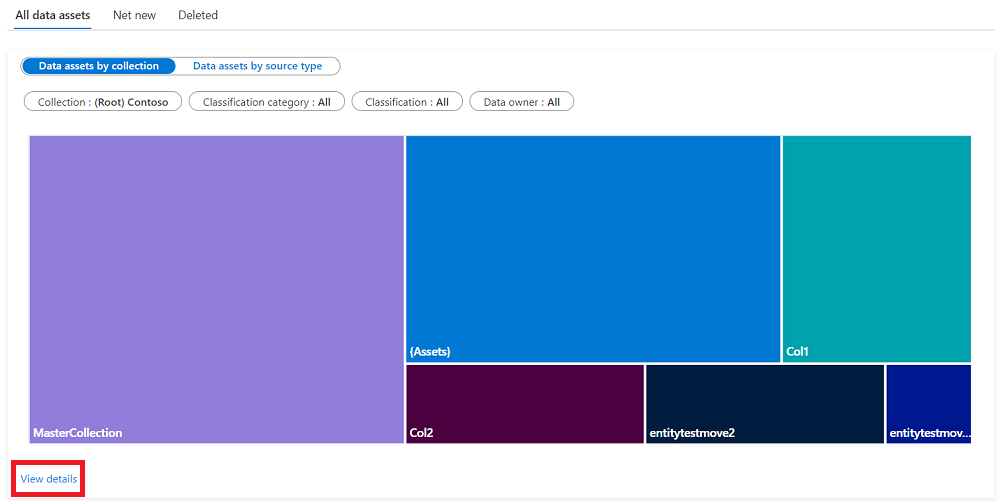
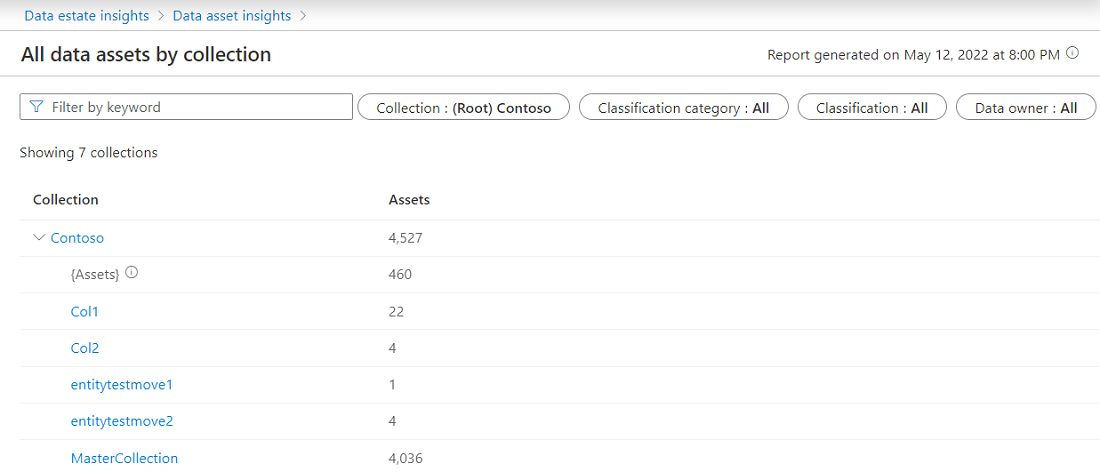
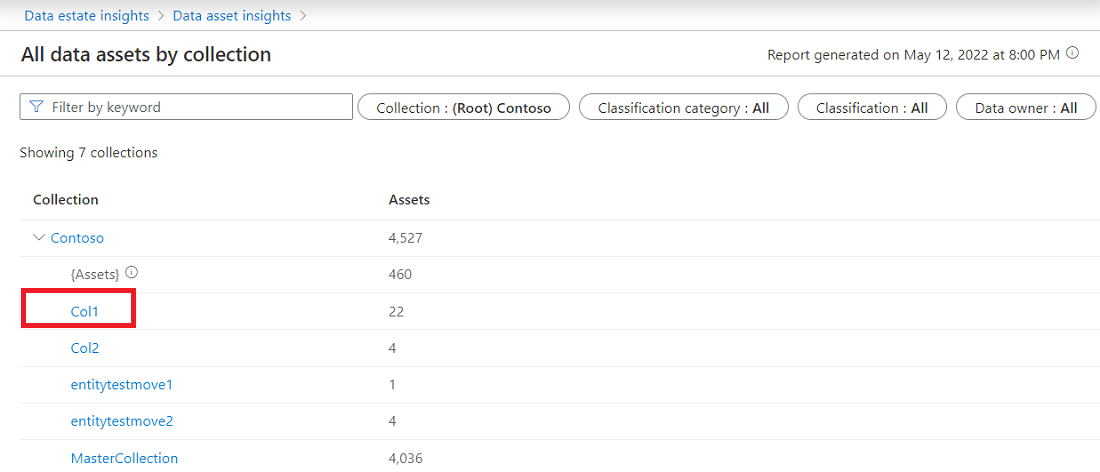
You can select any collection to view the collection's asset list.
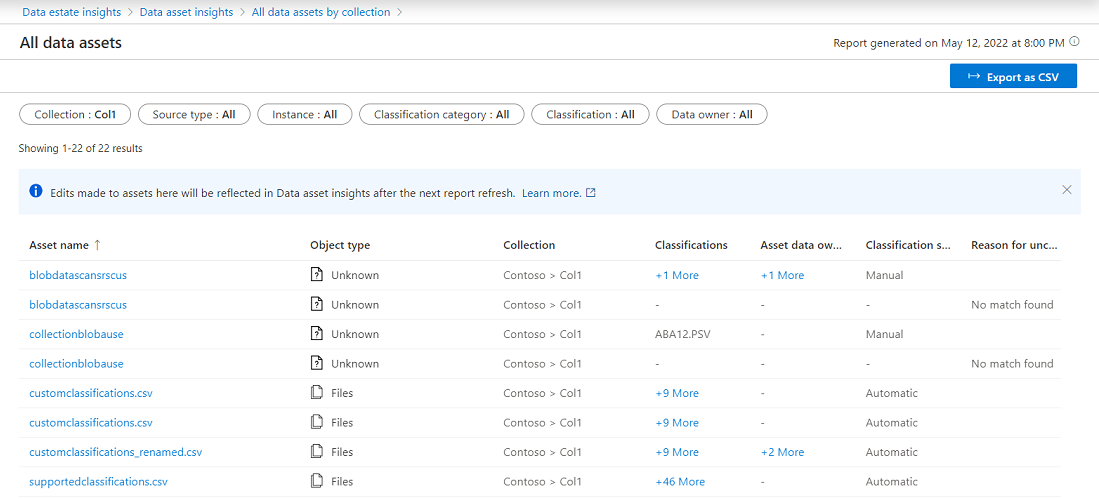
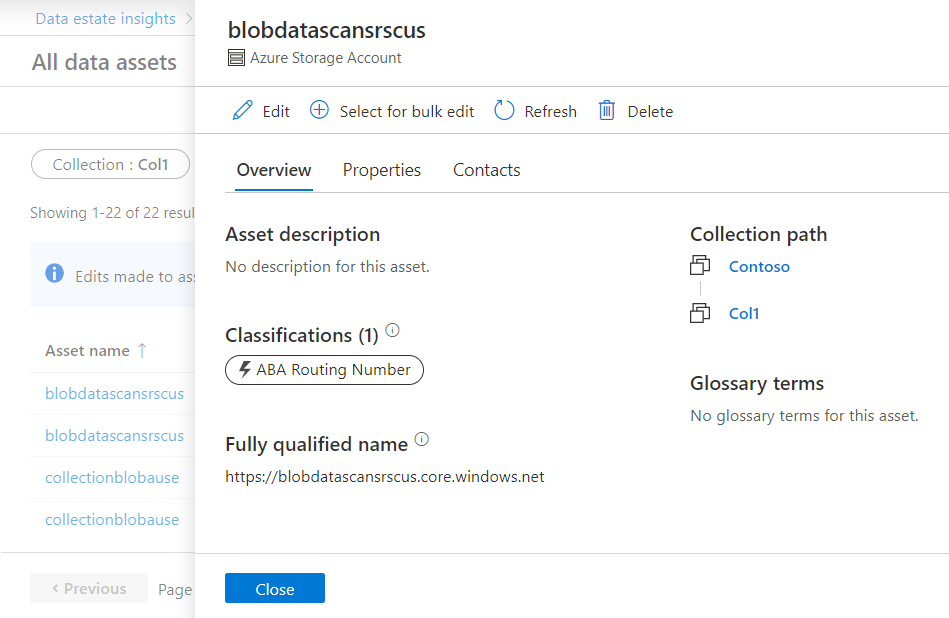
You can also select an asset to edit without leaving the Data Estate Insights App.


File-based source types
The next graphs in asset insights show a distribution of file-based source types. The first graph, called Size trend (GB) of file type within source types, shows top file type size trends over the last 30 days.
Pick your source type to view the file type within the source.
Select View details to see the current data size, change in size, current asset count and change in asset count.
Note
If the scan has run only once in last 30 days or any catalog change like classification addition/removed happened only once in 30 days, then the change information above appears blank.
See the top folders with change top asset counts when you select source type.
Select the path to see the asset list.
The second graph in file-based source types is Files not associated with a resource set. If you expect that all files should roll up into a resource set, this graph can help you understand which assets haven't been rolled up. Missing assets can be an indication of the wrong file-pattern in the folder. You can select View details below the graph for more information.

Next steps
Learn how to use Data Estate Insights with resources below: