QuickStart: Set up Power BI Reports
This article explains how to set up and use the Intelligent Recommendations Power BI Dashboards.
There are two kinds of Intelligent Recommendations reports for customers:
The Signals Dashboard (sigDash) helps users understand and evaluate their input data (also known as signals) from the RecoInteractions and RecoItemsAndVariants data entities, which can determine if there are data quality problems, or potential challenges for model training. Click here for an overview of this Dashboard.
The Intelligent Recommendations Dashboard (irDash) helps users to evaluate models stored in the json files after training and provides insights into relevance. Click here for an overview of this Dashboard.
The following video shows how to set up and use the Intelligent Recommendations Power BI Reports:
Prerequisites
Before setting up the Power BI reports, complete the following prerequisites:
- Download the Power BI Desktop App.
- Have an Intelligent Recommendations account and model successfully complete.
- If you still need to create an account, see the Quick Start guide.
- Ensure that you've updated the RecoItemsAndVariants and RecoInteractions entities with data. If you're using the QuickStart sample data, then these entities are already preconfigured.
- Confirm that you're ready to run the dashboards by checking the logs folder to ensure the model was built. For steps on how to check the logs, visit our error logging set up guide.
Download and set up the Power BI Reports
The steps to downloading your reports are as follows:
- Download the reports.
- Once the reports are downloaded to your computer, you can select a file to open it.
- The Power BI Desktop app will automatically open, and a pop-up window prompts the user for account details to set up each Power BI Report. The sections below explain how to set up the two reports.
Set up the signals dashboard
Users opening the Signals Dashboard receives a pop-up window asking the user to Paste the URL containing the storage container where the model.json file is stored to the dashboard.
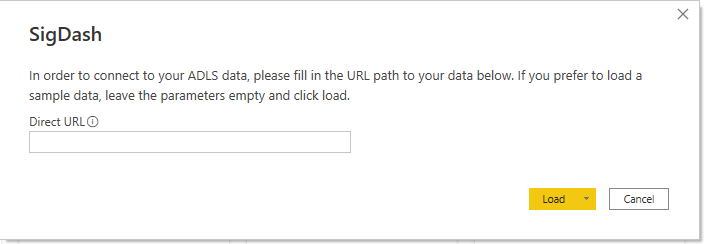
To find the storage container location of your model.json file:
- Open the Azure Storage Portal and select on your storage account.
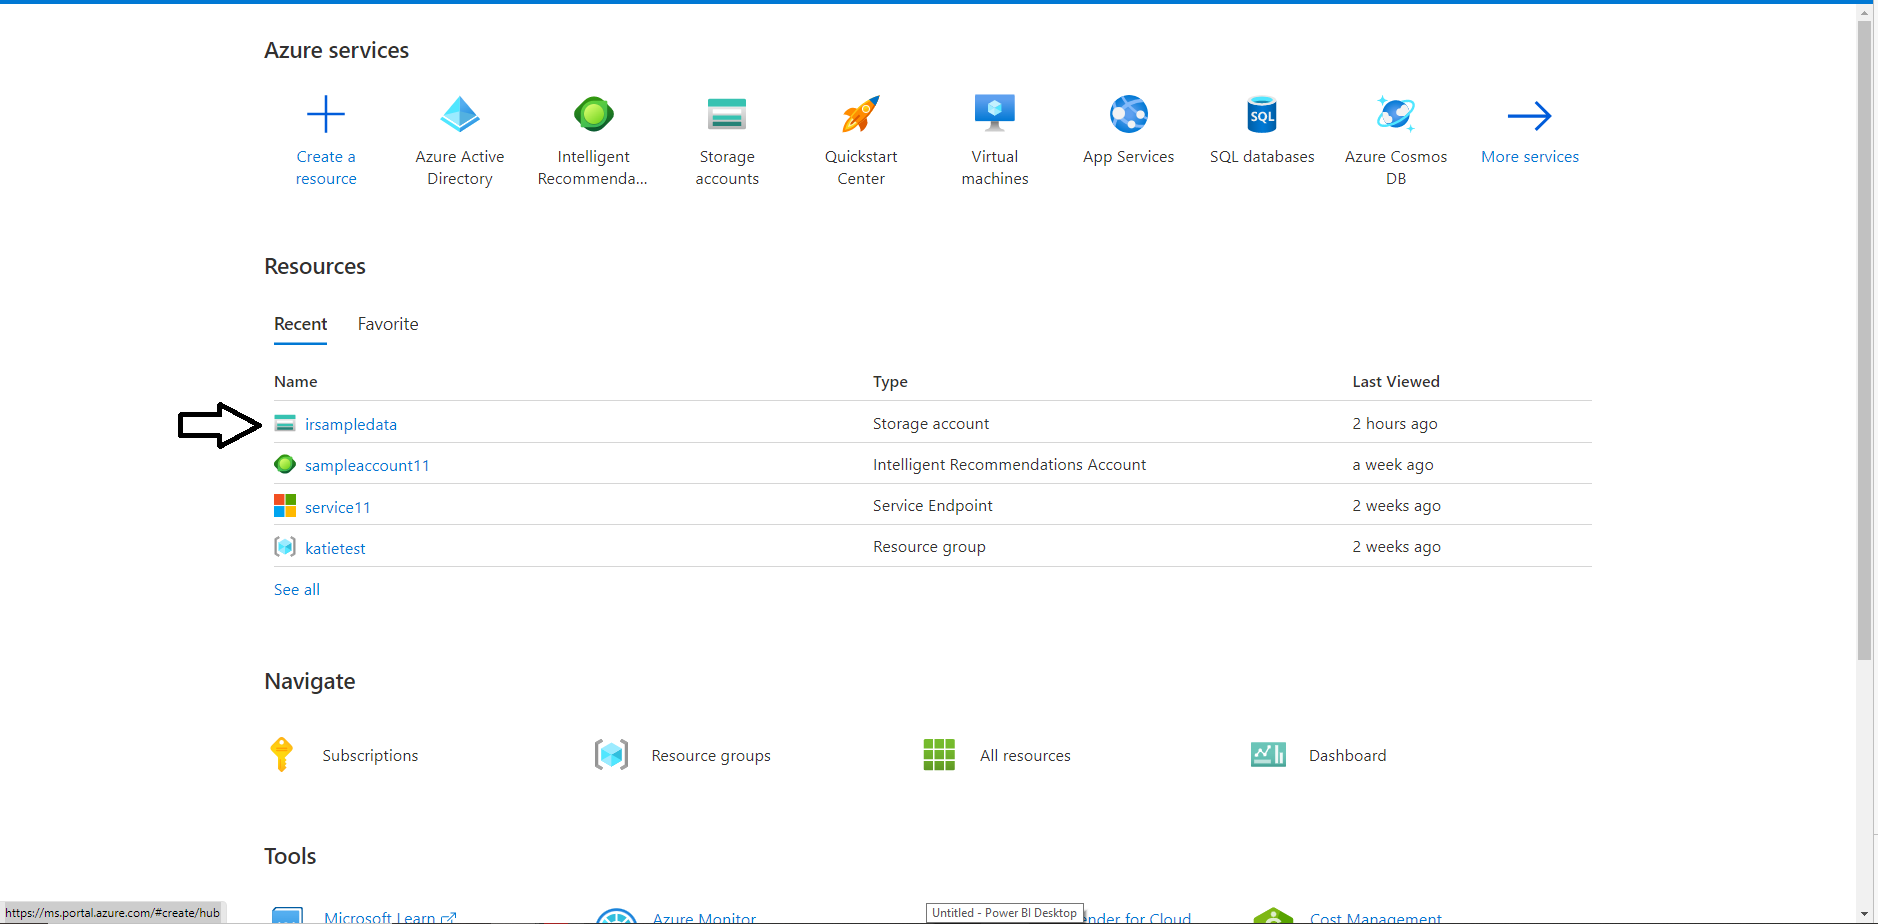
- Select on containers in the left menu.

- Open your container.

- Select properties in the left menu.
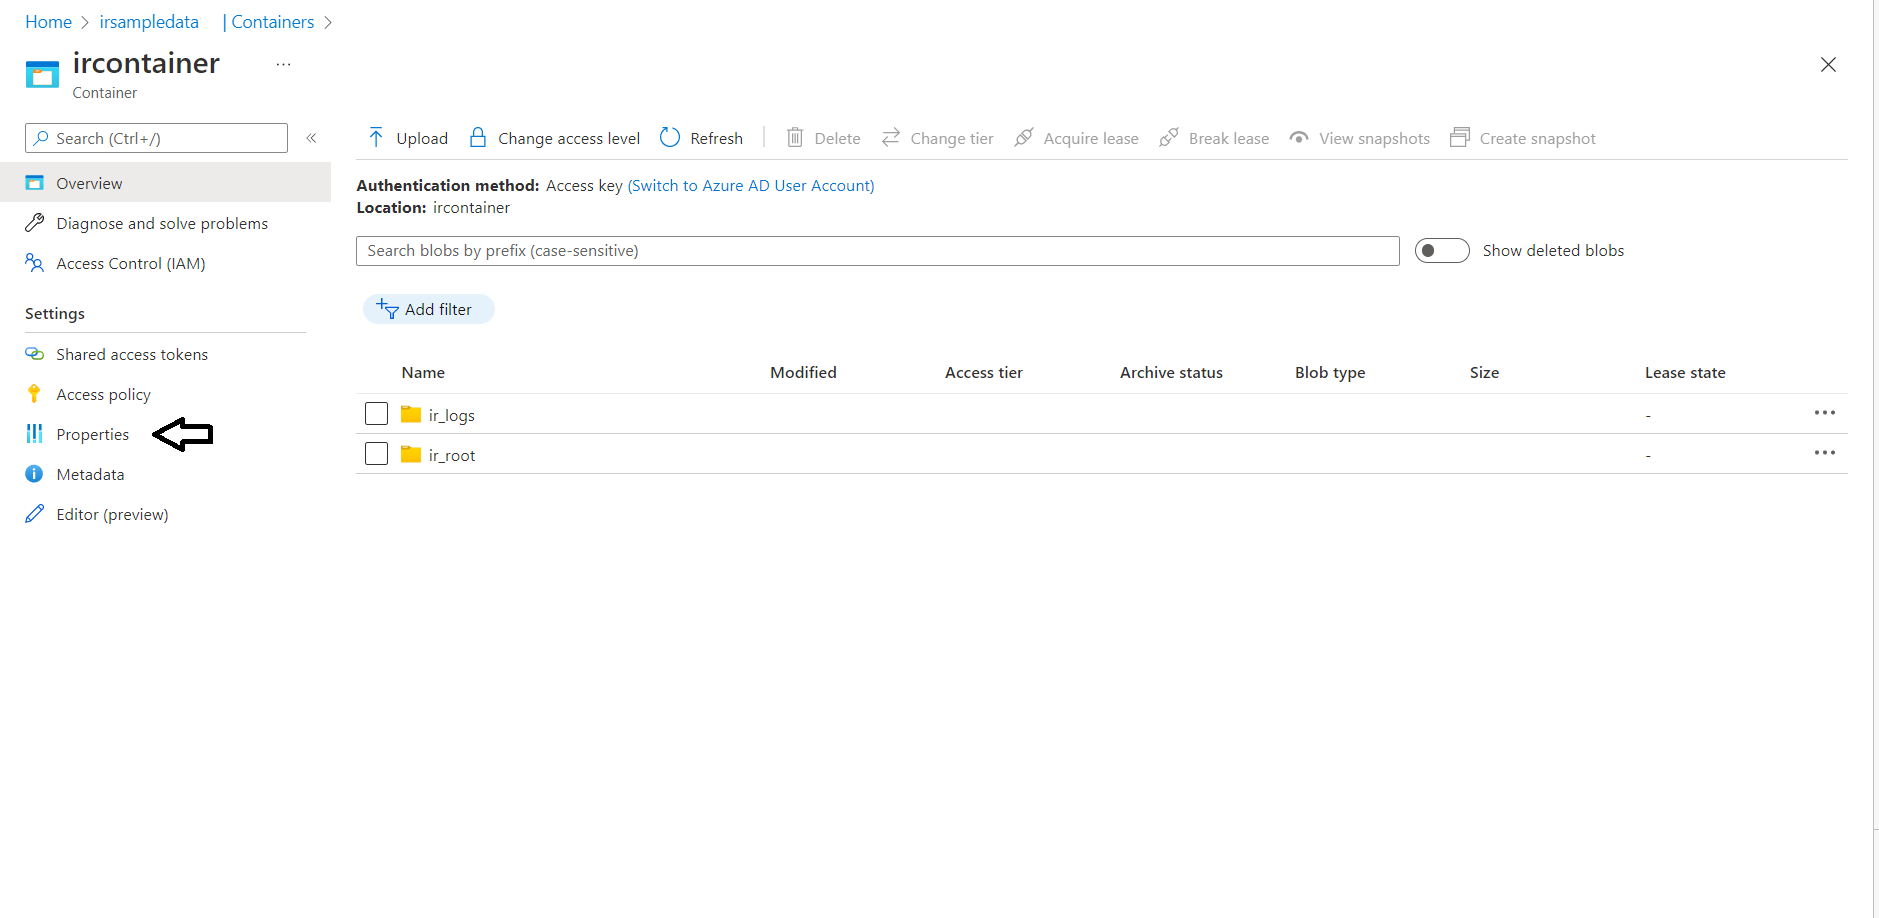
- Copy the URL.

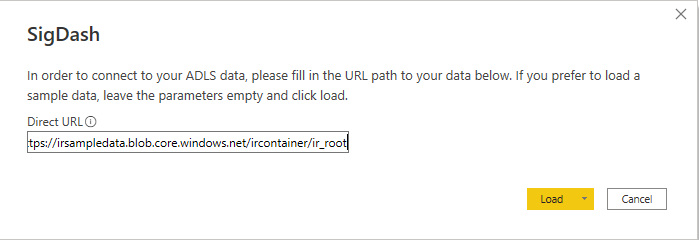
- Paste the URL into the dashboard, then add the extension to your root folder onto the end of the URL. In the example image below, the model.json file is stored in the "ir_root" folder, so it's added to the end of the container URL before pressing load.
Input the account key
The first time you use the dashboard, you're asked to input your account key.
To find the account key:
- Return to your storage account and select on Access Keys in the left menu.

- Select show key.

- Copy the code and paste the value into the Access Key field in the Power BI dashboard and press Connect.

- Upon successful completion of these steps, the signals dashboard populates with data. For more information on the metrics shared in this dashboard, see the signals dashboard overview below. If you make a mistake, close the Power BI application, and reopen the file to start over.
Set up the Intelligent Recommendations dashboard
Opening the Intelligent Recommendations Dashboard file with the Power BI desktop app shows a pop-up window asking for the following information:
- ADLS Storage Account: the name of your Azure storage account.
- Container name: the name of your container within your storage account.
- Reports directory name: the name of your error logs folder.
- Modeling component name: the name of your model.
Here's an example of what the fields should look like with the sample data from the quick start guide:

| Pop-up Information Locations | Image Example |
|---|---|
| To find the ADLS Storage Account, open the Azure Storage Portal and select on your storage account from the list of available resources |  |
| To find the name of your container, open your storage account and select on containers from the left menu. |  |
| To find the name of your reports directory, open your container by clicking on the container name. The container includes both your root and logs folder. The reports directory is the folder that contains your error logs. |  |
| To find the name of your model, open your Intelligent Recommendations Account and select on Modeling in the left menu. The name of your model will be displayed in front of the parentheses. | 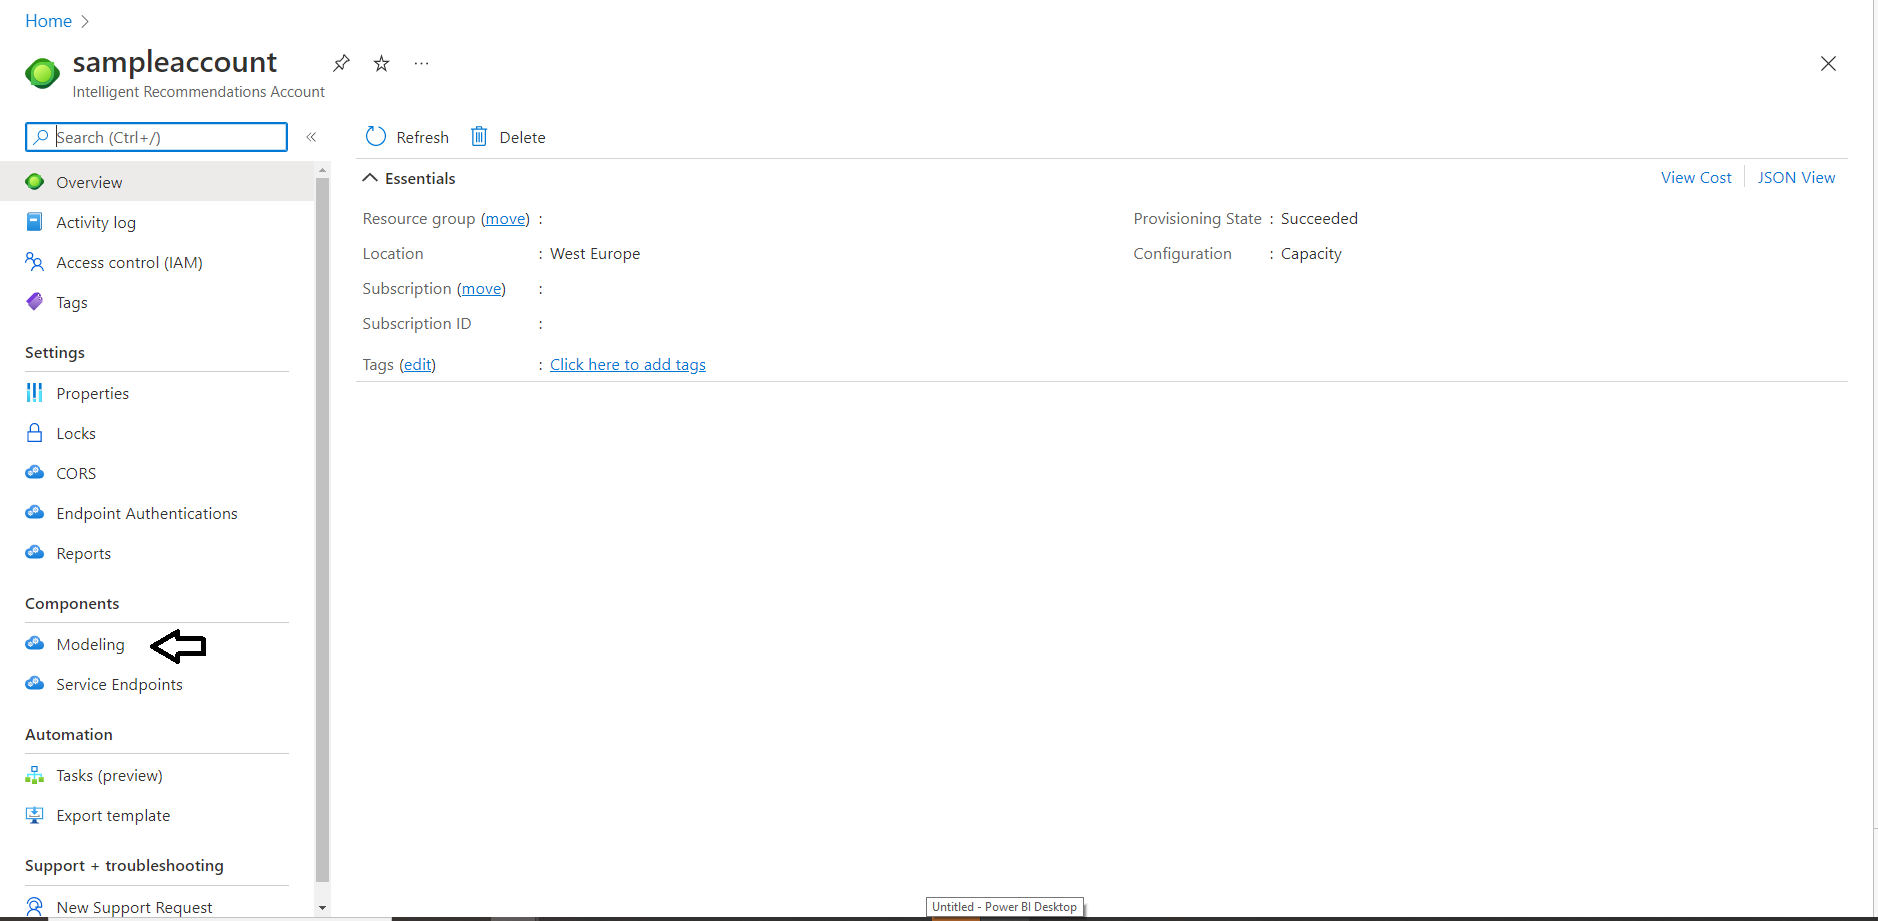 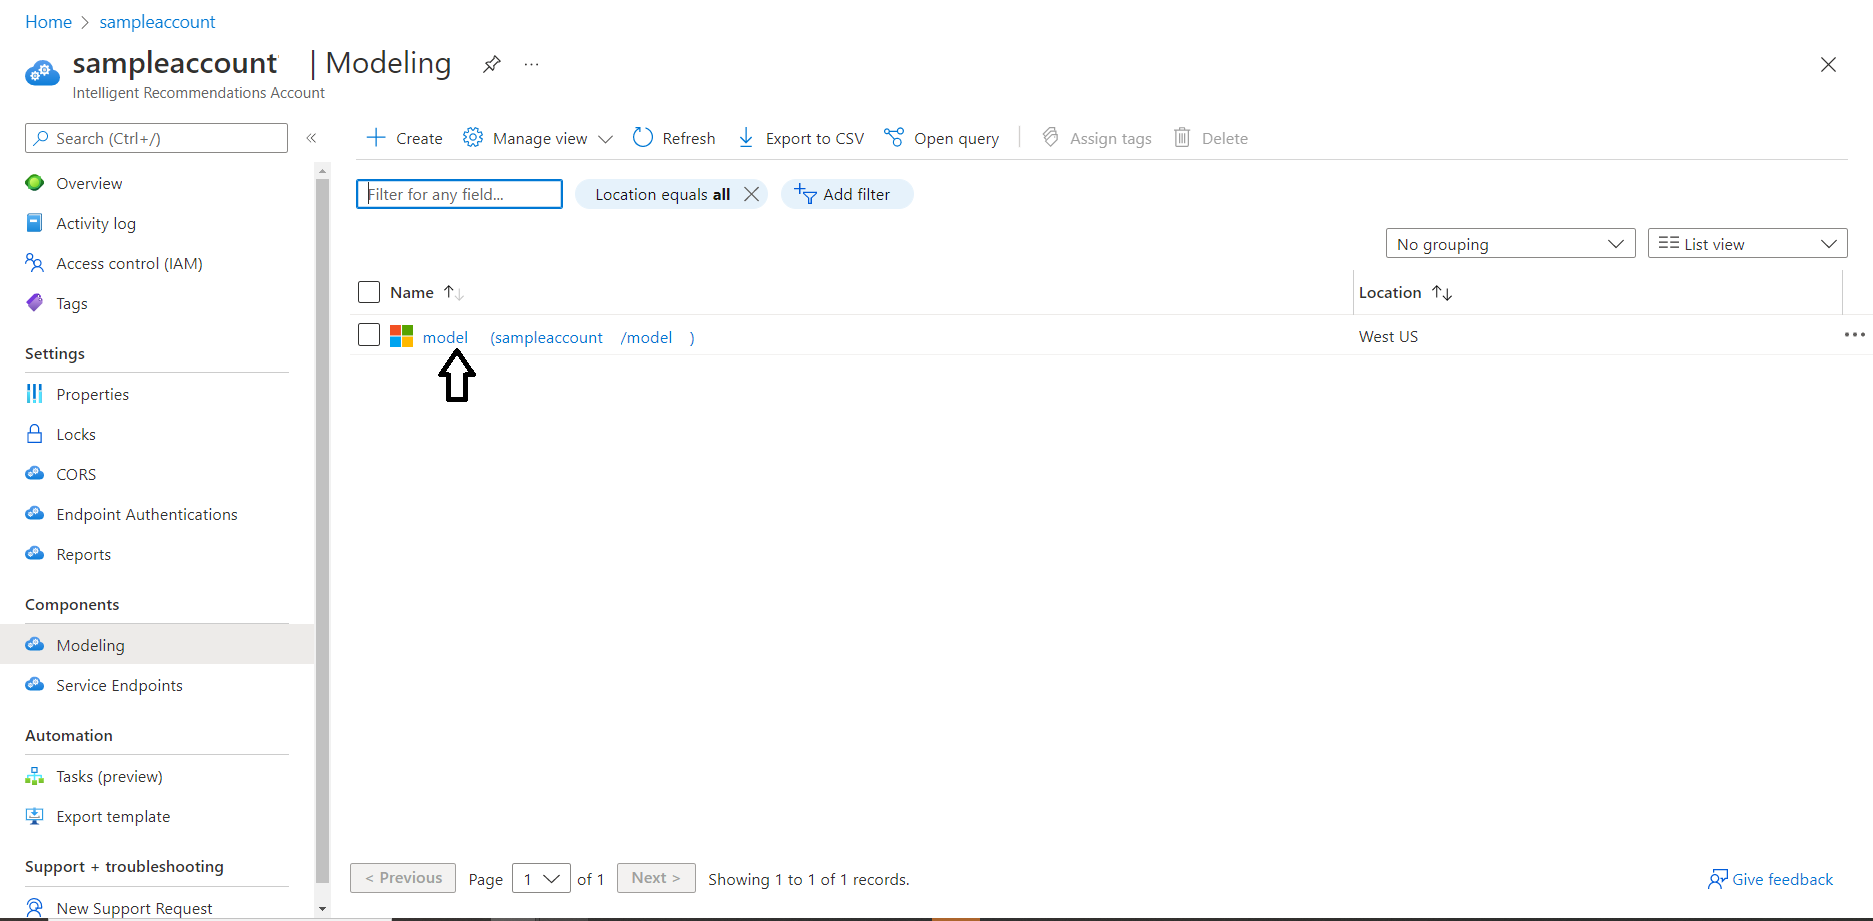 |
Once you have found all your account information, input it into the pop-up window. Select load to connect to the dashboard.
Upon successful completion of these steps, the dashboard populates with data. For more information on the metrics shared in this dashboard, see the Intelligent Recommendations Dashboard Overview. If you make a mistake, close the Power BI application, and reopen the file to start over.
To learn more about the metrics available when using these reports, see the Reports Overview Guide.
See Also
Intelligent Recommendations Dashboard Overview
QuickStart Guide: Set up an Intelligent Recommendations Account