SQL Server On Linux: Core-minidumps and Breakpad
As pointed out in my previous post, debugging on Linux brings a few new twists to those of us used to the Windows debugging landscape. One of these twists is the need to produce a core dump. On Linux a common way to capture a dump is to generate a core dump (gcore, etc.)
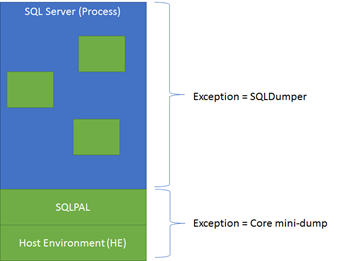
You may have experienced an application crash and the user mode, dump capture on Windows. An application crash is commonly associated with the Windows, ”Watson” and Windows Debugger frameworks. The difference is that a core dump generally contains the entire memory of the process (user mode) where the Windows Debugger captures contain the faulting thread’s memory and a bit more. Lets look at a few examples (areas in green represent memory pages included in a capture.)
|
As you can glean from the file sizes, a mini-dump version of the core dump is preferable. Instead of dumping the entire memory used by the SQL Server process, include the threads, ring buffers and bit of supporting memory. This usually reduces the size of the core dump to ~3GB, compressing to less than 200MB.
On Windows, SQLDumper is used to capture a mini-dump of the user mode memory. SQLDumper leverages the APIs exposed by dbghlp.dll, specifically MiniDumpWriteDump and its callback. In the callback we are able to indicate what threads and memory are to be included or excluded. When SQLDumper is triggered from SQL Server we also provide a rich, but small, set of additional addresses to include (ring buffers, schedulers, etc.) The dbghlp API is able to enumerate the threads, include indirect memory based on pointers stored on the stacks and other information.
When designing the core-mini dump capabilities we looked at several solutions before landing on Breakpad. For example, Linux provides an madvise ABI, with the option to exclude the region from a dump. Excluding is helpful but you have to mark the memory pages before you know about a problem and the madvise setting can lead to splitting of the virtual address range(s) and address range exhaustion (proc/$pid/maps.) There are also options that can be established to exclude certain types of memory, such as no mapped memory regions, but that is too broad of a stroke.
Using additional logic to add memory in combination with Breakpad we are able to target those memory regions relevant to an issue. This technique provides high fidelity for the dump capture and debugging efforts while minimizing the size and time of the capture. Breakpad’s future replacement is Crashpad but we are unable to leverage, it at this time, due to limited support for Linux systems.
The Breakpad dump understands how to enumerate the ELF based threads (proc/$pid/tasks) and memory regions (proc/$pid/maps.) However, it does not add indirect memory references and other regions that may be helpful. Similar to the Windows dbghelp API, Breakpad provides a client library and ABI for writing the core-minidump. While Breakpad does not provide a callback it does allow you to pass in a list of additional memory ranges to include in the dump. This allows us to identify a rich, but small, set of additional addresses to include in the core-minidump.
With a bit of filtering logic, along with understanding the interworking's of SQLPAL, HE and SQL Server, we are able to generate the additional memory range list and leverage the Breakpad client.
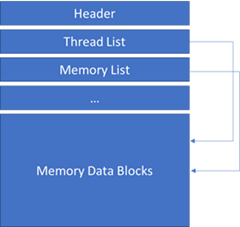
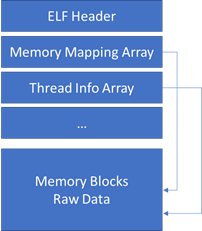
The first stop in this journey was understanding the Breakpad format and achieving the proper dump capture. Breakpad writes its own dump format that looks a lot like the Windows mini-dump format or ELF core dump format. The files have a header, tables describing information and the associated data blocks. For example there is a thread list in the Breakpad output containing an entry for each thread and the internal pointers (RVA – relative virtual address offsets) to stack memory. The following diagram could be a high level view of the Windows, ELF or Breakpad file as they are similar in design.
When Breakpad is invoked to generate a core-minidump, the following information is captured and written to the file.
- Thread List of all ELF threads (/proc/$pid/tasks)
- Mappings (/proc/pid$/maps)
- Additional Memory (the additional regions to be added to the capture)
- Exception Stream (/proc/$pid/status)
- SysInfo Stream
- /proc/cpuinfo
- /proc/$pid/status
- /proc/$pid/etc-lsb-release
- /proc/$pid/cmdline
- /proc/$pid/environment
- /proc/$pid/auxv
- /proc/$pid/maps
- Debug Stream
Microsoft Alterations
A few modifications were required for the Breakpad capture, client library to accommodate a service such as SQL Server.
- The RVA is a 32 bit value limiting the capture to 4GB before integer wrap around is encountered. We changed the file format for the RVA to a 64 bit integer to avoid 4GB wrap around.
- Reading of the target memory is accomplished using the ptrace ABI, PTRACE_PEEKDATA, which occurs in integer size reads. Testing revealed use of pread64 to read /proc/$pid/mem directly can be more performant.
Code name “paldumper”
As mentioned, Breakpad is a client library which requires an application. Codename “paldumper” is the ELF based, client application used to determine the additional memory regions to include in the core-minidump. When an exception is encountered in SQLPAL or the Host Environment paldumper is invoked to capture the core-minidump.
The heart of paldumper is the understanding of the the SQLPAL and HE address space. paldumper builds the targeted list of additional memory regions to add to the capture. For example, Breakpad is not aware of the TEB for the thread. However, paldumper understands and includes the TEB for the targeted threads. Other areas such as ring buffers and even indirect memory are added without requiring a full, core dump.
When paldumper is invoked it sends and waits for the SIGSTOP to occur against the target process. This allows paldumper and Breakpad to act upon the same static state of the process. Depending on the dump type, outlined below, various additional memory regions are accumulated for the dump request. Once the regions are identified the Breakpad client library is invoked to generate the dump.
Dump Types
Note: The dump type can be dynamically controlled using the mssql-conf , dump options (coredumptype, captureminiandfull in the coredump section of the /var/opt/mssql/mssql.conf file).
Dump Type |
Description |
Mini |
Smallest dump type. Mini is the unaltered, Breakpad, dump. It uses the Linux system information to determine threads and modules in the process. The dump contains only the Host Environment thread stacks and modules. This may be useful for native sqlcmd, bcp and other such applications. Note: This does NOT contain indirect memory references and aligns with a pure, Breakpad capture request. |
MiniPlus |
|
Filtered |
Filtered uses a subtraction based design where all memory in the process is included unless specifically excluded. The design understands the internals of SQLPAL and the HE. Commonly excluding the Win32 based allocations from the dump. Stack memory is still included as well as indirect memory references from stack pointers. |
Full |
Full includes all regions located in /proc/$pid/maps. This equates to full process dump (same as gdb generate-core-dump.) Note: The gcore capture does not include additional information such as the maps, command line, release and other information that this capture includes. |
Here are some size example comparisons (8 CPU, 20GB RAM)
Dump Type |
Sample 1 |
Sample 2 |
Full |
12.3GB |
15.5GB |
Filtered |
7.7GB |
11.0GB |
MiniPlus |
2.1GB |
5.2GB |
Mini |
1.8MB |
5MB |
Note: Theoutput location, ulimit and other core dump options are ignored by paldumper.
minidump-2-core
The Breakpad file is not directly readable from lldb, gdb or WinDbg. The Crashpad developers are actively working to make the file load directly in lldb without a conversion step. Microsoft engineers use the minidump-2-core utility to convert the Breakpad captured file into an ELF, core dump format; that is readable by lldb and gdb.
Microsoft Alterations
A few modifications for minidump-2-core were also required.
- Read a 64 bit RVA based file.
- Add logic to include the additional memory in the generated core file. The default, minidump-2-core does not add the memory regions to the core dump. Since we wanted to use the additional memory regions, We added logic to include the additional, PT_LOAD entries for the included memory regions.
- Optimizations for performance.
- Updates to allow more than 64K memory region entries.
The output from minidump-2-core is an ELF core file that can be read by lldb, gdb, dbgbridge, and readelf. You can use readelf to dump the headers and see the information contained in the dump. The text output from minidump-2-core also outputs the various text sections captured from the /proc/$pid/*** information.
Exception Processing Flow
sqlservr (MONITOR) –------------------- sqlservr.exe
<---- unexpected exception
Invoke generate-core.sh
- capture system information
- paldumper capture
- compress all captured filesStorage location: /var/opt/mssql/log (core*)
Microsoft Engineer Processing Flow
Retrieve compressed archive from customer
Use minidump-2-core to convert the capture to core ELF format
Open dump with dbgbridge
Can I Use PalDumper with any executable?
The answer is maybe. For example the sqlcmd and bcp utilities have been released as native, ELF based images. They don’t require SQLPAL or HE so a mini-plus or filtered is not going to be able to add additional memory. However, a mini or full capture is viable for a Microsoft engineer.
When a program unexpectedly terminated on Linux a core dump may be generated. Details about core dump behavior are outlined here: https://man7.org/linux/man-pages/man5/core.5.html. Also refer to ulimit and /proc/sys/kernel/core_pattern for limitations and storage locations.
Community
As I indicated in my previous lldb post, we are sharing our work. Our code changes have been discussed and shared with the Breakpad / Crashpad developers for consideration.
Bob Dorr – Principal Software Engineer SQL Server
Comments
- Anonymous
October 30, 2017
From where I can get minidump-2-core utility for linux?


