Using Relog.exe to Import Perfmon logs into a SQL Database, then use Excel Pivot Charts!
I have recently come across a scenario where a customer needs me to run a Performance Test of an Application but due security policies is not able (or doesn't want) to provide Server-Level access to the Servers where the Application is hosted. Without the access a Visual Studio Load Test will not able to collect performance metrics from the target servers. What I normally do here is to request that the customer gets someone who does have access to run a Perform Data Collection while the Performance test is running and then send me the .BLG file(s) for analysis.
The analysis can be done directly on PERFMON by loading the .blg file, dragging the various counters to the chart and doing actions like comparisons, looking for threshold violations, etc. However, if what you need is to create nice-looking charts, overlay counters, pie charts, etc. for a report, then you probably need something better that PERFMON charts.
In the following steps I will show you how to load the PERFMON .blg files into a SQL Database and then pull data from the SQL Database into an Excel pivot chart. I base this information on a 2012 blog-post by Prashant Kumar here, although I am updating it by using PowerShell to provide better maintainability and Pivot charts on Excel 2016:
- Prerequisite: Create a PERFMON log file (.blg) by running a trace in a server, to do this you need to create a Perfmon Data Collection Set, there are a few templates by default or you can create or lookup a specific template. Once created you need to run the Data Collection for an given amount of time (e.g. 30min while a Load Test is running). Here is some additional information from TechNet.
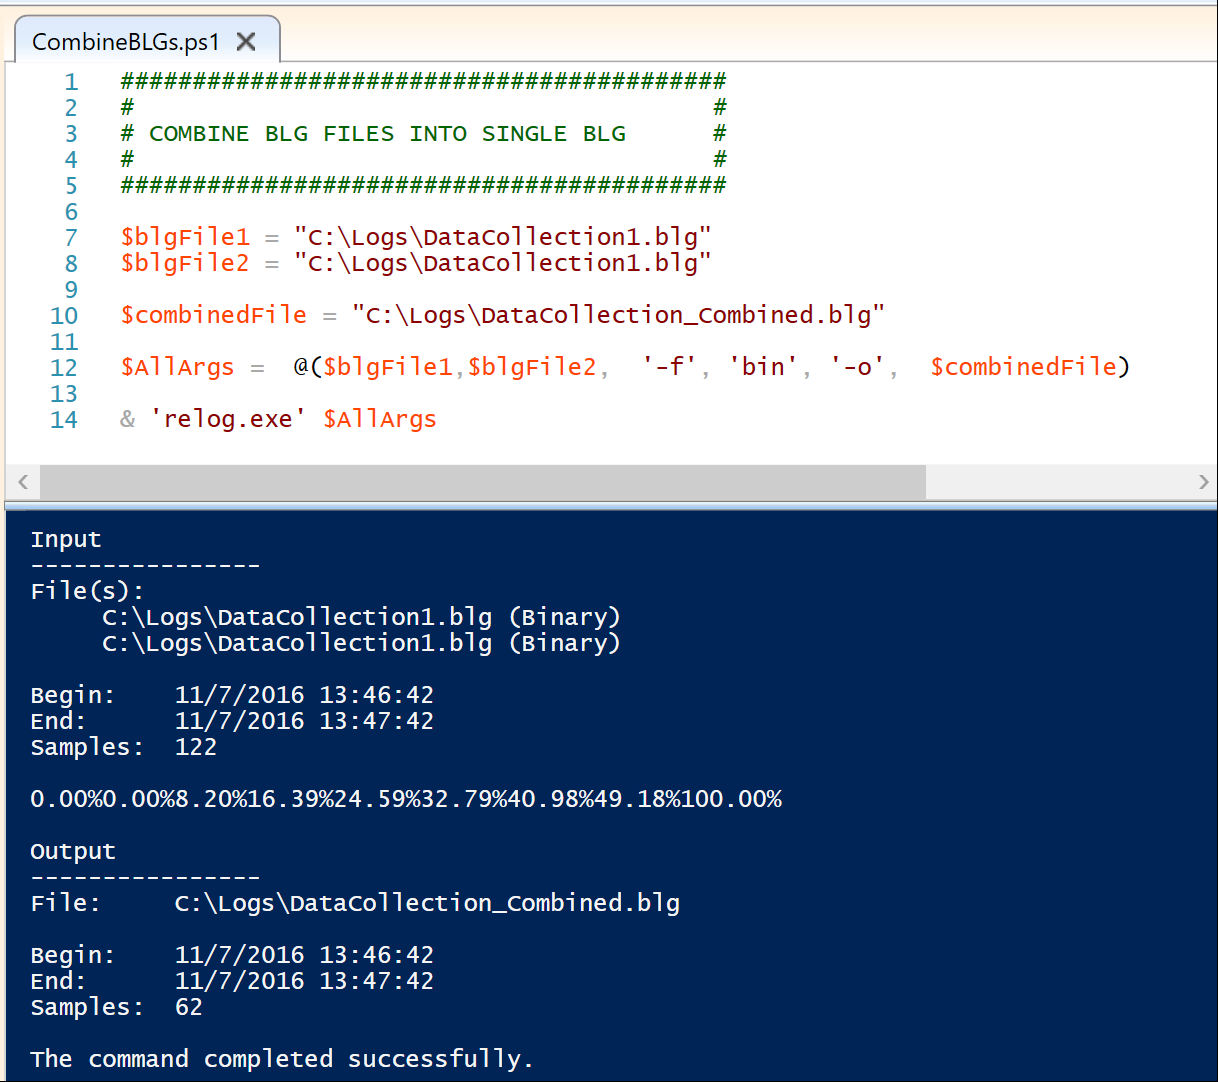
- Optionally: Once you have one or several .blg files, you can join them together into a single .blg file for easier handling, or you can chose to keep them separate. For this you can use relog.exe, it's important to point out that you can use relog.exe from the Command Prompt console, or you can use a PowerShell script as follows for easier editing of the attributes and local paths:
- Step 1: You will need to create a new database in SQL (e.g. PerfmonDB). For this example I'm using SQL Server 2016, I have also successfully loaded Perfmon data to a SQL 2012 database.
- Note: SQL Express editions do not work since it you would need to create the ODBC connection thru the SQL Native client (to localDB) and that will create problems with relog.exe since it won't recognize the DSN source.
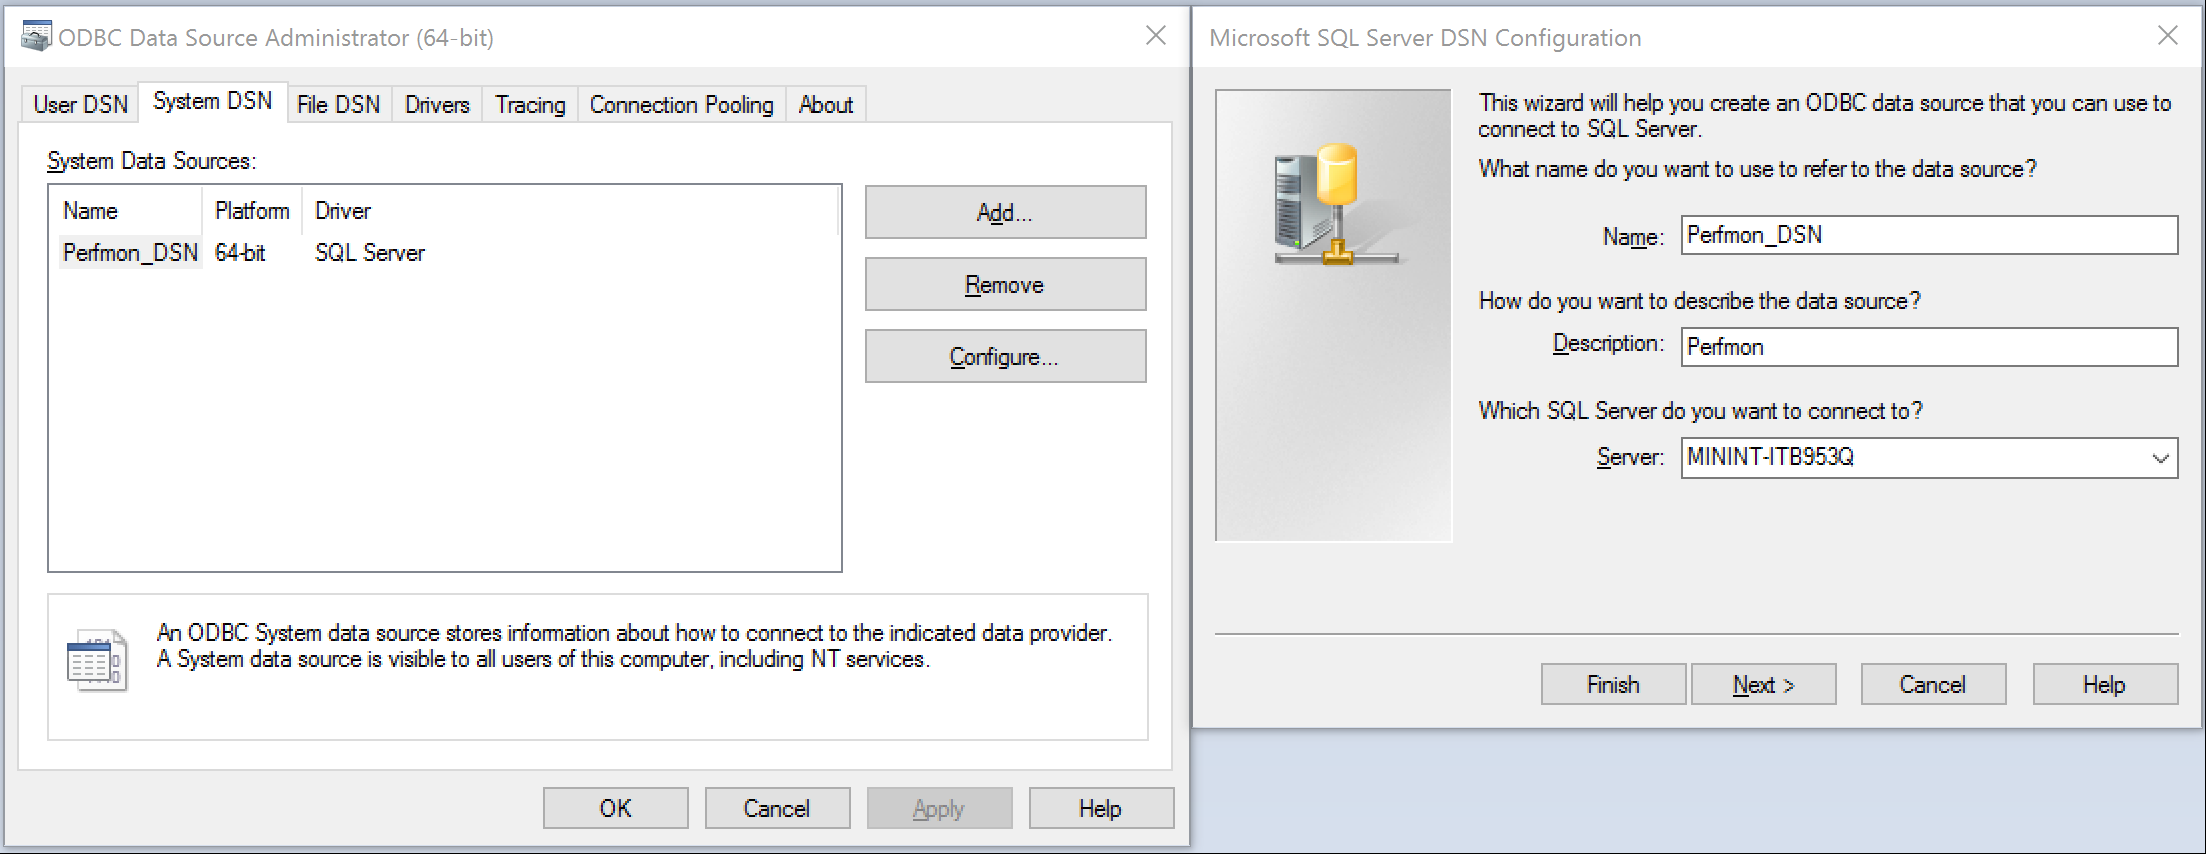
- Step 2: Create a SQL Server ODBC- System DSN source named Perfmon_DSN that points to your SQL Server and Database
- To create the ODBC-System DNS connection:
- Run odbcad32.exe, go to the System DSN tab and click on 'Add' to add a new Source
- Select SQL Server (not native client) and type the connection configuration details (e.g. Name: Perfmon_DSN, Description: Perfmon, Server: <yourSQLServer>)
- Preferably chose NT Authentication and change the default database to PerfmonDB, keep all other defaults.
- To create the ODBC-System DNS connection:
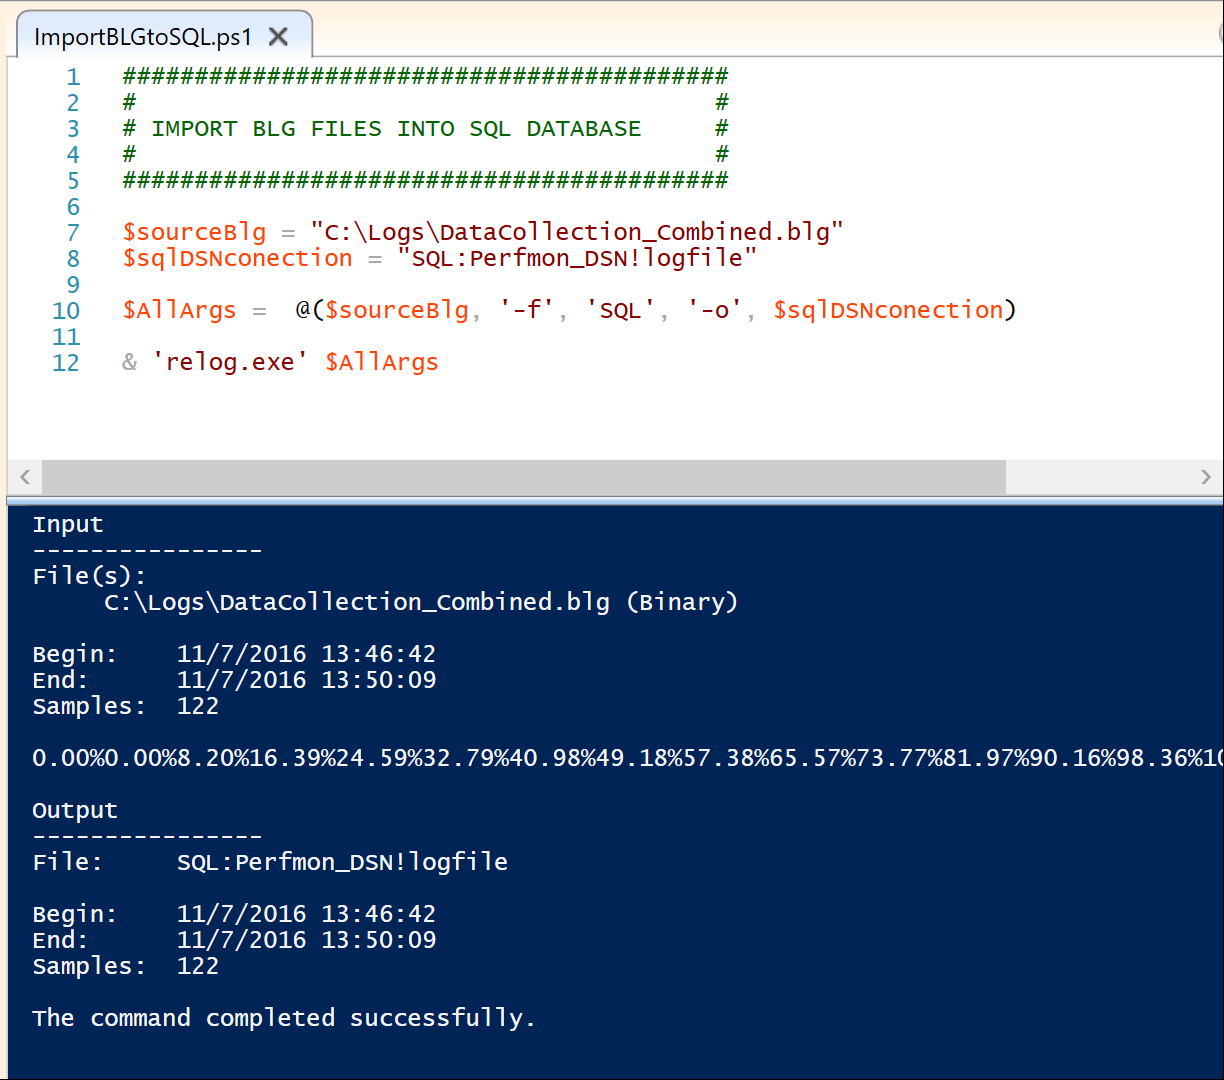
- Step 3: Use relog.exe to load the combined, or single .blg file into the SQL database thru your DNS connection.
- To do this you can run relog.exe from PowerShell as shown on the code below.
-
- You can validate that the script worked by checking your PerfmonDB database. Tables CounterData, CounterDetails and DisplayToId should have been created.
Step 4. Now that the data has been loaded into the SQL Database, we can start working in pulling it into Excel reporting purposes. Let's do the Connection/Query first:
- You will need Excel (I'm using 2016 for this example).
- First you need to create a connection. In a new Spreadsheet, go to Data > Get External Data > From Other Sources > From SQL Server.
- Type your SQLServer name and log on credentials.
- Select your database PerfmonDB, there is no need to specify a default table just click next and then finish.
- Cancel the select table dialog.
- Now that you have a connection, you need a proper SQL query that pulls only the information that you need.
- In excel, go to Data > Connections, select your connection and click Properties.
- Go to the Definition tab and in Command Type, select SQL
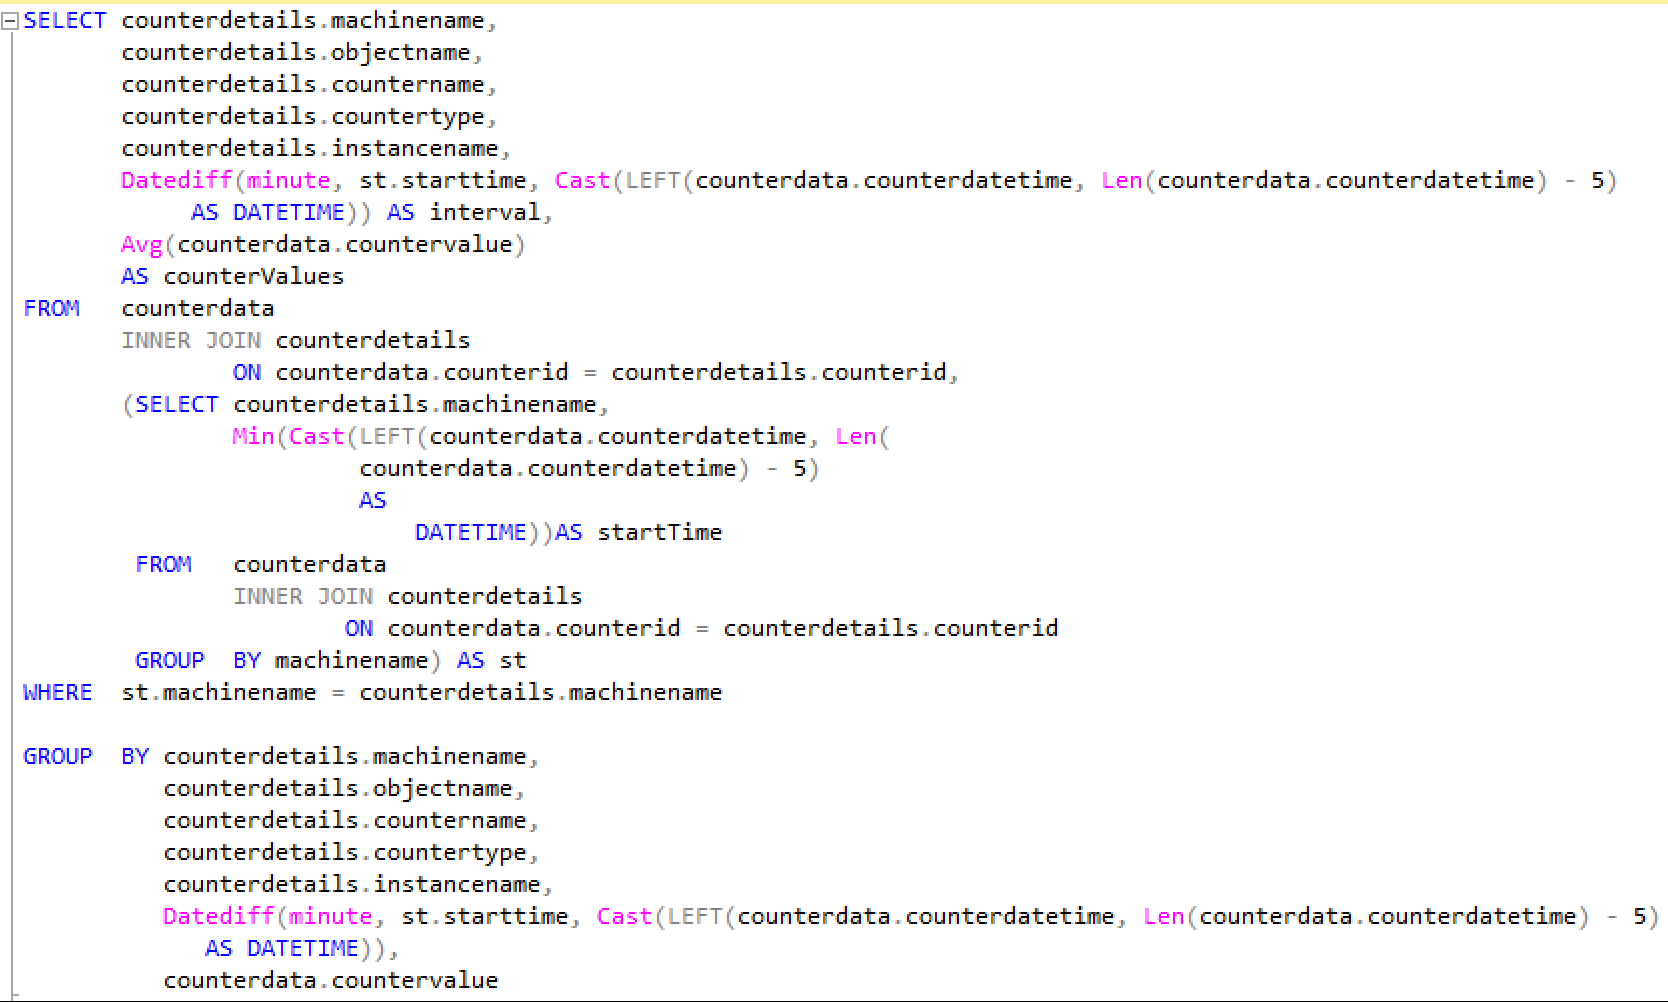
- Under Command Text copy the SQL query below and click the OK button. On the query, the interval is set at every 1 minute, you can tweak that according to your needs (e.g. every 1hr), also this query will pull all objects imported from the Perfmon logs, if it is too much information you can always filter out in the WHERE clause by adding (for example): AND objectname = 'Processor'.
- Step 5 - Let's use the query results to build a Pivot Table and Charts
- First go to Insert > Charts > PivotChart > PivotChart & PivotTable
- In the Create Pivot Table dialog, select "Use External Data Source" and "New Worksheet". Click ok.
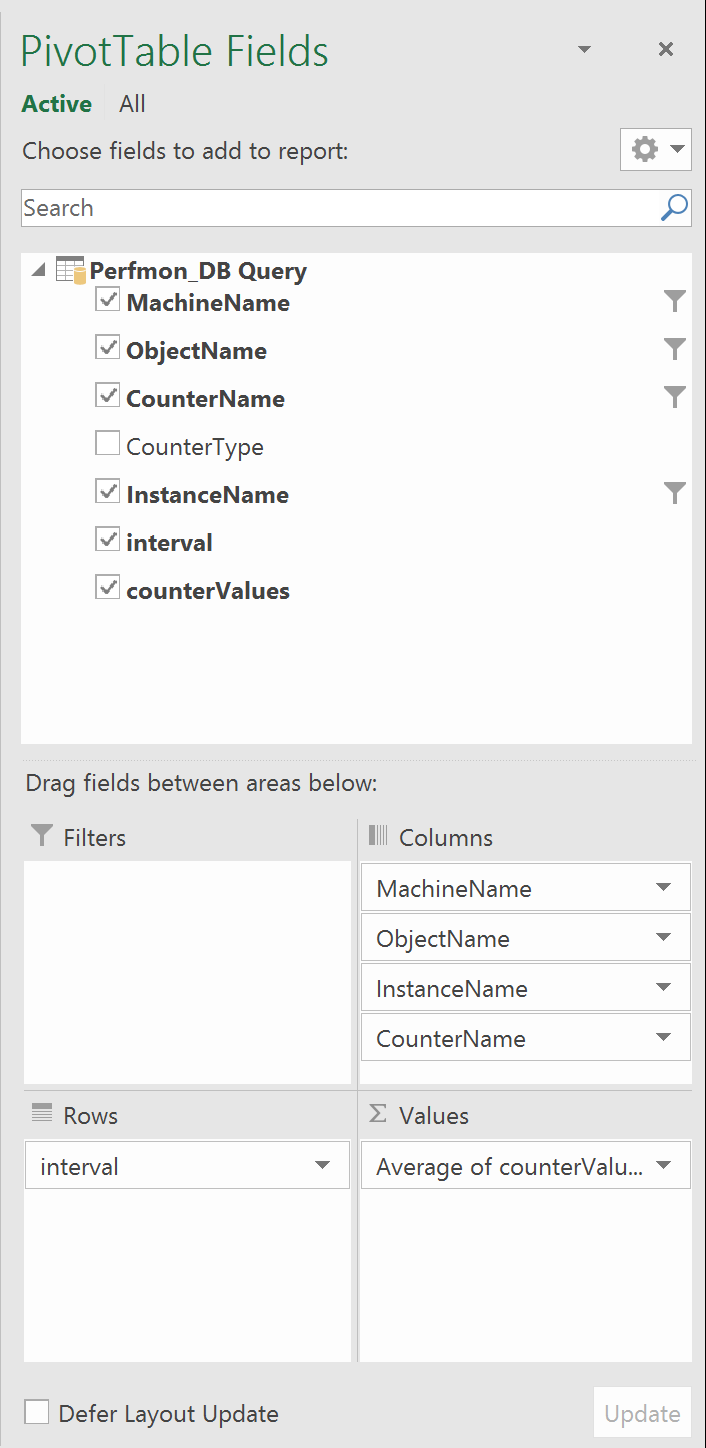
- That should show you an empty Table, empty Chart and the PivotTable Fields Selector. In the Selector, use the configuration shown below. Basically you need the internal field in the Rows area, the counterValues in the Values area and all other fileds in the Columns area.
- Note: For the counterValues field you need to summarize the value field by average. To do this right-click in the counterValues field and go to Properties, then from the list select Average.
- Note: For the counterValues field you need to summarize the value field by average. To do this right-click in the counterValues field and go to Properties, then from the list select Average.
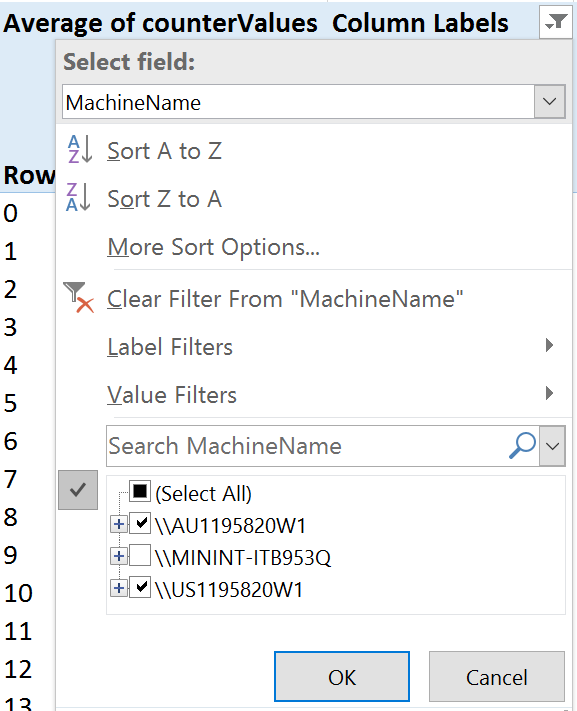
- Now you should have all the information you need for the Charts, however it may have too many objects, counters, or Machines for the chart to make sense. In the table use the Column Labels filters to chose only the objects that you need. Please note that you can change the field on top of the picture below in the Select field dropdown:
- A much more rewarding way to do this is by adding Slicers. To do this, in excel go to PivotTable Tools > Analyze > Filter > Insert Slicer, then select the counter(s) that you need for easier filtering. It should look something like this:
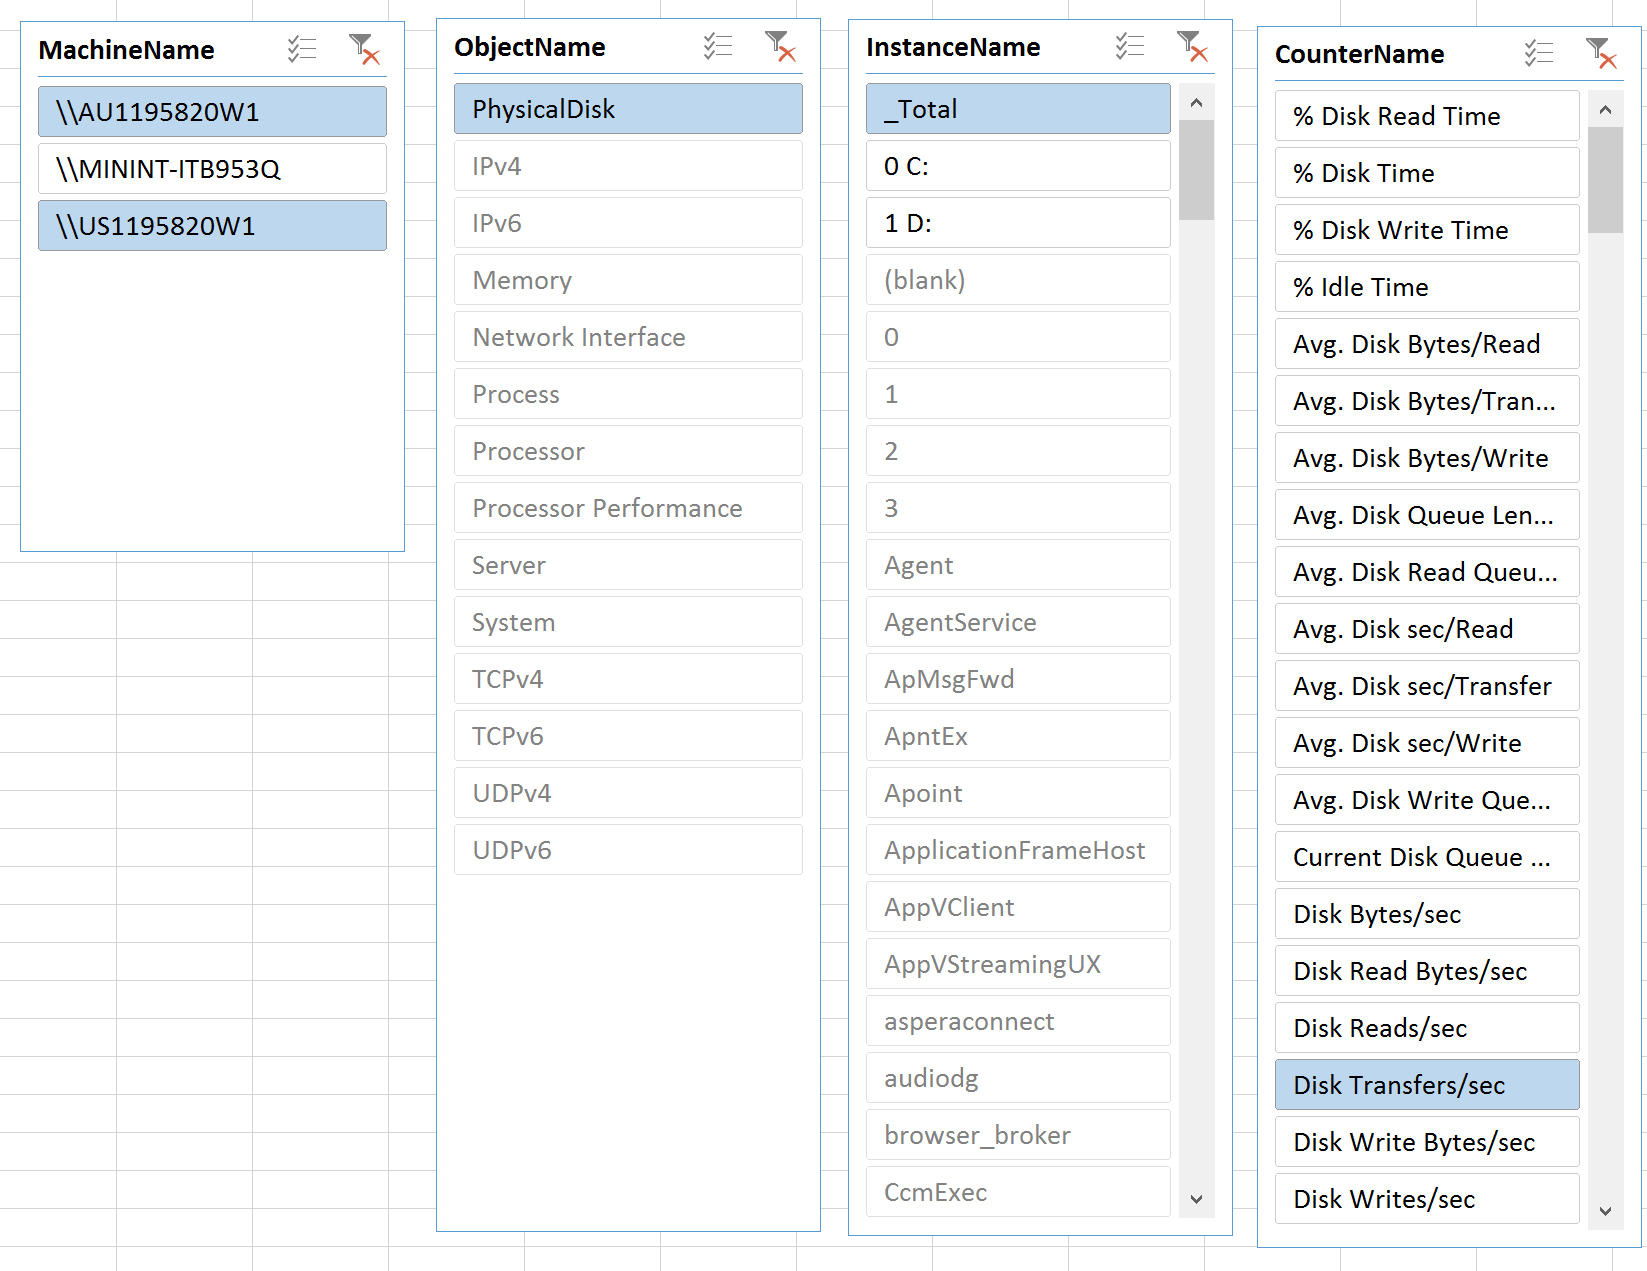
- Now you can play around with selecting one or more combinations of Machine/Object/Instance and Counter. You can do multi-select with the button on top of each selector.
- Keep in mind that not all Counters have an Instance.
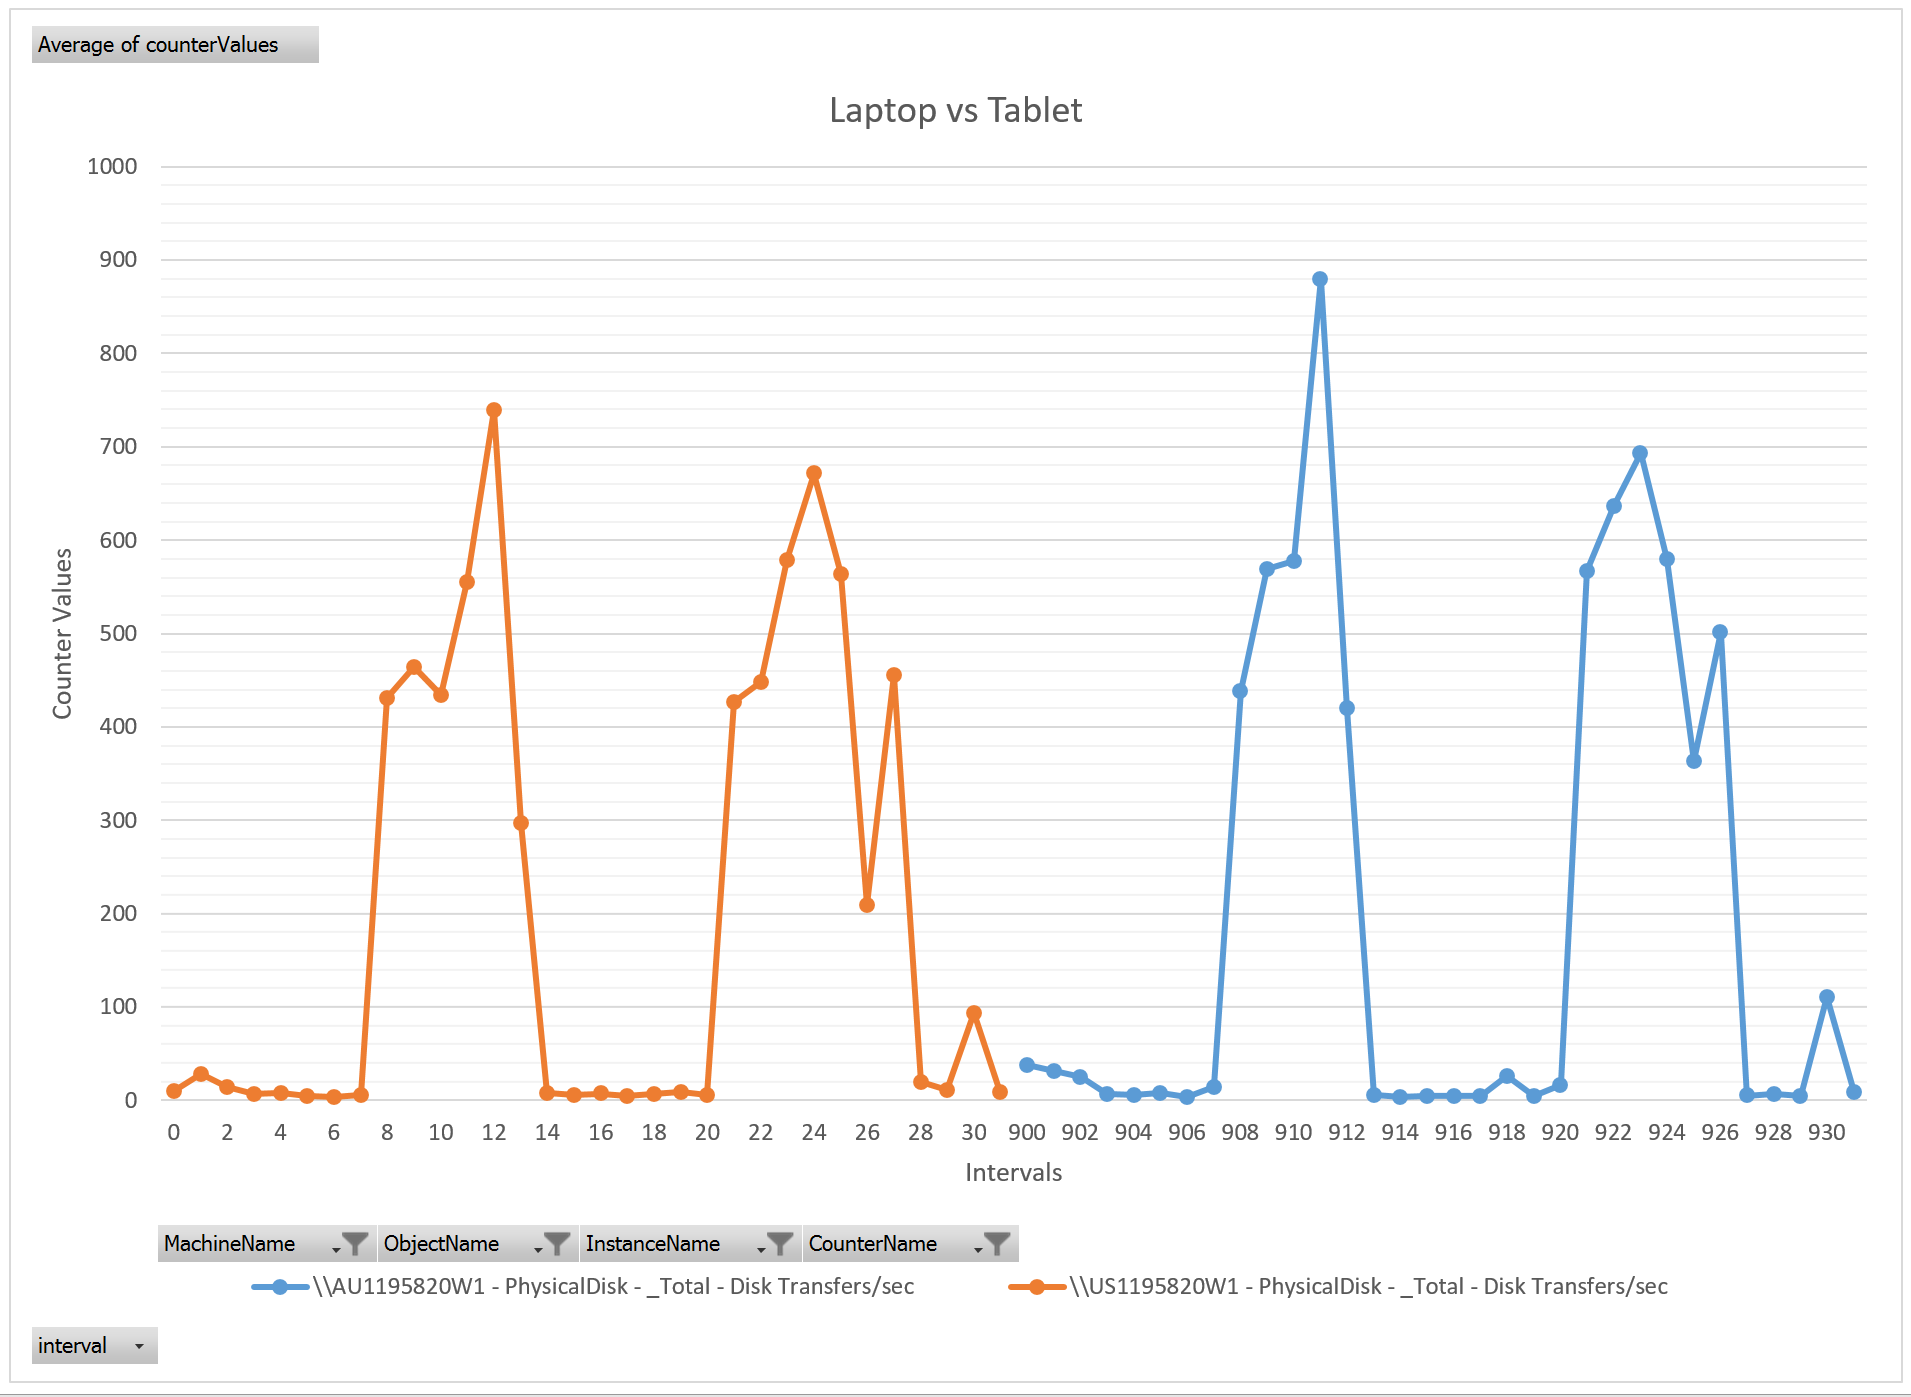
- Using the selectors and some formatting on the Chart, you should be able to easily come up with a Chart similar to the one below: