Using Xperf to take a Trace (updated)
Lets get to it! Here is how to take a basic trace then look at CPU and disk utilization. Its really simple, just three commands to turn on tracing, turn it off, and then view the trace.
The next article in this series is Xperf support for XP
First, from an elevated command prompt window, enable a basic set of the kernel events using this command:
xperf -on PROC_THREAD+LOADER+DISK_IO+HARD_FAULTS+INTERRUPT+DPC+CSWITCH -maxbuffers 1024
This command enables a set of events in the kernel and sets the maximum number of buffers to 1024. The default size for each buffer is 64K. So for this session, ETW will use up to 64MB of memory for ETW buffers. As buffers are filled with events, they are written to the log file in the background and then made available again for accepting events. By default, xperf sets the minimum number of buffers to 64. ETW will start with this many buffers and only allocate more buffers if needed. Events will only be lost if ETW cannot allocate more buffers and/or keep up with the event rate by writing data to the disk. By default, the kernel events are written to \kernel.etl on the current drive.
Next, do something interesting - it can be anything from opening Internet explorer and a web page, or compiling a program with Visual studio, to something more complex like opening three or four Microsoft Office applications and doing some work.
Run the following command when your interesting thing is done:
xperf -d foo.etl
This simple command will take 10 to 30 seconds (or possibly longer) because it merging the raw kernel event data with meta data and doing some other post processing. We call this 'stop and merge'. Here is what this command does
Performs a 'run down', during which the kernel logs a set of events that describe the state of the system.
Turns off the kernel logger
Interlaces data from multiple trace files and the kernel trace.
Adds some meta info to the trace needed for processing the trace on other systems. This data is saved in the trace as a set of synthetic events.
Saves the trace data into the file foo.etl (or the file name of your choice).
Finally, load the trace in the Performance Analyzer with the following command
xperf foo.etl
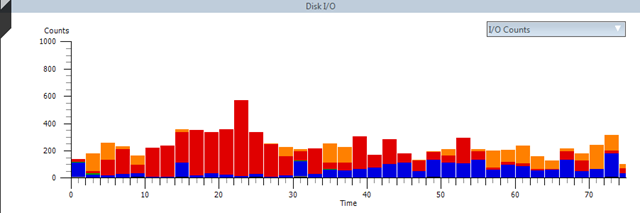
For this example, I took a trace of using Visual Studio 2008 to compile a program. Here are screen shots of the CPU Usage by CPU and for disk I/O counts.
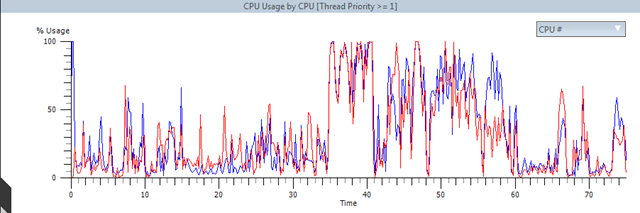
 Those are pretty interesting, but lots of things are running in the system, and I'd like to see just the CPU usage for Visual Studio itself.
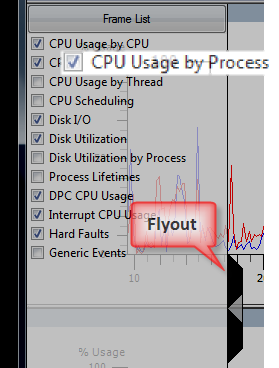
The CPU usage by process graph makes this easy, just click on the fly out control on the left of the window and select the CPU Usage by Process graph.
The fly out frame lists the graphs available for the events in the trace. If there trace doesn't contain events that are needed for a particular graph, then the graph is not shown.
Performance Analyzer will automatically save the graphs you have selected. You can change them at any time.
For my trace, the CPU usage for the DEVENV.EXE process and two CL.EXE processes looked like this.
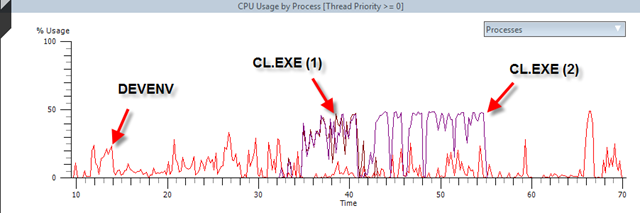
DEVENV is the Visual Studio 2008 environment itself. The CL.EXE processes are the two compiler sessions it started, one for each CPU on my laptop.
This is a simple example that illustrates some key points
- The kernel events can be enabled and disabled at any time. There is no need to re-boot the system, log-out/log-in, or restart processes to use the kernel events, or any ETW event provider. ETW events from any source can be dynamically controlled at run time.
- The xperf tools are designed for a post processing model, one where a trace is captured, then later analyzed. This is in contrast to an observational model where you watch dynamic charts, graphics, or tabular data as something occurs. The reason for this model is that ETW and the tools are designed for log time efficiency.
- This model is also specifically designed for taking traces on one machine, then analyzing them on another machine. This ability is critical for running performance tests in a lab setting.
- The tools let you look at both system wide activity and process specific activity.
del.icio.us Tags: tools,xperf,performance,windows
Comments
Anonymous
February 16, 2008
It is possible for Xperf to be available separately as a stand-alone download because having to download a whole SDK to get is not optimal. You have many useful developer tools, why don't you consolidate them in a signle downloadable package, like the GNU Bin Utils do.Anonymous
February 16, 2008
That's a really powerful tool! Can you give an example of how you might trace & review a slow startup or a stalled shutdown?Anonymous
February 16, 2008
The comment has been removedAnonymous
February 16, 2008
The comment has been removedAnonymous
February 21, 2008
Standalone Xperf downloads on the right hand side- http://www.microsoft.com/whdc/system/sysperf/perftools.mspxAnonymous
March 02, 2008
The WHDC folks now have web page setup for the Windows Performance Toolkit (aka the 'xperf tools'). Anonymous
March 12, 2008
If you like delving into the depths of how a Windows system is performing (or not performing) then aAnonymous
March 16, 2008
Here is a chronological list of the my posts about the xperf tools. If you are new to the tools, or simplyAnonymous
April 03, 2008
I recently came across a very interesting profiling tool that is available in Vista SP1 and Server 08