Catatan
Akses ke halaman ini memerlukan otorisasi. Anda dapat mencoba masuk atau mengubah direktori.
Akses ke halaman ini memerlukan otorisasi. Anda dapat mencoba mengubah direktori.
Berlaku untuk: ✅Microsoft Fabric✅Azure Data Explorer
Fungsi series_fit_lowess_fl() ini adalah fungsi yang ditentukan pengguna (UDF) yang menerapkan regresi LOWESS pada seri. Fungsi ini mengambil tabel dengan beberapa seri (larik numerik dinamis) dan menghasilkan Kurva LOWESS, yang merupakan versi yang dihaluskan dari seri aslinya.
Prasyarat
- Plugin Python harus diaktifkan pada kluster. Ini diperlukan untuk Python sebaris yang digunakan dalam fungsi.
- Plugin Python harus diaktifkan pada database. Ini diperlukan untuk Python sebaris yang digunakan dalam fungsi.
Sintaks
T | invoke series_fit_lowess_fl(, y_series y_fit_series, [ fit_size ], [ x_series ], [ x_istime ])
Pelajari selengkapnya tentang konvensi sintaksis.
Parameter
| Nama | Tipe | Wajib | Deskripsi |
|---|---|---|---|
| y_series | string |
✔️ | Nama kolom tabel input yang berisi variabel dependen. Kolom ini adalah seri yang sesuai. |
| y_fit_series | string |
✔️ | Nama kolom untuk menyimpan seri yang pas. |
| fit_size | int |
Untuk setiap titik, regresi lokal diterapkan pada titik terdekat masing-masing fit_size . Bawaan adalah 5. | |
| x_series | string |
Nama kolom yang berisi variabel independen, yaitu sumbu x atau waktu. Parameter ini bersifat opsional, dan hanya diperlukan untuk seri yang tidak merata. Nilai default adalah string kosong, karena x redundan untuk regresi seri yang merata. | |
| x_istime | bool |
Parameter boolean ini diperlukan hanya jika x_series ditentukan dan merupakan vektor tanggalwaktu. Default adalah false. |
Definisi fungsi
Anda dapat menentukan fungsi dengan menyematkan kodenya sebagai fungsi yang ditentukan kueri, atau membuatnya sebagai fungsi tersimpan dalam database Anda, sebagai berikut:
Tentukan fungsi menggunakan pernyataan let berikut. Tidak ada izin yang diperlukan.
Penting
Pernyataan let tidak dapat berjalan sendiri. Ini harus diikuti oleh pernyataan ekspresi tabular. Untuk menjalankan contoh series_fit_lowess_fl()kerja , lihat Contoh.
let series_fit_lowess_fl=(tbl:(*), y_series:string, y_fit_series:string, fit_size:int=5, x_series:string='', x_istime:bool=False)
{
    let kwargs = bag_pack('y_series', y_series, 'y_fit_series', y_fit_series, 'fit_size', fit_size, 'x_series', x_series, 'x_istime', x_istime);
    let code = ```if 1:
        y_series = kargs["y_series"]
        y_fit_series = kargs["y_fit_series"]
        fit_size = kargs["fit_size"]
        x_series = kargs["x_series"]
        x_istime = kargs["x_istime"]
        import statsmodels.api as sm
        def lowess_fit(ts_row, x_col, y_col, fsize):
            y = ts_row[y_col]
            fraction = fsize/len(y)
            if x_col == "": # If there is no x column creates sequential range [1, len(y)]
               x = np.arange(len(y)) + 1
            else: # if x column exists check whether its a time column. If so, normalize it to the [1, len(y)] range, else take it as is.
               if x_istime:
                   x = pd.to_numeric(pd.to_datetime(ts_row[x_col]))
                   x = x - x.min()
                   x = x / x.max()
                   x = x * (len(x) - 1) + 1
               else:
                   x = ts_row[x_col]
            lowess = sm.nonparametric.lowess
            z = lowess(y, x, return_sorted=False, frac=fraction)
            return list(z)
        result = df
        result[y_fit_series] = df.apply(lowess_fit, axis=1, args=(x_series, y_series, fit_size))
    ```;
    tbl
     | evaluate python(typeof(*), code, kwargs)
};
// Write your query to use the function here.
Contoh
Contoh berikut menggunakan operator pemanggilan untuk menjalankan fungsi.
Regresi LOWESS pada rangkaian waktu reguler
Untuk menggunakan fungsi yang ditentukan kueri, panggil setelah definisi fungsi yang disematkan.
let series_fit_lowess_fl=(tbl:(*), y_series:string, y_fit_series:string, fit_size:int=5, x_series:string='', x_istime:bool=False)
{
let kwargs = bag_pack('y_series', y_series, 'y_fit_series', y_fit_series, 'fit_size', fit_size, 'x_series', x_series, 'x_istime', x_istime);
let code = ```if 1:
y_series = kargs["y_series"]
y_fit_series = kargs["y_fit_series"]
fit_size = kargs["fit_size"]
x_series = kargs["x_series"]
x_istime = kargs["x_istime"]
import statsmodels.api as sm
def lowess_fit(ts_row, x_col, y_col, fsize):
y = ts_row[y_col]
fraction = fsize/len(y)
if x_col == "": # If there is no x column creates sequential range [1, len(y)]
x = np.arange(len(y)) + 1
else: # if x column exists check whether its a time column. If so, normalize it to the [1, len(y)] range, else take it as is.
if x_istime:
x = pd.to_numeric(pd.to_datetime(ts_row[x_col]))
x = x - x.min()
x = x / x.max()
x = x * (len(x) - 1) + 1
else:
x = ts_row[x_col]
lowess = sm.nonparametric.lowess
z = lowess(y, x, return_sorted=False, frac=fraction)
return list(z)
result = df
result[y_fit_series] = df.apply(lowess_fit, axis=1, args=(x_series, y_series, fit_size))
```;
tbl
| evaluate python(typeof(*), code, kwargs)
};
//
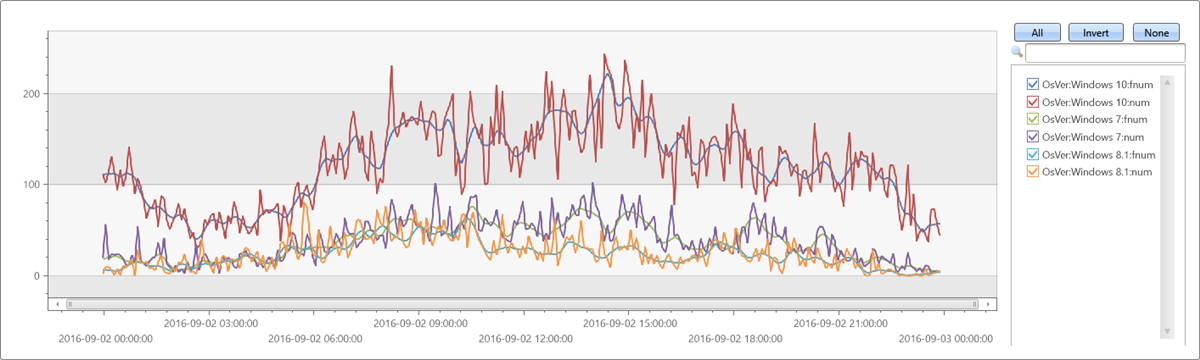
// Apply 9 points LOWESS regression on regular time series
//
let max_t = datetime(2016-09-03);
demo_make_series1
| make-series num=count() on TimeStamp from max_t-1d to max_t step 5m by OsVer
| extend fnum = dynamic(null)
| invoke series_fit_lowess_fl('num', 'fnum', 9)
| render timechart
Hasil
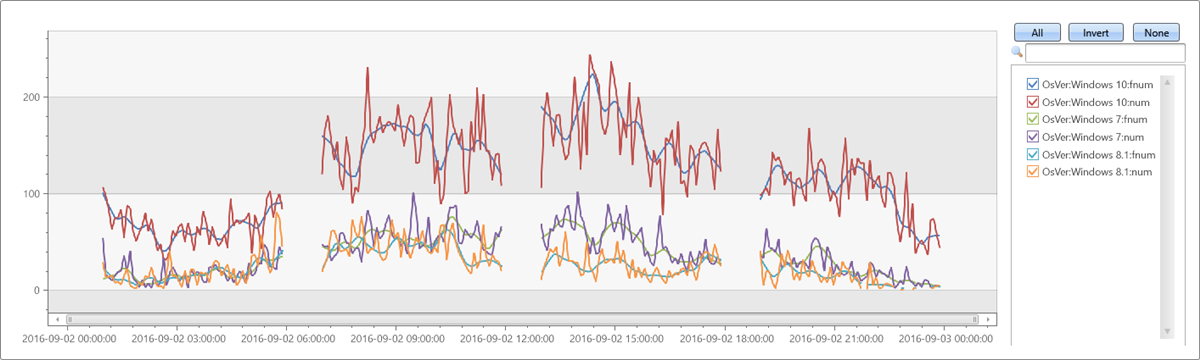
Menguji seri waktu yang tidak teratur
Untuk menggunakan fungsi yang ditentukan kueri, panggil setelah definisi fungsi yang disematkan.
let series_fit_lowess_fl=(tbl:(*), y_series:string, y_fit_series:string, fit_size:int=5, x_series:string='', x_istime:bool=False)
{
    let kwargs = bag_pack('y_series', y_series, 'y_fit_series', y_fit_series, 'fit_size', fit_size, 'x_series', x_series, 'x_istime', x_istime);
    let code = ```if 1:
        y_series = kargs["y_series"]
        y_fit_series = kargs["y_fit_series"]
        fit_size = kargs["fit_size"]
        x_series = kargs["x_series"]
        x_istime = kargs["x_istime"]
        import statsmodels.api as sm
        def lowess_fit(ts_row, x_col, y_col, fsize):
            y = ts_row[y_col]
            fraction = fsize/len(y)
            if x_col == "": # If there is no x column creates sequential range [1, len(y)]
               x = np.arange(len(y)) + 1
            else: # if x column exists check whether its a time column. If so, normalize it to the [1, len(y)] range, else take it as is.
               if x_istime:
                   x = pd.to_numeric(pd.to_datetime(ts_row[x_col]))
                   x = x - x.min()
                   x = x / x.max()
                   x = x * (len(x) - 1) + 1
               else:
                   x = ts_row[x_col]
            lowess = sm.nonparametric.lowess
            z = lowess(y, x, return_sorted=False, frac=fraction)
            return list(z)
        result = df
        result[y_fit_series] = df.apply(lowess_fit, axis=1, args=(x_series, y_series, fit_size))
    ```;
    tbl
     | evaluate python(typeof(*), code, kwargs)
};
let max_t = datetime(2016-09-03);
demo_make_series1
| where TimeStamp between ((max_t-1d)..max_t)
| summarize num=count() by bin(TimeStamp, 5m), OsVer
| order by TimeStamp asc
| where hourofday(TimeStamp) % 6 != 0   //  delete every 6th hour to create irregular time series
| summarize TimeStamp=make_list(TimeStamp), num=make_list(num) by OsVer
| extend fnum = dynamic(null)
| invoke series_fit_lowess_fl('num', 'fnum', 9, 'TimeStamp', True)
| render timechart
Hasil
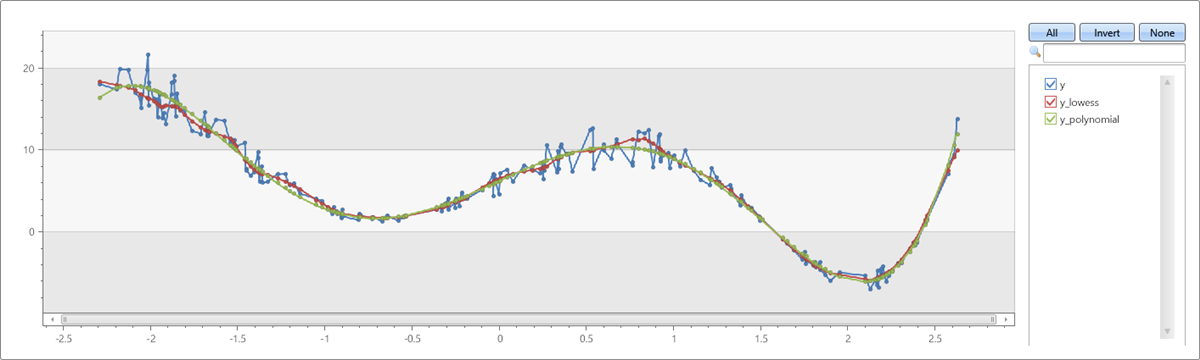
Membandingkan LOWESS versus kecocokan polinomial
Untuk menggunakan fungsi yang ditentukan kueri, panggil setelah definisi fungsi yang disematkan.
let series_fit_lowess_fl=(tbl:(*), y_series:string, y_fit_series:string, fit_size:int=5, x_series:string='', x_istime:bool=False)
{
    let kwargs = bag_pack('y_series', y_series, 'y_fit_series', y_fit_series, 'fit_size', fit_size, 'x_series', x_series, 'x_istime', x_istime);
    let code = ```if 1:
        y_series = kargs["y_series"]
        y_fit_series = kargs["y_fit_series"]
        fit_size = kargs["fit_size"]
        x_series = kargs["x_series"]
        x_istime = kargs["x_istime"]
        import statsmodels.api as sm
        def lowess_fit(ts_row, x_col, y_col, fsize):
            y = ts_row[y_col]
            fraction = fsize/len(y)
            if x_col == "": # If there is no x column creates sequential range [1, len(y)]
               x = np.arange(len(y)) + 1
            else: # if x column exists check whether its a time column. If so, normalize it to the [1, len(y)] range, else take it as is.
               if x_istime:
                   x = pd.to_numeric(pd.to_datetime(ts_row[x_col]))
                   x = x - x.min()
                   x = x / x.max()
                   x = x * (len(x) - 1) + 1
               else:
                   x = ts_row[x_col]
            lowess = sm.nonparametric.lowess
            z = lowess(y, x, return_sorted=False, frac=fraction)
            return list(z)
        result = df
        result[y_fit_series] = df.apply(lowess_fit, axis=1, args=(x_series, y_series, fit_size))
    ```;
    tbl
     | evaluate python(typeof(*), code, kwargs)
};
range x from 1 to 200 step 1
| project x = rand()*5 - 2.3
| extend y = pow(x, 5)-8*pow(x, 3)+10*x+6
| extend y = y + (rand() - 0.5)*0.5*y
| summarize x=make_list(x), y=make_list(y)
| extend y_lowess = dynamic(null)
| invoke series_fit_lowess_fl('y', 'y_lowess', 15, 'x')
| extend series_fit_poly(y, x, 5)
| project x, y, y_lowess, y_polynomial=series_fit_poly_y_poly_fit
| render linechart
Hasil