Nóta
Aðgangur að þessari síðu krefst heimildar. Þú getur prófað aðskrá þig inn eða breyta skráasöfnum.
Aðgangur að þessari síðu krefst heimildar. Þú getur prófað að breyta skráasöfnum.
You’ve set up connectors and other means of collecting activity data across your digital estate. Now you need to dig through all that data to detect patterns of activity and discover activities that don’t fit those patterns and that could represent a security threat.
Microsoft Sentinel and its many solutions provided in the Content hub offer templates for the most commonly used types of analytics rules, and you’re strongly encouraged to make use of those templates, customizing them to fit your specific scenarios. But it’s possible you might need something completely different, so in that case you can create a rule from scratch, using the analytics rule wizard.
Note
If you're reviewing the details of a SOC optimization recommendation in the SOC optimization page and followed the Learn more link to this page, you might be looking for the list of suggested analytics rules. In this case, scroll to the bottom of the optimization details tab and select Go to Content hub to find and install the recommended rules specific to that recommendation. For more information, see SOC optimization usage flow.
This article describes the process of creating an analytics rule from scratch, including using the Analytics rule wizard. It's accompanied by screenshots and directions to access the wizard in both the Azure portal and the Defender portal.
Important
Microsoft Sentinel is generally available in the Microsoft Defender portal, including for customers without Microsoft Defender XDR or an E5 license.
Starting in July 2026, all customers using Microsoft Sentinel in the Azure portal will be redirected to the Defender portal and will use Microsoft Sentinel in the Defender portal only. Starting in July 2025, many new customers are automatically onboarded and redirected to the Defender portal.
If you're still using Microsoft Sentinel in the Azure portal, we recommend that you start planning your transition to the Defender portal to ensure a smooth transition and take full advantage of the unified security operations experience offered by Microsoft Defender. For more information, see It’s Time to Move: Retiring Microsoft Sentinel’s Azure portal for greater security.
Prerequisites
You must have the Microsoft Sentinel Contributor role, or any other role or set of permissions that includes write permissions on your Log Analytics workspace and its resource group.
You should have at least a basic familiarity with data science and analysis and the Kusto Query Language.
You should familiarize yourself with the analytics rule wizard and all the configuration options that are available. For more information, see Scheduled analytics rules in Microsoft Sentinel.
Design and build your query
Before you do anything else, you should design and build a query in Kusto Query Language (KQL) that your rule will use to query one or more tables in your Log Analytics workspace.
Determine a data source, or a set of data sources, that you want to search to detect unusual or suspicious activity. Find the name of the Log Analytics table into which data from those sources is ingested. You can find the table name on the page of the data connector for that source. Use this table name (or a function based on it) as the basis for your query.
Decide what kind of analysis you want this query to perform on the table. This decision will determine which commands and functions you should use in the query.
Decide which data elements (fields, columns) you want from the query results. This decision will determine how you structure the output of the query.
Build and test your queries in the Logs screen. When you’re satisfied, save the query for use in your rule.
For more information, see:
- Best practices for analytics rule queries.
- Kusto Query Language in Microsoft Sentinel
- Best practices for Kusto Query Language queries
Create your analytics rule
This section describes how to create a rule using the Azure or Defender portals.
Get started creating a scheduled query rule
To get started, go to the Analytics page in Microsoft Sentinel to create a scheduled analytics rule.
For Microsoft Sentinel in the Defender portal, select Microsoft Sentinel > Configuration > Analytics. For Microsoft Sentinel in the Azure portal, under Configuration, select Analytics.
Select +Create and select Scheduled query rule.


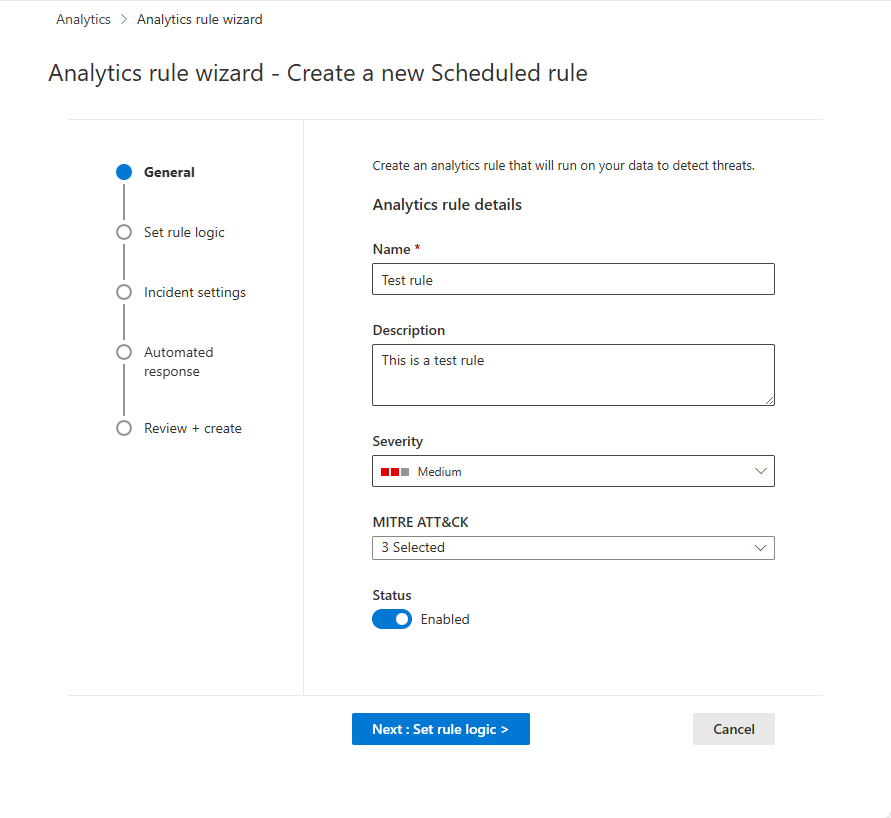
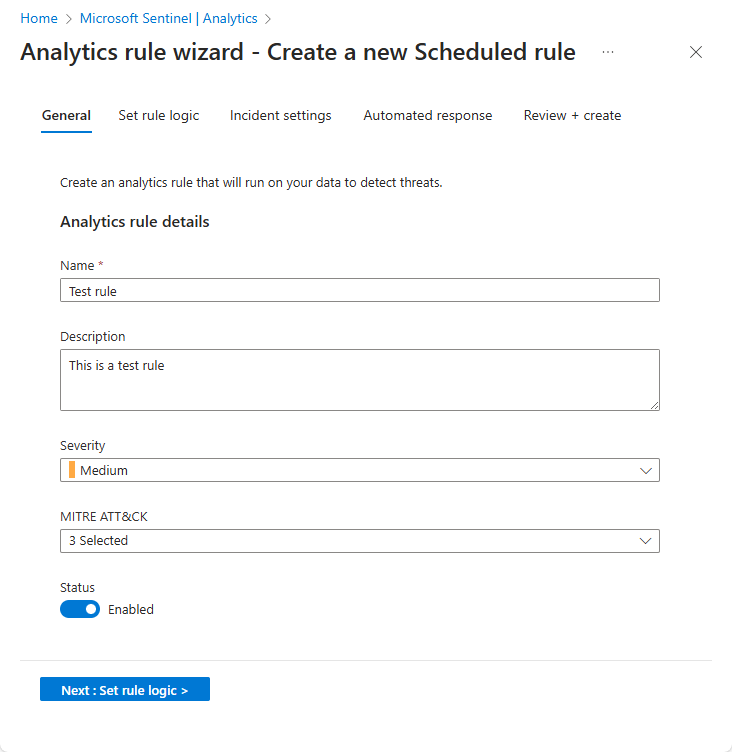
Name the rule and define general information
In the Azure portal, stages are represented visually as tabs. In the Defender portal, they're represented visually as milestones on a timeline.
Enter the following information for your rule.
Field Description Name A unique name for your rule. This field supports plain text only. Any URLs included in the name should follow the percent-encoding format for them to display properly. Description A free-text description for your rule.
If Microsoft Sentinel is onboarded to the Defender portal, this field supports plain text only. Any URLs included in the description should follow the percent-encoding format for them to display properly.Severity Match the impact the activity triggering the rule might have on the target environment, should the rule be a true positive.
Informational: No impact on your system, but the information might be indicative of future steps planned by a threat actor.
Low: The immediate impact would be minimal. A threat actor would likely need to conduct multiple steps before achieving an impact on an environment.
Medium: The threat actor could have some impact on the environment with this activity, but it would be limited in scope or require additional activity.
High: The activity identified provides the threat actor with wide ranging access to conduct actions on the environment or is triggered by impact on the environment.MITRE ATT&CK Choose those threat activities which apply to your rule. Select from among the MITRE ATT&CK tactics and techniques presented in the drop-down list. You can make multiple selections.
For more information on maximizing your coverage of the MITRE ATT&CK threat landscape, see Understand security coverage by the MITRE ATT&CK® framework.Status Enabled: The rule runs immediately upon creation, or at the specific date and time you choose to schedule it (currently in PREVIEW).
Disabled: The rule is created but doesn't run. Enable it later from your Active rules tab when you need it.Select Next: Set rule logic.
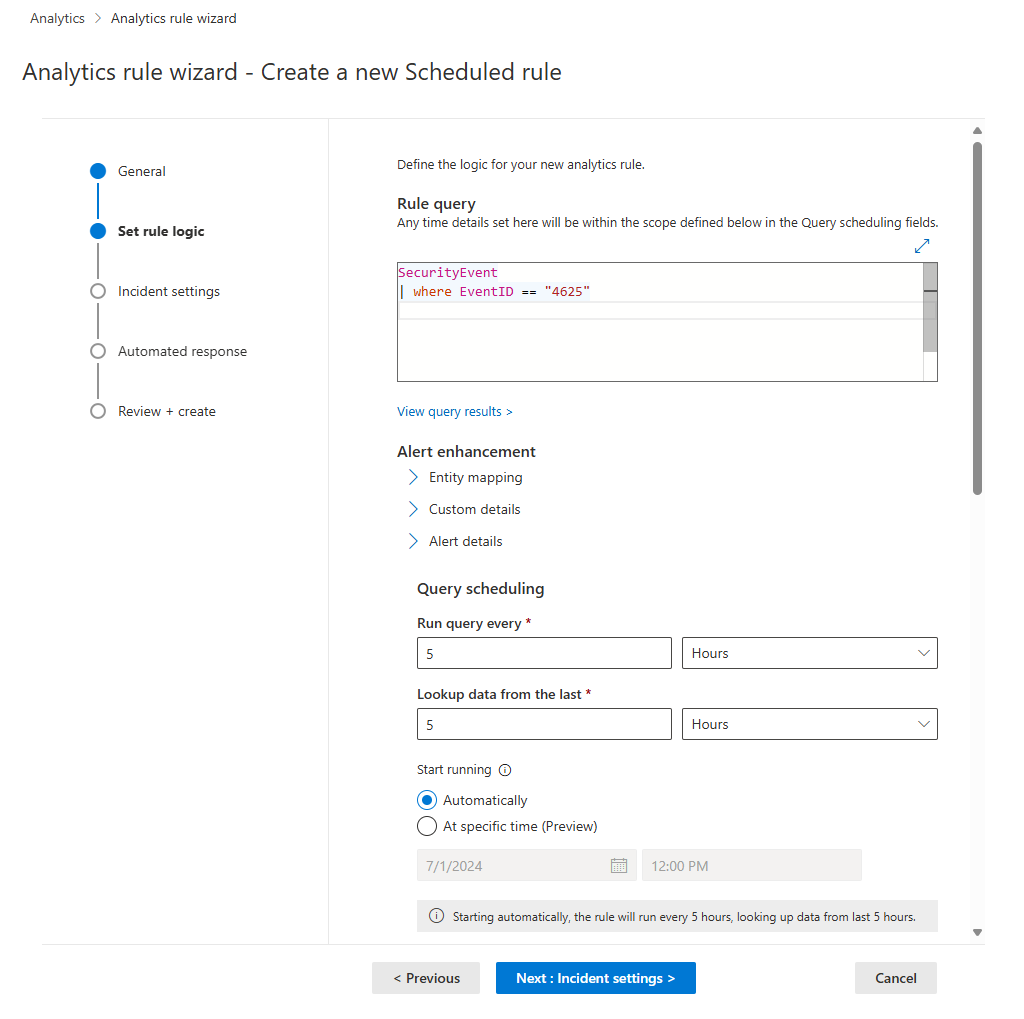
Define the rule logic
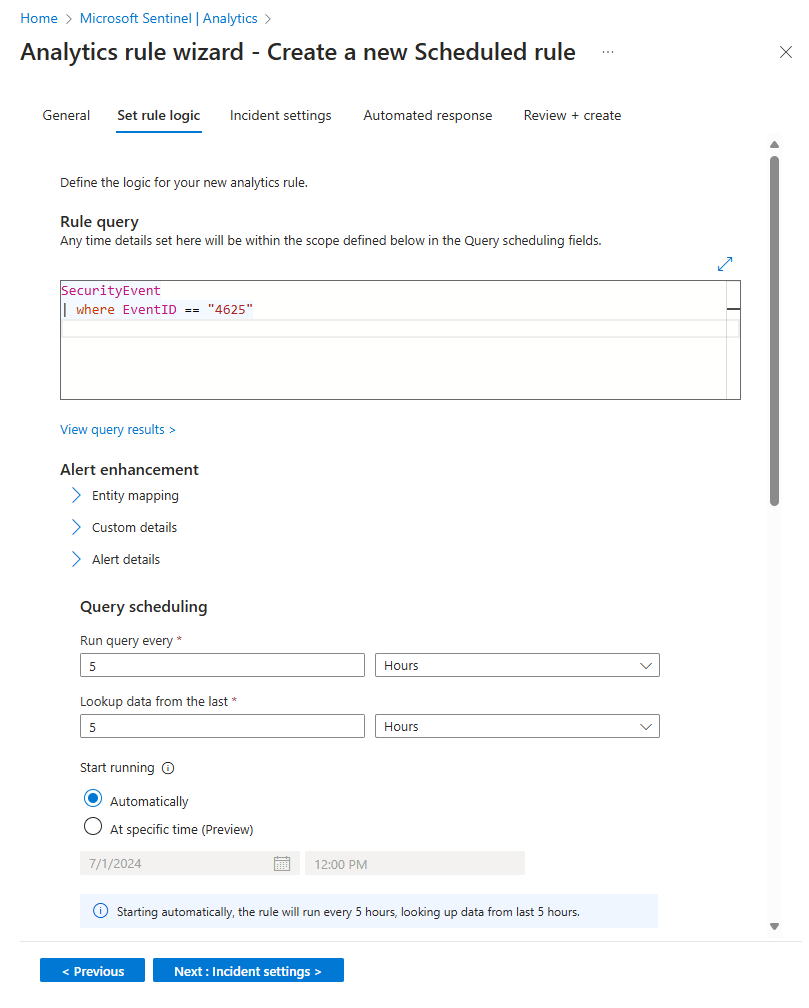
The next step is to set the rule logic which includes adding the Kusto query that you created.
Enter the rule query and alert enhancement configuration.
Setting Description Rule query Paste the query you designed, built, and tested into the Rule query window. Every change you make in this window is instantly validated, so if there are any mistakes, you’ll see an indication right below the window. Map entities Expand Entity mapping and define up to 10 entity types recognized by Microsoft Sentinel onto fields in your query results. This mapping integrates the identified entities into the Entities field in your alert schema.
For complete instructions on mapping entities, see Map data fields to entities in Microsoft Sentinel.Surface custom details in your alerts Expand Custom details and define any fields in your query results you wish to be surfaced in your alerts as custom details. These fields appear in any incidents that result as well.
For complete instructions on surfacing custom details, see Surface custom event details in alerts in Microsoft Sentinel.Customize alert details Expand Alert details and customize otherwise-standard alert properties according to the content of various fields in each individual alert. For example, customize the alert name or description to include a username or IP address featured in the alert.
For complete instructions on customizing alert details, see Customize alert details in Microsoft Sentinel.Schedule and scope the query. Set the following parameters in the Query scheduling section:
Setting Description / Options Run query every Controls the query interval: how often the query is run.
Allowed range: 5 minutes to 14 days.Lookup data from the last Determines the lookback period: the time period covered by the query.
Allowed range: 5 minutes to 14 days.
Must be longer than or equal to the query interval.Start running Automatically: The rule will run for the first time immediately upon being created, and after that at the query interval.
At specific time (Preview): Set a date and time for the rule to first run, after which it will run at the query interval.
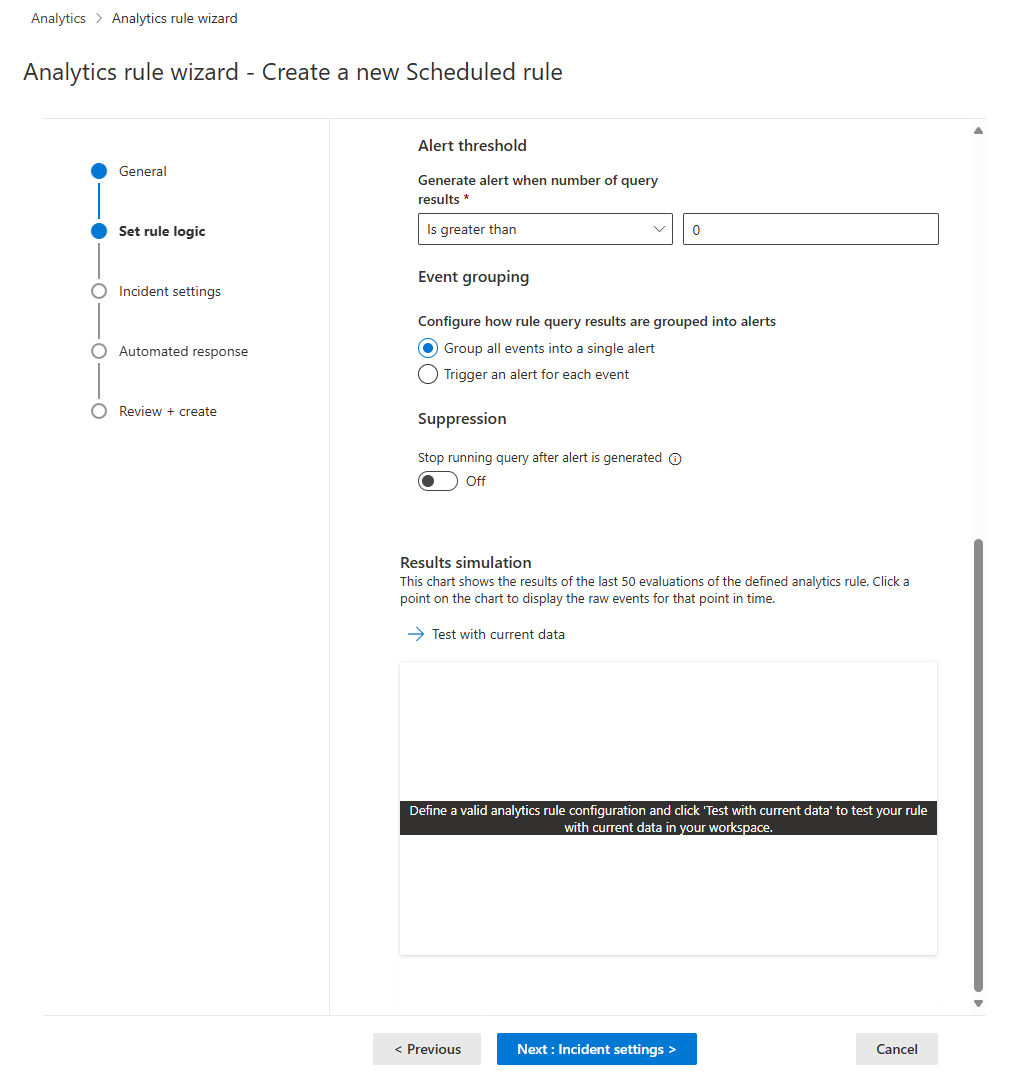
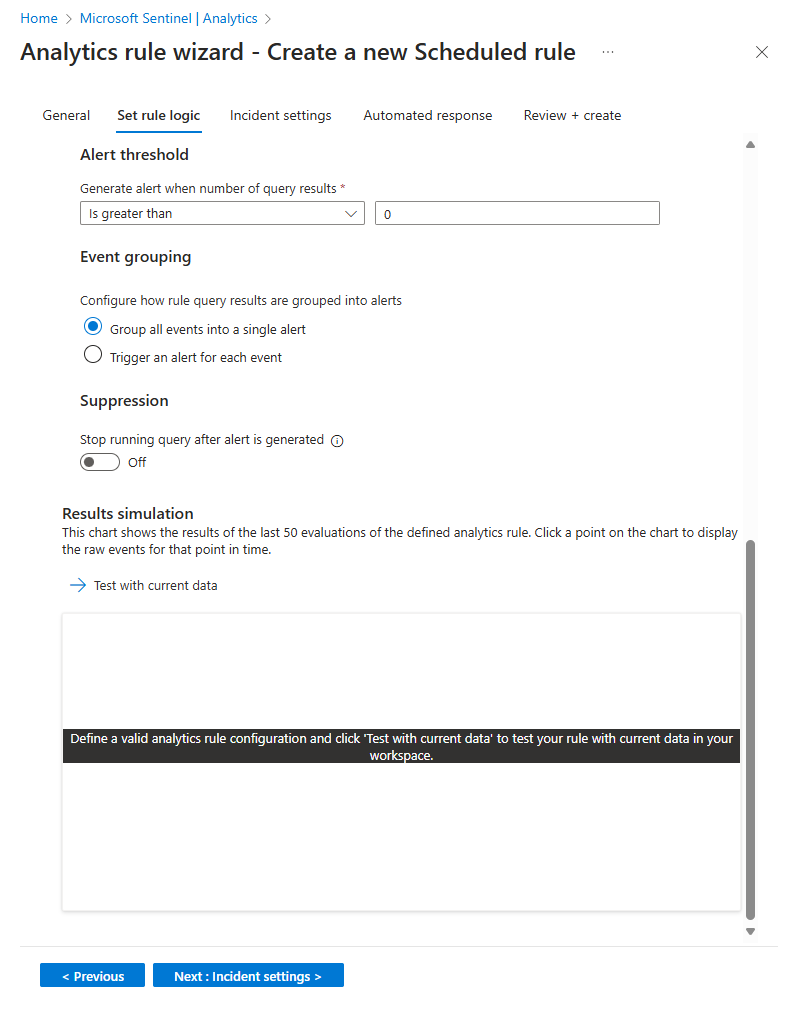
Allowed range: 10 minutes to 30 days after the rule creation (or enablement) time.Set the threshold for creating alerts.
Use the Alert threshold section to define the sensitivity level of the rule. For example, set a minimum threshold of 100:
Setting Description Generate alert when number of query results Is greater than Number of events 100If you don’t want to set a threshold, enter
0in the number field.Set event grouping settings.
Under Event grouping, choose one of two ways to handle the grouping of events into alerts:
Setting Behavior Group all events into a single alert
(default)The rule generates a single alert every time it runs, as long as the query returns more results than the specified alert threshold above. This single alert summarizes all the events returned in the query results. Trigger an alert for each event The rule generates a unique alert for each event returned by the query. This is useful if you want events to be displayed individually, or if you want to group them by certain parameters—by user, hostname, or something else. You can define these parameters in the query. Temporarily suppress rule after an alert is generated.
To suppress a rule beyond its next run time if an alert is generated, turn the Stop running query after alert is generated setting On. If you turn this on, set Stop running query for to the amount of time the query should stop running, up to 24 hours.
Simulate the results of the query and logic settings.
In the Results simulation area, select Test with current data to see what your rule results would look like if it had been running on your current data. Microsoft Sentinel simulates running the rule 50 times on the current data, using the defined schedule, and shows you a graph of the results (log events). If you modify the query, select Test with current data again to update the graph. The graph shows the number of results over the time period defined by the settings in the Query scheduling section.
Select Next: Incident settings.
Configure the incident creation settings
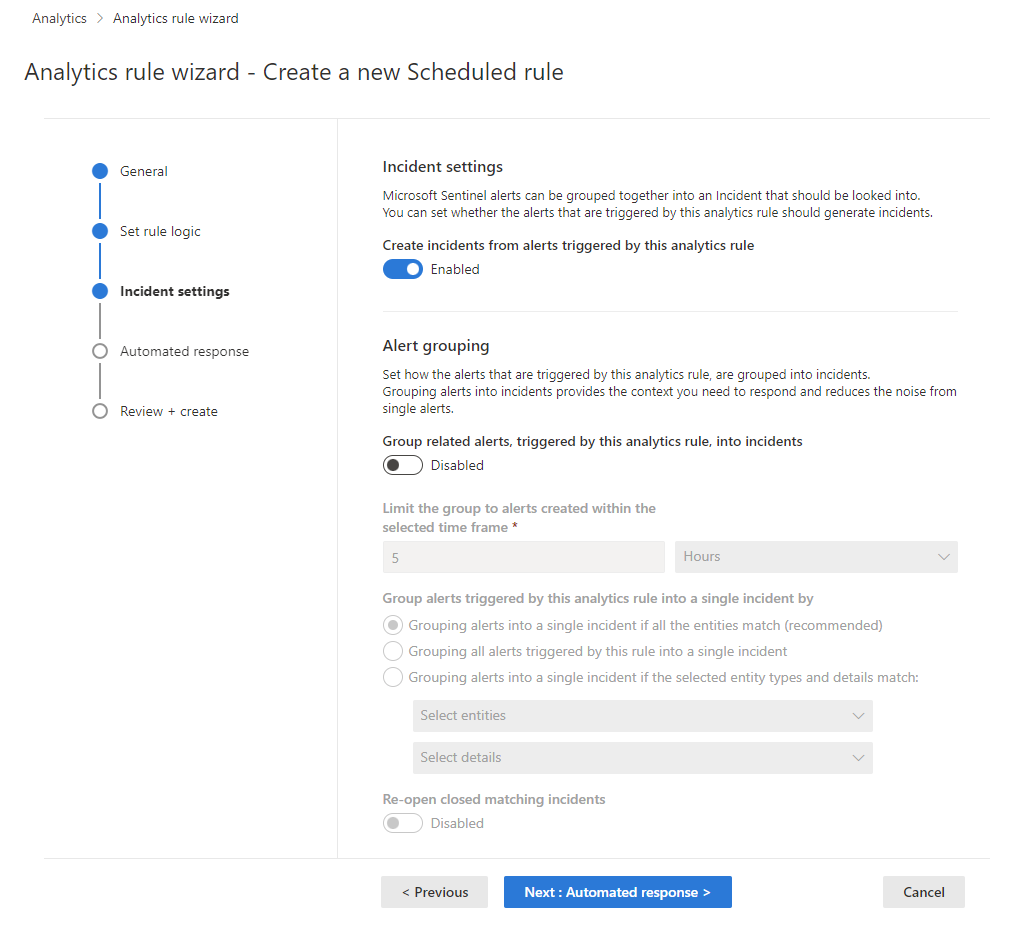
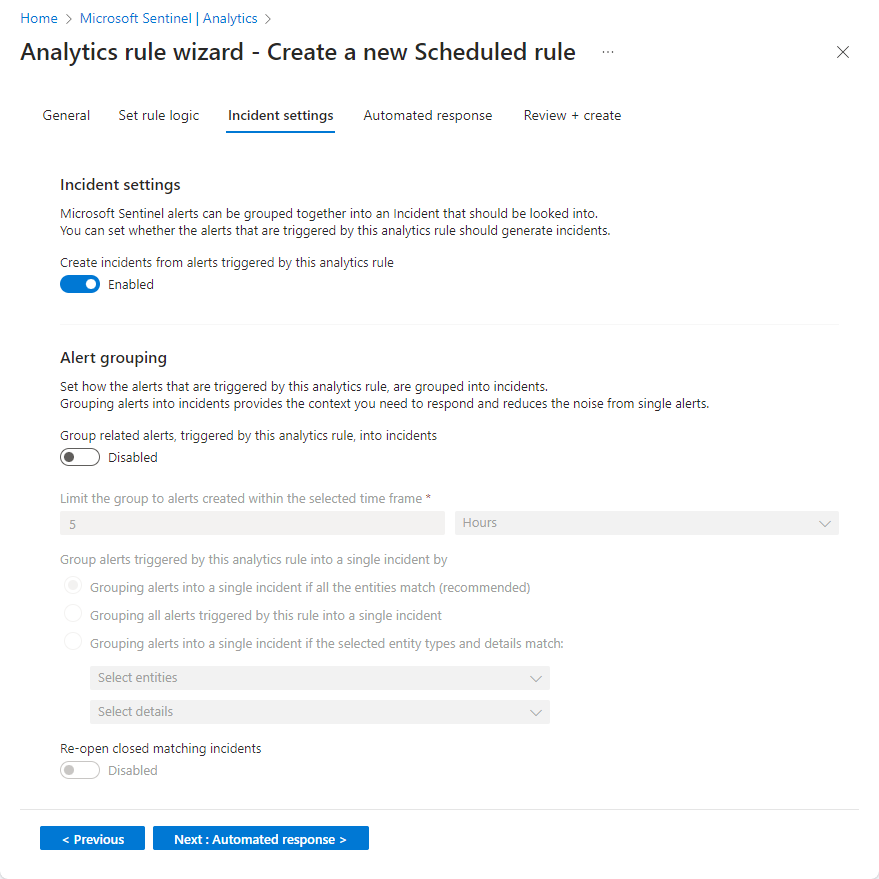
In the Incident settings tab, choose whether Microsoft Sentinel turns alerts into actionable incidents, and whether and how alerts are grouped together in incidents.
Enable incident creation.
In the Incident settings section, Create incidents from alerts triggered by this analytics rule is set by default to Enabled, meaning that Microsoft Sentinel will create a single, separate incident from each and every alert triggered by the rule.
If you don’t want this rule to result in the creation of any incidents (for example, if this rule is just to collect information for subsequent analysis), set this to Disabled.
Important
If you onboarded Microsoft Sentinel to the Microsoft Defender portal, leave this setting Enabled.
- In this scenario, incidents are created by Microsoft Defender XDR, not by Microsoft Sentinel.
- These incidents appear in the incidents queue in both the Azure and Defender portals.
- In the Azure portal, new incidents are displayed with "Microsoft XDR" as the incident provider name.
If you want a single incident to be created from a group of alerts, instead of one for every single alert, see the next step.
-
In the Alert grouping section, if you want a single incident to be generated from a group of up to 150 similar or recurring alerts (see note), set Group related alerts, triggered by this analytics rule, into incidents to Enabled, and set the following parameters.
Limit the group to alerts created within the selected time frame: Set the time frame within which the similar or recurring alerts are grouped together. Alerts outside this time frame generate a separate incident or set of incidents.
Group alerts triggered by this analytics rule into a single incident by: Choose how alerts are grouped together:
Option Description Group alerts into a single incident if all the entities match Alerts are grouped together if they share identical values for each of the mapped entities (defined in the Set rule logic tab above). This is the recommended setting. Group all alerts triggered by this rule into a single incident All the alerts generated by this rule are grouped together even if they share no identical values. Group alerts into a single incident if the selected entities and details match Alerts are grouped together if they share identical values for all of the mapped entities, alert details, and custom details selected from the respective drop-down lists. Re-open closed matching incidents: If an incident has been resolved and closed, and later on another alert is generated that should belong to that incident, set this setting to Enabled if you want the closed incident re-opened, and leave as Disabled if you want the alert to create a new incident.
This option is not available when Microsoft Sentinel is onboarded to the Microsoft Defender portal.
Important
If you onboarded Microsoft Sentinel to the Microsoft Defender portal, the alert grouping settings take effect only at the moment that the incident is created.
Because the Defender portal's correlation engine is responsible for alert correlation in this scenario, it accepts these settings as initial instructions, but it also might make decisions about alert correlation that don't take these settings into account.
Therefore, the way alerts are grouped into incidents might often be different than you would expect based on these settings.
Note
Up to 150 alerts can be grouped into a single incident.
The incident will only be created after all the alerts have been generated. All of the alerts will be added to the incident immediately upon its creation.
If more than 150 alerts are generated by a rule that groups them into a single incident, a new incident will be generated with the same incident details as the original, and the excess alerts will be grouped into the new incident.
Select Next: Automated response.
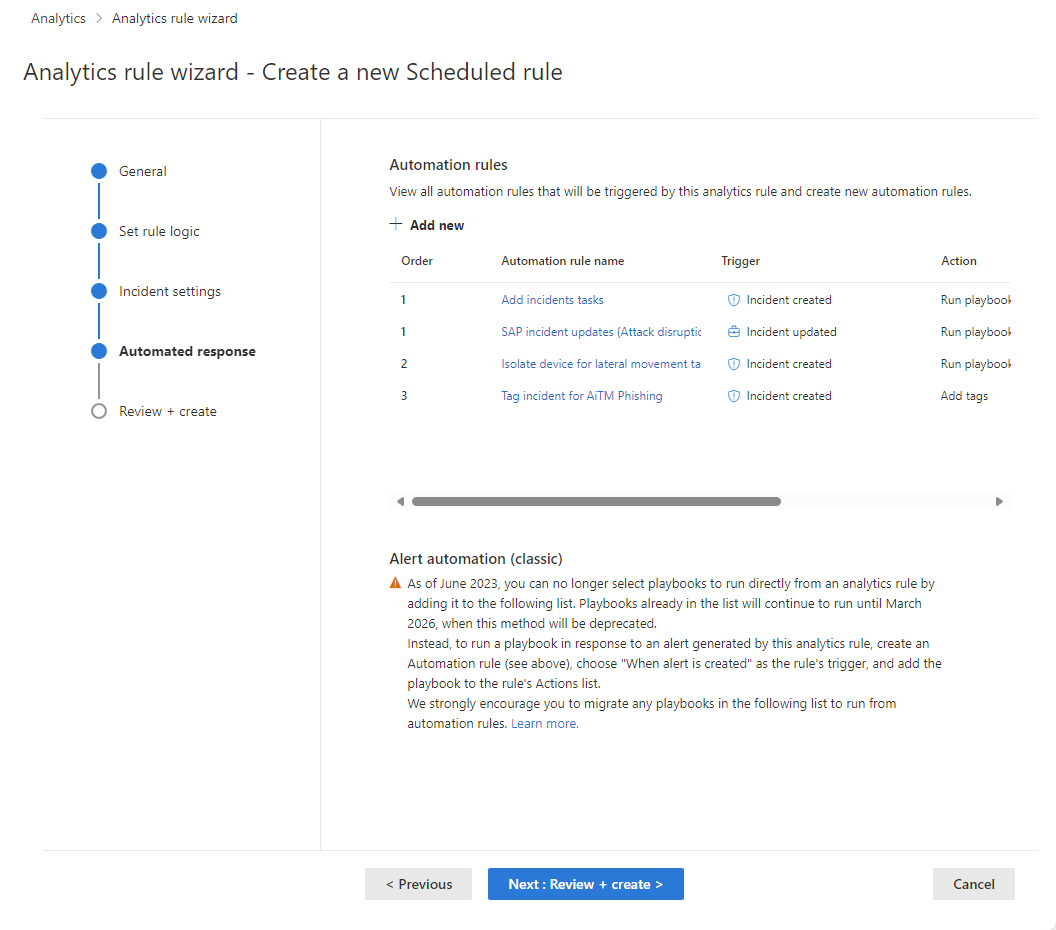
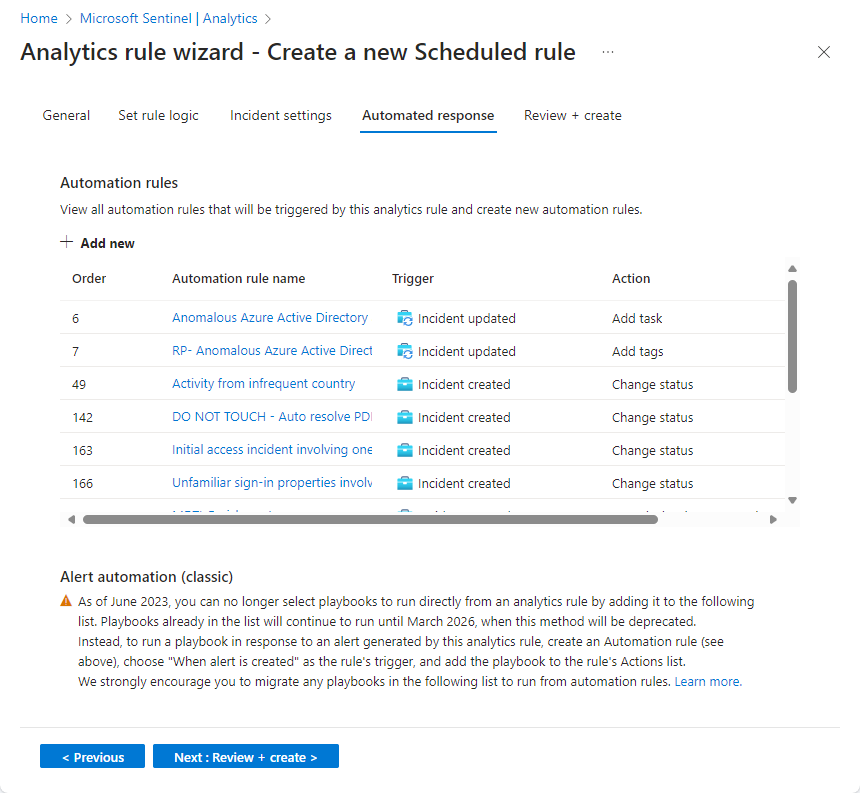
Review or add automated responses
In the Automated responses tab, see the automation rules displayed in the list. If you want to add any responses that aren't already covered by existing rules, you have two choices:
- Edit an existing rule if you want the added response to apply to many or all rules.
- Select Add new to create a new automation rule that will apply only to this analytics rule.
To learn more about what you can use automation rules for, see Automate threat response in Microsoft Sentinel with automation rules
- Under Alert automation (classic) at the bottom of the screen, you'll see any playbooks you've configured to run automatically when an alert is generated using the old method.
As of June 2023, you can no longer add playbooks to this list. Playbooks already listed here will continue to run until this method is deprecated, effective March 2026.
If you still have any playbooks listed here, you should instead create an automation rule based on the alert created trigger and invoke the playbook from the automation rule. After you've done that, select the ellipsis at the end of the line of the playbook listed here, and select Remove. See Migrate your Microsoft Sentinel alert-trigger playbooks to automation rules for full instructions.
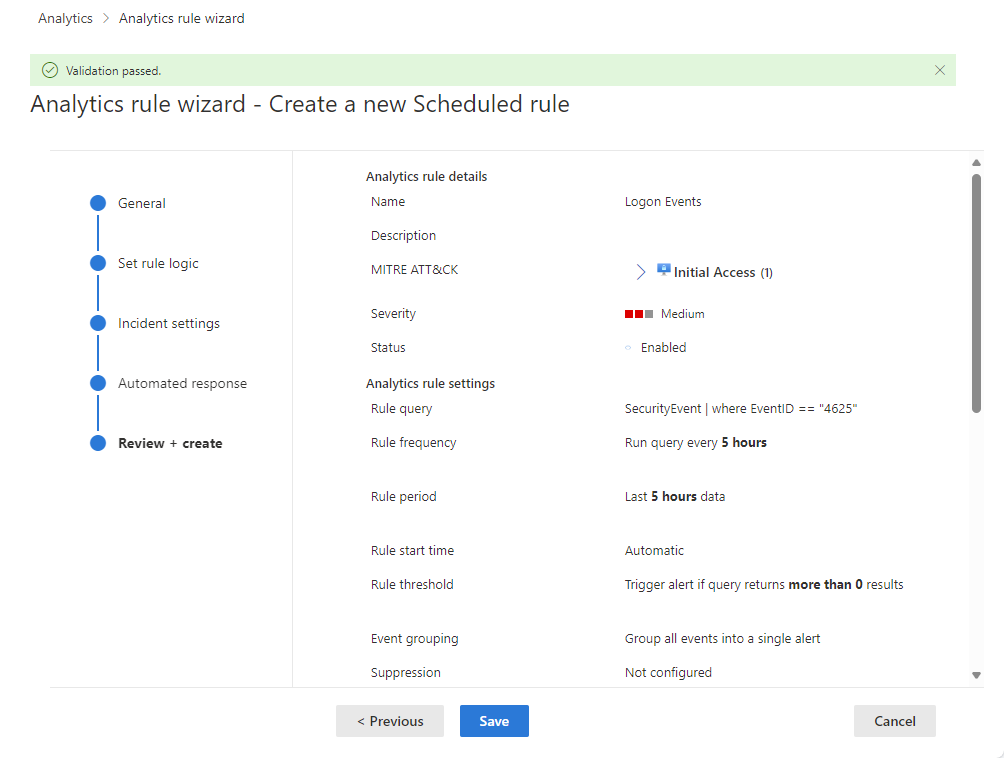
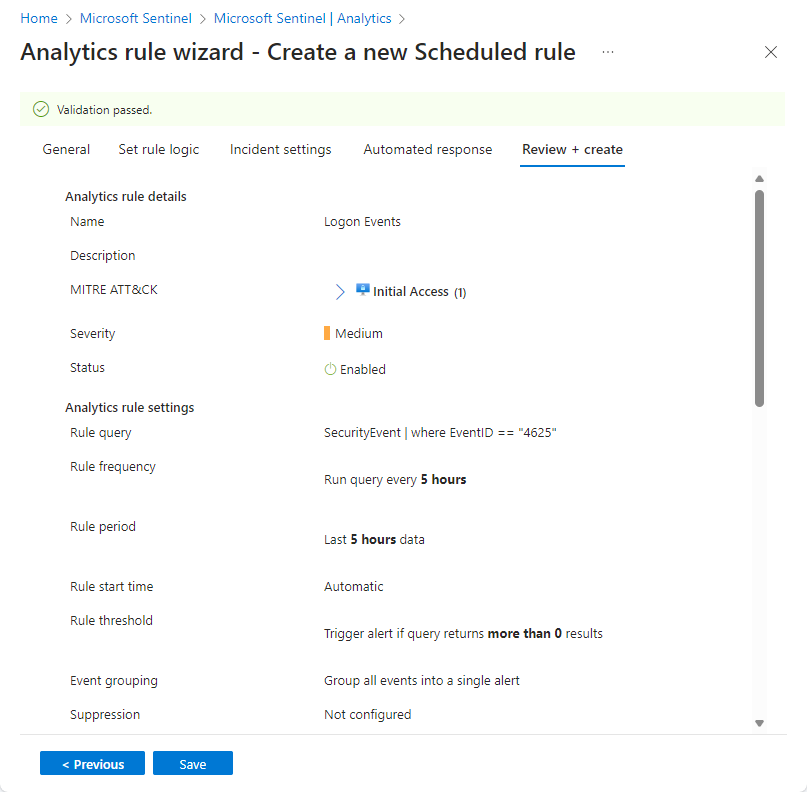
Select Next: Review and create to review all the settings for your new analytics rule.
Validate configuration and create the rule
When the "Validation passed" message appears, select Create.
If an error appears instead, find and select the red X on the tab in the wizard where the error occurred.
Correct the error and go back to the Review and create tab to run the validation again.
View the rule and its output
View the rule definition
You can find your newly created custom rule (of type "Scheduled") in the table under the Active rules tab on the main Analytics screen. From this list you can enable, disable, or delete each rule.
View the results of the rule
To view the results of the analytics rules you create in the Defender portal, expand Investigation & response in the navigation menu, then Incidents & alerts. View incidents on the Incidents page, where you can triage incidents, investigate them, and remediate the threats. View individual alerts on the Alerts page.


Tune the rule
- You can update the rule query to exclude false positives. For more information, see Handle false positives in Microsoft Sentinel.
Note
Alerts generated in Microsoft Sentinel are available through Microsoft Graph Security. For more information, see the Microsoft Graph Security alerts documentation.
Export the rule to an ARM template
If you want to package your rule to be managed and deployed as code, you can easily export the rule to an Azure Resource Manager (ARM) template. You can also import rules from template files in order to view and edit them in the user interface.
Next steps
When using analytics rules to detect threats from Microsoft Sentinel, make sure you enable all rules associated with your connected data sources to ensure full security coverage for your environment.
To automate rule enablement, push rules to Microsoft Sentinel via API and PowerShell, although doing so requires additional effort. When using API or PowerShell, you must first export the rules to JSON before enabling the rules. API or PowerShell may be helpful when enabling rules in multiple instances of Microsoft Sentinel with identical settings in each instance.
For more information, see:
- Troubleshooting analytics rules in Microsoft Sentinel
- Navigate and investigate incidents in Microsoft Sentinel
- Entities in Microsoft Sentinel
- Tutorial: Use playbooks with automation rules in Microsoft Sentinel
Also, learn from an example of using custom analytics rules when monitoring Zoom with a custom connector.