Understand the sequence stats page
The stats about sequences provide insights on the performance of a sequence, such as success rate and the state of records that are connected. The data helps you view the sequences that are doing better and emerging with high conversion rates.
Who can view the stats page?
By default, the users with sales manager and sequence manager roles can view the stats page. For other roles to view the reporting page, contact your administrator to get read access at the organizational level for the sales acceleration reports table. More information: Security roles and privileges
View the sequence stats page
Note
- Verify that an administrator has enabled the sales acceleration reporting in your organization. More information: Sequence reporting
- After an administrator enables reporting, the application might take up to 24 hours to display data on the stats page for the first time. Subsequently, data in the stats page is refreshed every four hours.
To view the sequence stats
Go to Change area in the lower-left corner of the page, and select Sales Insights settings.
Under Sales accelerator, select Sequence.
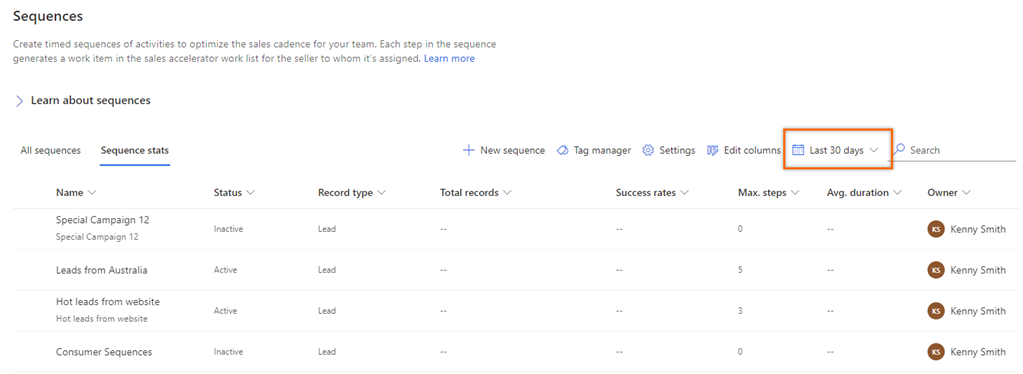
On the Sequences page, select the Sequence stats tab. The Sequences tab opens.

Understand the sequence stats page
The Sequence stats page consists of information on data related to each sequence that's available in your organization and the timeframe for which you want to view the data.
Select the timeframe
Select the timeframe for which you want to view the data. When you've made your selection, the table is refreshed to show data for that timeframe. By default, the timeframe is selected as 30 days, but you can choose from the following timeframes:
- 30 days
- 90 days
- 180 days
- 1 year
- 2 years

For example, if you want to view the data for the last 90 days, select Last 90 days from the date dropdown list. The table will be refreshed to show data for the last 90 days.
Sequence stats list
The sequence stats list consists of sequences—including inactive ones—that are available in your organization, for all record types. For the timeframe you selected, you can view information such as success rate.
The Success Rate column displays the trend of the sequence with its successful conversion rate for the connected records in the selected timeframe.
Note
The Success Rate column is available only for lead and opportunity record types.

The trend shows how a sequence is performing in the selected timeframe compared to that of the previous timeframe. For example, if you select 30 days and a sequence related to the lead record type shows an upward trend (green), this shows that the sequence has performed better in converting leads into opportunities in the current 30 days when compared to the previous 30 days. Green indicates improvement, red indicates a downward trend, and orange indicates that there has been no change in the success rate.
The percentage shows the average number of records that are successfully converted into win deals or opportunities when compared to the previous timeframe.
Can't find the feature in your app?
There are a few possibilities:
- You don't have the necessary license to use this feature. Check out the comparison table and the licensing guide to see which features are available with your license.
- You don't have the necessary security role to use this feature.
- To configure or setup a feature, you need to have the Administration and customization roles
- To use sales-related features, you need to have the Primary sales roles
- Some tasks require specific Functional roles.
- Your administrator hasn't turned on the feature.
- Your organization is using a custom app. Check with your administrator for exact steps. The steps described in this article are specific to the out-of-the-box Sales Hub and Sales Professional apps.