Athugasemd
Aðgangur að þessari síðu krefst heimildar. Þú getur prófað aðskrá þig inn eða breyta skráasöfnum.
Aðgangur að þessari síðu krefst heimildar. Þú getur prófað að breyta skráasöfnum.
APPLIES TO: ![]() Power BI Desktop
Power BI Desktop ![]() Power BI service
Power BI service
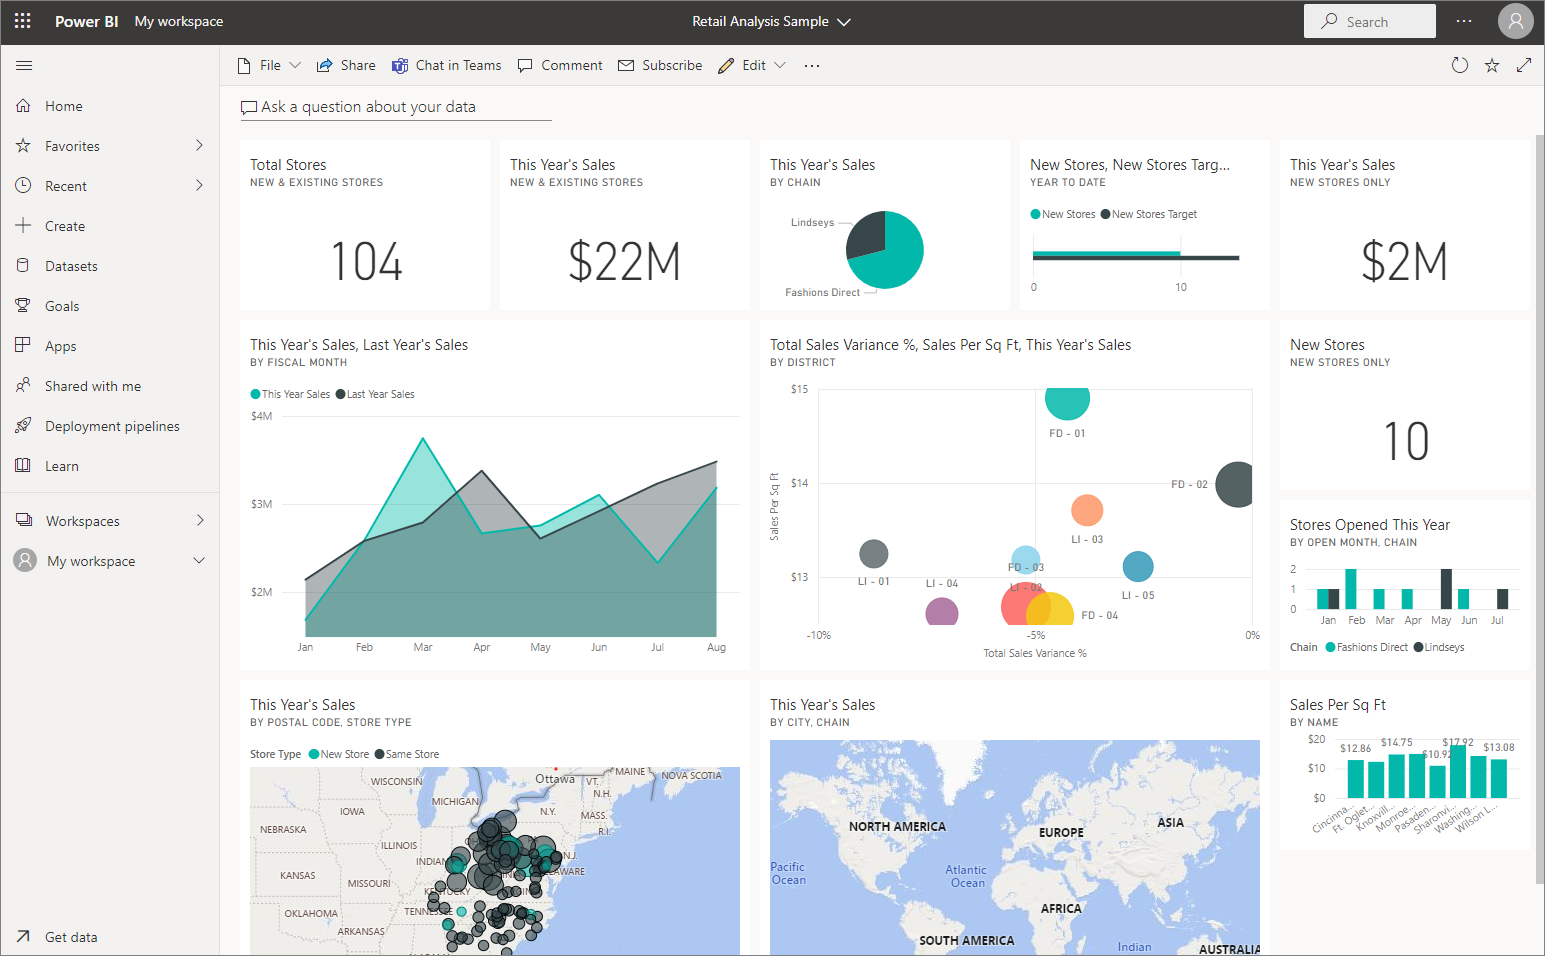
A tile is a snapshot of your data, pinned to the dashboard. You can create tiles from a report, dashboard, the Q&A box, Excel, SQL Server Reporting Services (SSRS) reports, and more. This screenshot shows many different tiles pinned to a dashboard.
Dashboards and dashboard tiles are a feature of Power BI service, not Power BI Desktop. You can't create dashboards on mobile devices but you can view and share them there.
Besides pinning tiles, you can create standalone tiles directly on the dashboard by using the Add tile control. Standalone tiles include: text boxes, images, videos, streaming data, and web content.
Need help with understanding the building blocks that make up Power BI? See Basic concepts for designers in the Power BI service.
Note
If the original visualization used to create the tile changes, the tile doesn't change. For example, if you pinned a line chart from a report and then you changed the line chart to a bar chart, the dashboard tile continues to show a line chart. The data refreshes, but the visualization type does not.
Pin a tile
There are many different ways to add (pin) a tile to a dashboard. You can pin tiles from:
- Power BI Q&A
- A report
- Another dashboard
- Excel workbook on OneDrive for work or school
- Quick Insights
- An on-premises paginated report in Power BI Report Server or SQL Server Reporting Services
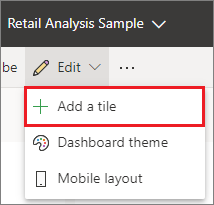
You create standalone tiles for images, text boxes, videos, streaming data, and web content directly on the dashboard by using the Add tile control.
Interact with tiles on a dashboard
After you've added a tile to a dashboard, you can move and resize it, or change its appearance and behavior.
Move and resize a tile
Grab a tile and move it around on the dashboard. Hover and select the handle  to resize the tile.
Hover over a tile to change the appearance and behavior
Hover over the tile to display the ellipsis.
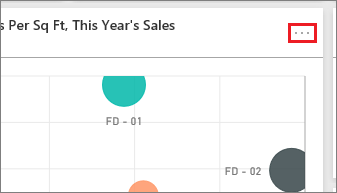
Select the ellipsis to open the tile action menu.
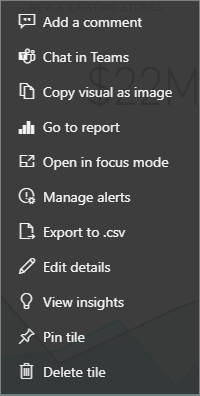
From here you can:
To close the action menu, select a blank area in the dashboard.
Select a tile
When you select a tile, what happens next depends on how you created the tile. Otherwise, selecting the tile takes you to the report, Excel Online workbook, on-premises Reporting Services report, or Q&A question that was used to create the tile. Or, if it has a custom link, selecting the tile takes you to that link.
Note
An exception is video tiles created directly on the dashboard by using Add tile. Selecting a video tile (that was created this way) causes the video to play directly on the dashboard.
Considerations and troubleshooting
- If the report that was used to create the visualization wasn't saved, selecting the tile produces no action.
- If the tile was created from a workbook in Excel Online, you need at least Read permissions for that workbook. Otherwise, selecting the tile won't open the workbook in Excel Online.
- Say you create a tile directly on the dashboard by using Add tile and set a custom hyperlink for it. If so, when you select the title, subtitle, or tile, it opens that URL. Otherwise, by default, when you select a tile created directly on the dashboard for an image, web code, or text box, nothing happens.
- Tiles can be created from on-premises paginated reports in Power BI Report Server or SQL Server Reporting Services. If you don't have permission to access the on-premises report, selecting the tile takes you to a page indicating you don't have access (rsAccessDenied).
- Say you select a tile created from an on-premises paginated report in Power BI Report Server or SQL Server Reporting Services. If you don't have access to the network where the report server is located, selecting a tile created from that paginated report takes you to a page that indicates it can't locate the server (HTTP 404). Your device needs network access to the report server to view the report.
- If the original visualization that's used to create the tile changes, the tile doesn't change. For example, if you pin a line chart from a report and then you change the line chart to a bar chart, the dashboard tile continues to show a line chart. The data refreshes, but the visualization type doesn't.
- Some changes you make to a visual in a report aren't reflected in the tile you pin to a dashboard. For example, background color, width/height, and tooltips. Even if you turn tooltips off completely for a visual in a Power BI report, when you pin that visual to a dashboard in the Power BI service, the basic tooltip will still be displayed.
Related content
- Create a card (large number tile) for your dashboard
- Introduction to dashboards for Power BI designers
- Data refresh in Power BI
- Basic concepts for designers in the Power BI service
- Integrating Power BI tiles into Office documents
- Pin Reporting Services items to Power BI dashboards
More questions? Try the Power BI Community.