Nóta
Aðgangur að þessari síðu krefst heimildar. Þú getur prófað aðskrá þig inn eða breyta skráasöfnum.
Aðgangur að þessari síðu krefst heimildar. Þú getur prófað að breyta skráasöfnum.
With Model view in Power BI Desktop, you can view and work with complex semantic models that contain many tables.
Use Model view
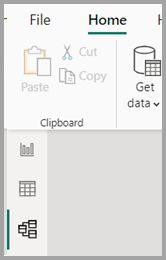
To access Model view, select the Model icon found on the left side of Power BI Desktop, as shown in the following image.
Create separate diagrams
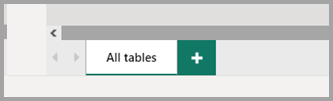
With Model view, you can create diagrams of your model that contain only a subset of the tables in your model. This reorganization can help provide a clearer view into the tables you want to work with, and make working with complex semantic models easier. To create a new diagram with only a subset of the tables, select the + button next to the All tables tab along the bottom of the Power BI Desktop window.
You can then drag a table from the Data pane onto the diagram surface. Right-click the table, and then select Add related tables from the menu that appears.
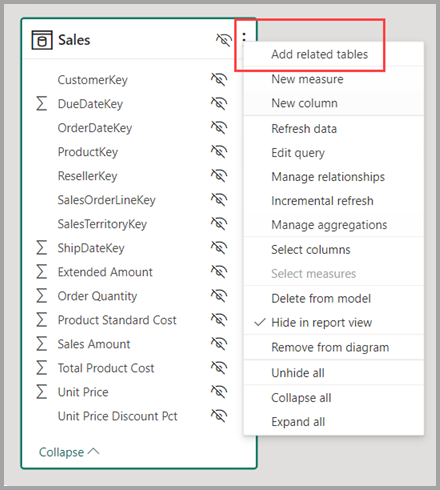
When you do, tables that are related to the original table are displayed in the new diagram. The following image shows how related tables are displayed after selecting the Add related tables menu option.
Note
You can also find the Add related tables option in the context menu on the background of the model view. When selected, any table that has any relationship to any table already included in the layout will be added to the layout.
Use Model explorer (preview)
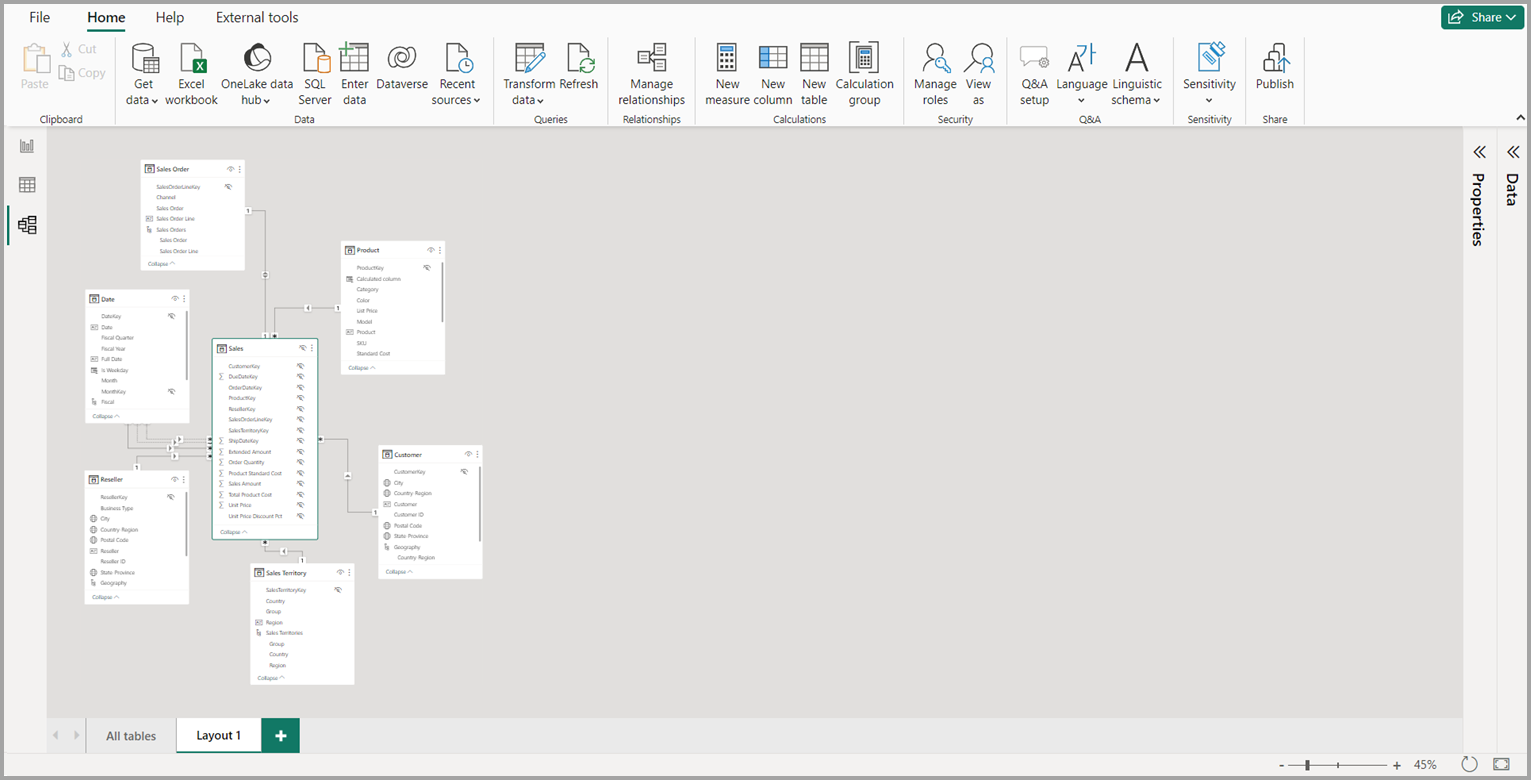
To access Model explorer, make sure you're in Model view by selecting the Model icon found on the left side of Power BI Desktop. Then in the Data pane, select Model as shown in the following image.

The Model explorer shows a tree view of the semantic model or data model with the number of items in each node displayed. Learn more about Model explorer.
Set common properties
You can select multiple objects at once in Model view by holding down the Ctrl key and selecting multiple tables. When you select multiple tables, they become highlighted in Modeling view. When multiple tables are highlighted, changes applied in the Properties pane apply to all selected tables.
For example, you could change the visibility for multiple tables in your diagram view by holding down the Ctrl key, selecting tables, then changing the is hidden setting in the Properties pane.

Related content
The following articles describe more about data models, and also describe DirectQuery in detail.
- Automatic aggregations
- Use composite models in Power BI Desktop
- Manage storage mode in Power BI Desktop
- Many-to-many relationships in Power BI Desktop
DirectQuery articles: