Overview of integration with Application Insights
Application Insights, a feature of Azure Monitor, is widely used within the enterprise landscape for monitoring and diagnostics. Data that has already been collected from a specific tenant or environment is pushed to your own Application Insights environment. The data is stored in Azure Monitor logs by Application Insights, and visualized in Performance and Failures panels under Investigate on the left pane. The data is exported to your Application Insights environment in the standard schema defined by Application Insights. The support, developer, and admin personas can use this feature to triage and resolve issues.
Application Insights has a wide range of features to help you use telemetry data:
- Create a dashboard for an overview of the health of your org.
- Perform proactive monitoring by using Smart Detection.
- Set up alerts for important scenarios based on your org.
- Visualize and track common navigation patterns from a usage perspective. This will help you understand, for example, whether a user always selects a specific tab first before navigating back to the main tab and closing the form. If so, this might indicate that a field should be positioned on the first tab, instead of another tab, to save the user time every time they open this record.
- Create custom queries to troubleshoot performance and errors by using the Logs panel under Monitoring on the left pane.
Example: List the top 100 records for form loads in the pageViews table:
pageViews
| take 100
Overview panel in Application Insights
Application Insights provides different views. The Overview panel shows a summary of the key diagnostic metrics of your app and is a gateway to the other features of the portal. You can drill into metrics for more details. See the following sample.

Performance panel in Application Insights
To open the Performance panel, either select the Server Response Time graph in the Overview panel or select Performance under Investigate on the left pane. Application Insights allows you to choose Server and Browser data views. By identifying those operations with the longest duration, you can diagnose potential problems.
The Performance panel shows the count and average duration of each operation for the application. You can use this information to identify those operations that most affect users.
The Server view shows the most frequently called APIs and what the latency looks like.

Operations with a higher number of calls and higher duration are potential items for investigation. In the above example, POST /XRMServices/2011/Organization.svc/web has a high number of calls and a high duration. Similarly, GET /api/data/v9.0/accounts has a relatively high duration.
Selecting one of the operations will also show you details about the top three dependencies and time taken. You can see more details by selecting the Dependencies tab.
If you switch to the Browser view, you'll see data about which pages are being viewed most frequently in the environment and the latency for each of them. You'll see metrics including session counts and the dependencies associated with different operations. For example, selecting the Accounts operation shows requests made to the account table.

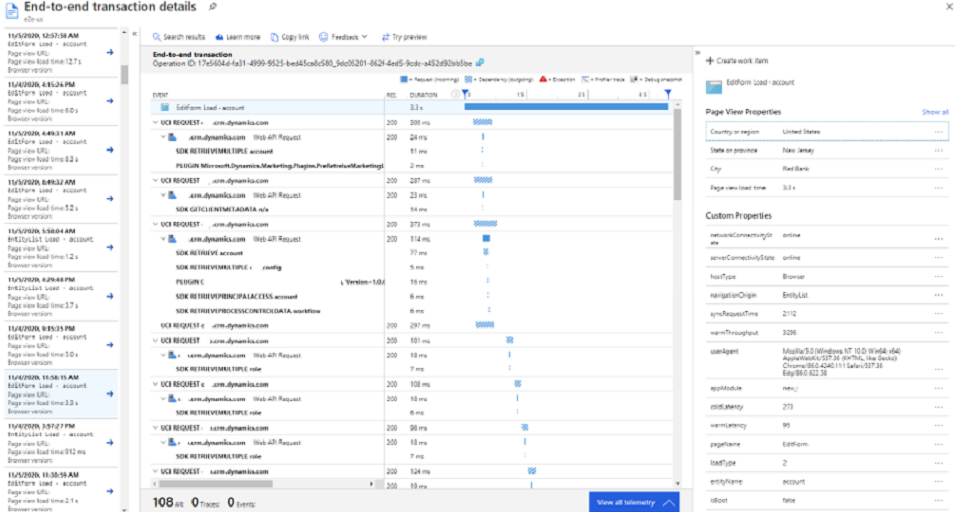
You can drill into a specific sample to see where time is spent on the particular operation.

More information: Find and diagnose performance issues with Azure Application Insights
Failures panel in Application Insights
To open the Failures panel, either select Failures under Investigate on the left pane or select the Failed requests graph.
The exceptions table in Application Insights powers the Failures panel. It shows the count of failed requests and the number of users affected for each operation for the application. You can see error details for the operations and dependencies, for both server and browser. Failures related to create/read/update/delete (CRUD)–specific HTTP methods (GET, POST, PUT, and DELETE) used in the API operations are available here. This can be used to identify those failures that most affect users. For example, in the following sample you can see that the GET/api/data/v9.0/GetClientMetaData operation has a high number of failures and users. Selecting this operation shows more information about it in the right panel.

You can also see the failures related to the dependencies, including a summary view of the common response codes mapped to failures.

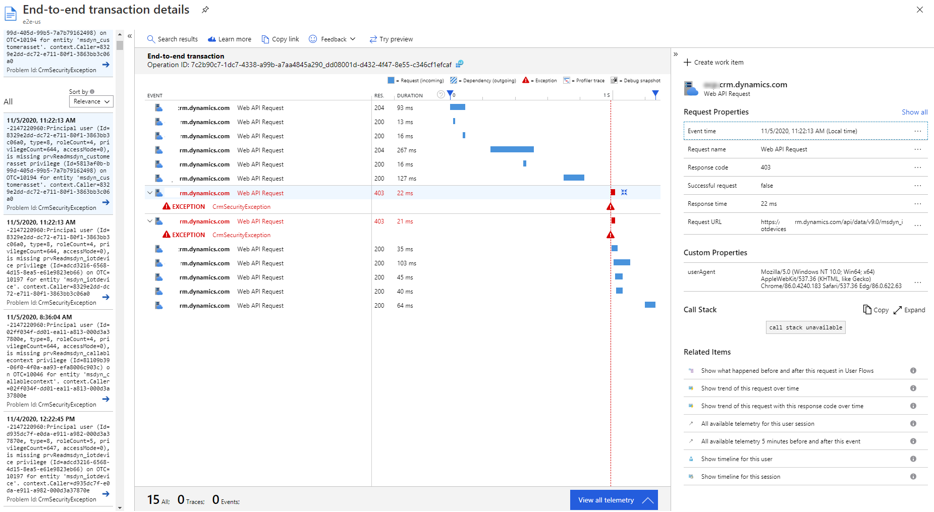
You can drill into the details of the step where the bottleneck occurred.

More information: Find and diagnose run-time exceptions with Azure Application Insights
Querying data in Application Insights
In Application Insights, go to the Logs panel under Monitoring on the left pane.

Common fields
All the tables populated in Application Insights have these common fields:
cloud_RoleInstance: For events emitted as a part of this effort, this field will be set to CDS Data Export to ensure that they can be distinguished from other events in the same Application Insights environment.
operation_Id: This links together all the operations in a single interaction—which is one way to get all related events to a failing event.
pageViews
| where operation_Id == "[insert id here]"
session_Id : This uniquely identifies all activities in a single user session. The session value is reset when a user opens a new tab, selects F5/refresh, or closes and reopens the mobile app.
user_Id, user_AuthenticatedId: These are both currently set to the Microsoft Entra ID of the user.
client_IP: This field is always populated with
0.0.0.0for compliance with privacy laws and regulations. The IP address provided is used to populate the client_City, client_StateOrProvince, and client_CountryOrRegion fields.client_Type: The value here is Browser if the logs are coming from Unified Interface and Server if the logs are coming from Dataverse. Note that the userAgent can be found in the requests table under customDimensions, when available.
Because the Application Insights schema is fixed, and this feature pushed data into Application Insights as an export process, the customDimensions fields in Application Insights are used to add properties.