GroupBy and Ungroup functions
Applies to:
Canvas apps
Model-driven apps
Power Pages
Groups and ungroups records of a table.
Description
The GroupBy function returns a table with records grouped together based on the values in one or more columns. Records in the same group are placed into a single record, with a column added that holds a nested table of the remaining columns.
The Ungroup function reverses the GroupBy process. This function returns a table, breaking into separate records any records that were grouped together.
You can group records by using GroupBy, modify the table that it returns, and then ungroup records in the modified table by using Ungroup. For example, you can remove a group of records by following this approach:
- Use the GroupBy function.
- Use the Filter function to remove the entire group of records.
- Use the Ungroup function.
You can also aggregate results based on a grouping:
- Use the GroupBy function.
- Use the AddColumns function with Sum, Average, and other aggregate functions to add a new column, which is an aggregate of the group tables.
- Use the DropColumns function to drop the group table.
Ungroup tries to preserve the original order of the records that were fed to GroupBy. This isn't always possible (for example, if the original table contains blank records).
A table is a value in Power Apps, just like a string or a number. You can specify a table as an argument for a function, and a function can return a table. GroupBy and Ungroup don't modify a table; instead they take a table as an argument and return a different table. See working with tables for more details.
Note
In Power Apps prior to version 3.24042, column names were specified with a text string using double quotes, and if connected to a data source they also needed to be logical names. For example, the logical name "cr43e_name" with double quotes was used instead of the display name Name without quotes. For SharePoint and Excel data sources that contain column names with spaces, each space was specified with "_x0020_", for example "Column Name" as "Column_x0020_Name". After this version, all apps were automatically updated to the new syntax described in this article.
Syntax
GroupBy( Table, ColumnName1 [, ColumnName2, ... ], GroupColumnName )
- Table - Required. Table to be grouped.
- ColumnName(s) - Required. The column names in Table by which to group records. These columns become columns in the resulting table.
- GroupColumnName - Required. The column name for the storage of record data not in the ColumnName(s).
Ungroup( Table, GroupColumnName )
- Table - Required. Table to be ungrouped.
- GroupColumnName - Required. The column that contains the record data setup with the GroupBy function.
Examples
Create a collection
- Add a button, and set its Text property so that the button shows Original.
- Set the OnSelect property of the Original button to this formula:
ClearCollect( CityPopulations,
    { City: "London",    Country: "United Kingdom", Population: 8615000},
    { City: "Berlin",    Country: "Germany",        Population: 3562000},
    { City: "Madrid",    Country: "Spain",          Population: 3165000},
    { City: "Rome",      Country: "Italy",          Population: 2874000},
    { City: "Paris",     Country: "France",         Population: 2273000},
    { City: "Hamburg",   Country: "Germany",        Population: 1760000},
    { City: "Barcelona", Country: "Spain",          Population: 1602000},
    { City: "Munich",    Country: "Germany",        Population: 1494000},
    { City: "Milan",     Country: "Italy",          Population: 1344000}
)
While holding down the Alt key, select the Original button.
You just created a collection, named CityPopulations, that contains this data:
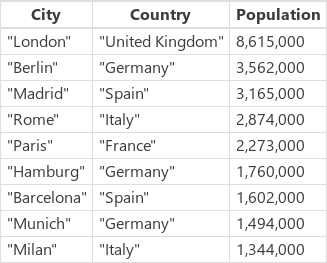
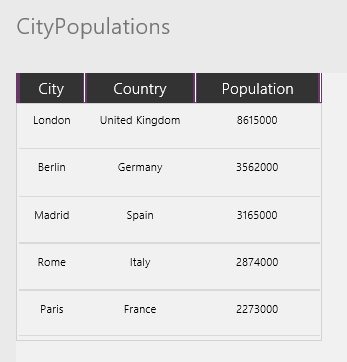
To display this collection, select Collections on the File menu and then select the CityPopulations collection. The first five records in the collection appear:
Group records
Add another button, and set its Text property to "Group".
Set the OnSelect property of this button to this formula:
ClearCollect( CitiesByCountry, GroupBy( CityPopulations, Country, Cities ) )
While holding down the Alt key, select the Group button.
You just created a collection, named CitiesByCountry, in which the records of the previous collection are grouped by the Country column.
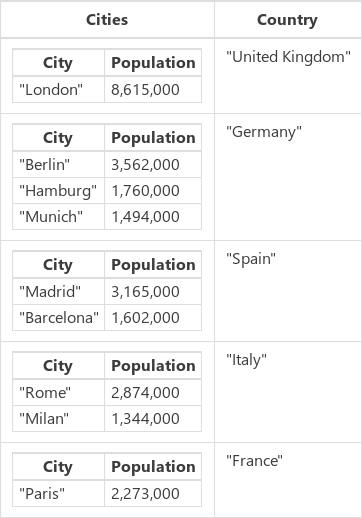
To display the first five records in this collection, select Collections on the File menu.
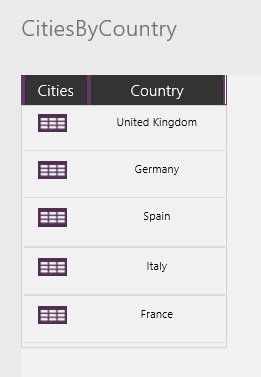
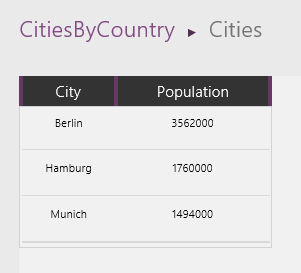
To display the populations of cities in a country/region, select the table icon in the Cities column for that country/region (for example, Germany):
Filter and ungroup records
Add another button, and set its Text property so that the button shows "Filter".
Set the OnSelect property of this button to this formula:
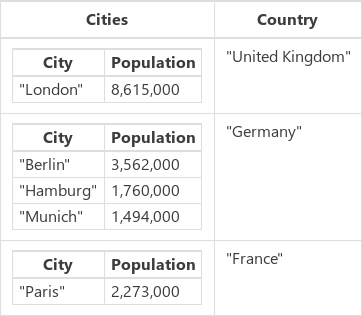
ClearCollect( CitiesByCountryFiltered, Filter( CitiesByCountry, "e" in Country ) )
While holding down the Alt key, select the button that you added.
You just created a third collection, named CitiesByCountryFiltered, that includes only those countries that have an "e" in their names (that is, not Spain or Italy).
Add one more button, and set its Text property so that the button shows "Ungroup".
Set the OnSelect property of this button to this formula:
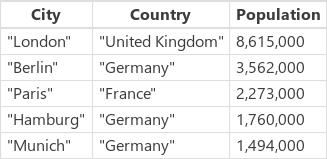
ClearCollect( CityPopulationsUngrouped, Ungroup( CitiesByCountryFiltered, Cities ) )
Which results in:
Aggregate results
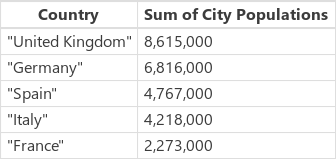
Another operation we can perform on a grouped table is to compile the results. In this example, we'll sum the population of the major cities in each country/region.
Add another button, and set its Text property so that the button shows "Sum".
Set the OnSelect property of the "Sum" button to this formula:
ClearCollect( CityPopulationsSum, AddColumns( CitiesByCountry, 'Sum of City Populations', Sum( Cities, Population ) ) )
Which results in:
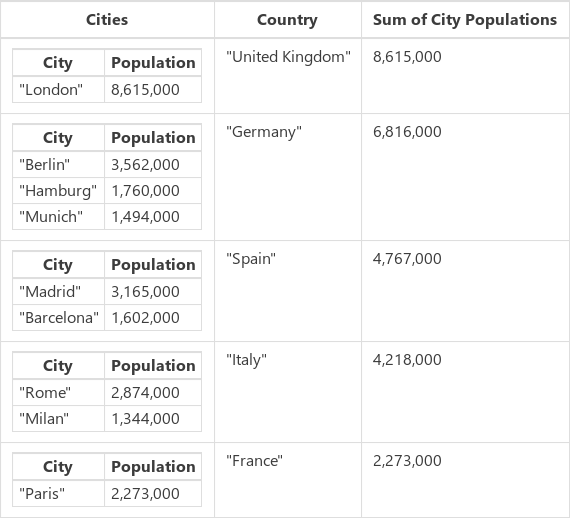
AddColumns starts with the base CitiesByCountry collection and adds a new column Sum of City Populations. This column's values are calculated row-by-row, based on the formula Sum( Cities, Population ). AddColumns provides the value of the Cities column (a table) for each row, and Sum adds up the Population for each row of this sub table.
Now that we have the sum that we want, we can use DropColumns to remove the sub tables.
Add another button, and set its Text property so that the button shows "SumOnly".
Set the OnSelect property of the "SumOnly" button to this formula:
ClearCollect( CityPopulationsSumOnly, DropColumns( CityPopulationsSum, Cities ) )
Which results in:
Note that we didn't need to ungroup this table.