Nota
L'accesso a questa pagina richiede l'autorizzazione. È possibile provare ad accedere o modificare le directory.
L'accesso a questa pagina richiede l'autorizzazione. È possibile provare a modificare le directory.
Come modello di dati, quando si scrivono espressioni di misura, è possibile che si verifichino casi in cui non è possibile restituire un valore significativo. In questi casi, è possibile che si sia tentati di restituire un valore, ad esempio zero. È consigliabile determinare attentamente se questa progettazione è efficiente e pratica.
Si consideri la seguente definizione di misura che converte i risultati BLANK esplicitamente in zero.
Sales (No Blank) =
IF(
    ISBLANK([Sales]),
    0,
    [Sales]
)
Consider another measure definition that also converts BLANK results to zero.
Profit Margin =
DIVIDE([Profit], [Sales], 0)
The DIVIDE function divides the Profit measure by the Sales measure. Se il risultato è zero o BLANK, viene restituito il terzo argomento, ovvero il risultato alternativo (facoltativo). In questo esempio, poiché zero viene passato come risultato alternativo, la misura restituisce sempre un valore.
Queste progettazioni di misure sono inefficienti e portano a progetti report di scarsa qualità.
When they're added to a report visual, Power BI attempts to retrieve all groupings within the filter context. The evaluation and retrieval of large query results often leads to slow report rendering. Ogni misura di esempio trasforma efficacemente un calcolo sparso in un calcolo denso, costringendo Power BI a utilizzare più memoria di quanto sia necessario.
Also, too many groupings often overwhelm your report users.
Let's see what happens when the Profit Margin measure is added to a table visual, grouping by customer.
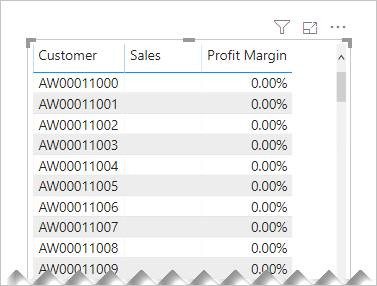
The table visual displays an overwhelming number of rows. Sono infatti presenti 18.484 clienti nel modello e quindi la tabella tenta di visualizzarli tutti. Si noti che i clienti in vista non hanno raggiunto alcuna vendita. Tuttavia, poiché la misura Profit Margin restituisce sempre un valore, vengono visualizzate.
Note
Quando sono presenti troppi punti dati da visualizzare in un oggetto visivo, Power BI può usare strategie di riduzione dei dati per rimuovere o riepilogare risultati di query di grandi dimensioni. Per altre informazioni, vedere Limiti e strategie dei punti dati in base al tipo di visualizzazione.
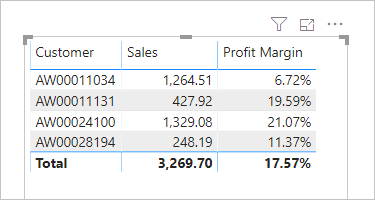
Vediamo cosa accade quando la definizione della misura Profit Margin viene migliorata. Ora restituisce un valore solo quando la misura Sales non è BLANK (o zero).
Profit Margin =
DIVIDE([Profit], [Sales])
The table visual now displays only customers who have made sales within the current filter context. La misura migliorata consente di ottenere un'esperienza più efficiente e pratica per gli utenti del report.
Tip
When necessary, you can configure a visual to display all groupings (that return values or BLANK) within the filter context by enabling the Show Items With No Data option.
Recommendation
È consigliabile che le misure restituiscano BLANK quando non si può restituire un valore significativo.
Questo approccio di progettazione è efficiente, consentendo a Power BI di eseguire il rendering dei report più velocemente. Also, returning BLANK is better because report visuals—by default—eliminate groupings when summarizations are BLANK.
Contenuto correlato
- Learning path: Use DAX in Power BI Desktop
- Questions? Prova a chiedere alla community di Power BI
- Suggestions? Contribuire con idee per migliorare Power BI