Nota
L'accesso a questa pagina richiede l'autorizzazione. È possibile provare ad accedere o modificare le directory.
L'accesso a questa pagina richiede l'autorizzazione. È possibile provare a modificare le directory.
Questo articolo descrive le nozioni di base della scrittura di unit test per gli oggetti visivi di Power BI, incluse le procedure seguenti:
- Configurare il framework di test dello strumento di test di Karma JavaScript, Jasmine.
- Usare il pacchetto powerbi-visuals-utils-testutils.
- Usare simulazioni e falsi per semplificare il testing unità degli oggetti visivi di Power BI.
Prerequisiti
- Un progetto di oggetti visivi di Power BI installato
- Ambiente Node.js configurato
Gli esempi in questo articolo usano l'oggetto visivo grafico a barre per il test.
Installare e configurare il test runner di Karma JavaScript e Jasmine
Aggiungere le librerie necessarie al file package.json nella devDependencies sezione :
"@types/d3": "5.7.2",
"@types/d3-selection": "^1.0.0",
"@types/jasmine": "^3.10.2",
"@types/jasmine-jquery": "^1.5.34",
"@types/jquery": "^3.5.8",
"@types/karma": "^6.3.1",
"@types/lodash-es": "^4.17.5",
"coveralls": "^3.1.1",
"d3": "5.12.0",
"jasmine": "^3.10.0",
"jasmine-core": "^3.10.1",
"jasmine-jquery": "^2.1.1",
"jquery": "^3.6.0",
"karma": "^6.3.9",
"karma-chrome-launcher": "^3.1.0",
"karma-coverage": "^2.0.3",
"karma-coverage-istanbul-reporter": "^3.0.3",
"karma-jasmine": "^4.0.1",
"karma-junit-reporter": "^2.0.1",
"karma-sourcemap-loader": "^0.3.8",
"karma-typescript": "^5.5.2",
"karma-typescript-preprocessor": "^0.4.0",
"karma-webpack": "^5.0.0",
"powerbi-visuals-api": "^3.8.4",
"powerbi-visuals-tools": "^3.3.2",
"powerbi-visuals-utils-dataviewutils": "^2.4.1",
"powerbi-visuals-utils-formattingutils": "^4.7.1",
"powerbi-visuals-utils-interactivityutils": "^5.7.1",
"powerbi-visuals-utils-tooltiputils": "^2.5.2",
"puppeteer": "^11.0.0",
"style-loader": "^3.3.1",
"ts-loader": "~8.2.0",
"ts-node": "^10.4.0",
"tslint": "^5.20.1",
"tslint-microsoft-contrib": "^6.2.0"
Per altre informazioni su package.json, vedere la descrizione in npm-package.json.
Salvare il file package.json ed eseguire il comando seguente nel percorso del file package.json :
npm install
Gestione pacchetti installa tutti i nuovi pacchetti aggiunti a package.json.
Per eseguire unit test, configurare il test runner e la webpack configurazione.
Il codice seguente è un esempio del file test.webpack.config.js :
const path = require('path');
const webpack = require("webpack");

module.exports = {
    devtool: 'source-map',
    mode: 'development',
    optimization : {
        concatenateModules: false,
        minimize: false
    },
    module: {
        rules: [
            {
                test: /\.tsx?$/,
                use: 'ts-loader',
                exclude: /node_modules/
            },
            {
                test: /\.json$/,
                loader: 'json-loader'
            },
            {
                test: /\.tsx?$/i,
                enforce: 'post',
                include: /(src)/,
                exclude: /(node_modules|resources\/js\/vendor)/,
                loader: 'istanbul-instrumenter-loader',
                options: { esModules: true }
            },
            {
                test: /\.less$/,
                use: [
                    {
                        loader: 'style-loader'
                    },
                    {
                        loader: 'css-loader'
                    },
                    {
                        loader: 'less-loader',
                        options: {
                            paths: [path.resolve(__dirname, 'node_modules')]
                        }
                    }
                ]
            }
        ]
    },
    externals: {
        "powerbi-visuals-api": '{}'
    },
    resolve: {
        extensions: ['.tsx', '.ts', '.js', '.css']
    },
    output: {
        path: path.resolve(__dirname, ".tmp/test")
    },
    plugins: [
        new webpack.ProvidePlugin({
            'powerbi-visuals-api': null
        })
    ]
};
Il codice seguente è un esempio del file karma.conf.ts :
"use strict";

const webpackConfig = require("./test.webpack.config.js");
const tsconfig = require("./test.tsconfig.json");
const path = require("path");

const testRecursivePath = "test/visualTest.ts";
const srcOriginalRecursivePath = "src/**/*.ts";
const coverageFolder = "coverage";

process.env.CHROME_BIN = require("puppeteer").executablePath();

import { Config, ConfigOptions } from "karma";

module.exports = (config: Config) => {
    config.set(<ConfigOptions>{
        mode: "development",
        browserNoActivityTimeout: 100000,
        browsers: ["ChromeHeadless"], // or specify Chrome to use the locally installed Chrome browser
        colors: true,
        frameworks: ["jasmine"],
        reporters: [
            "progress",
            "junit",
            "coverage-istanbul"
        ],
        junitReporter: {
            outputDir: path.join(__dirname, coverageFolder),
            outputFile: "TESTS-report.xml",
            useBrowserName: false
        },
        singleRun: true,
        plugins: [
            "karma-coverage",
            "karma-typescript",
            "karma-webpack",
            "karma-jasmine",
            "karma-sourcemap-loader",
            "karma-chrome-launcher",
            "karma-junit-reporter",
            "karma-coverage-istanbul-reporter"
        ],
        files: [
            "node_modules/jquery/dist/jquery.min.js",
            "node_modules/jasmine-jquery/lib/jasmine-jquery.js",
            {
                pattern: './capabilities.json',
                watched: false,
                served: true,
                included: false
            },
            testRecursivePath,
            {
                pattern: srcOriginalRecursivePath,
                included: false,
                served: true
            }
        ],
        preprocessors: {
            [testRecursivePath]: ["webpack", "coverage"]
        },
        typescriptPreprocessor: {
            options: tsconfig.compilerOptions
        },
        coverageIstanbulReporter: {
            reports: ["html", "lcovonly", "text-summary", "cobertura"],
            dir: path.join(__dirname, coverageFolder),
            'report-config': {
                html: {
                    subdir: 'html-report'
                }
            },
            combineBrowserReports: true,
            fixWebpackSourcePaths: true,
            verbose: false
        },
        coverageReporter: {
            dir: path.join(__dirname, coverageFolder),
            reporters: [
                // reporters not supporting the `file` property
                { type: 'html', subdir: 'html-report' },
                { type: 'lcov', subdir: 'lcov' },
                // reporters supporting the `file` property, use `subdir` to directly
                // output them in the `dir` directory
                { type: 'cobertura', subdir: '.', file: 'cobertura-coverage.xml' },
                { type: 'lcovonly', subdir: '.', file: 'report-lcovonly.txt' },
                { type: 'text-summary', subdir: '.', file: 'text-summary.txt' },
            ]
        },
        mime: {
            "text/x-typescript": ["ts", "tsx"]
        },
        webpack: webpackConfig,
        webpackMiddleware: {
            stats: "errors-only"
        }
    });
};
Se necessario, è possibile modificare questa configurazione.
Il codice in karma.conf.js contiene le variabili seguenti:
recursivePathToTests: individua il codice di test.srcRecursivePath: individua il codice JavaScript di output dopo la compilazione.srcCssRecursivePath: individua il css di output dopo aver compilato meno file con stili.srcOriginalRecursivePath: individua il codice sorgente dell'oggetto visivo.coverageFolder: determina la posizione in cui creare il report di copertura.
Il file di configurazione include le proprietà seguenti:
singleRun: true: i test vengono eseguiti in un sistema di integrazione continua (CI) oppure possono essere eseguiti una sola volta. È possibile modificare l'impostazione sufalseper il debug dei test. Il framework Karma mantiene in esecuzione il browser in modo che sia possibile usare la console per il debug.files: [...]: in questa matrice è possibile specificare i file da caricare nel browser. I file caricati sono in genere file di origine, test case e librerie , ad esempio Jasmine o utilità di test. È possibile aggiungere altri file in base alle esigenze.preprocessors: in questa sezione vengono configurate le azioni eseguite prima dell'esecuzione degli unit test. Le azioni possono precompilare TypeScript in JavaScript, preparare i file di mapping di origine e generare un report di code coverage. È possibile disabilitarecoveragequando si esegue il debug dei test.coveragegenera più codice per i test di code coverage, che complica il debug dei test.
Per le descrizioni di tutte le configurazioni karma, passare alla pagina File di configurazione karma.
Per praticità, è possibile aggiungere un comando di test in scripts package.json:
{
    "scripts": {
        "pbiviz": "pbiviz",
        "start": "pbiviz start",
        "typings":"node node_modules/typings/dist/bin.js i",
        "lint": "tslint -r \"node_modules/tslint-microsoft-contrib\"  \"+(src|test)/**/*.ts\"",
        "pretest": "pbiviz package --resources --no-minify --no-pbiviz --no-plugin",
        "test": "karma start"
    }
    ...
}
A questo punto è possibile iniziare a scrivere gli unit test.
Controllare l'elemento DOM dell'oggetto visivo
Per testare l'oggetto visivo, creare prima di tutto un'istanza dell'oggetto visivo.
Creare un generatore di istanze visive
Aggiungere un file visualBuilder.ts alla cartella di test usando il codice seguente:
import { VisualBuilderBase } from "powerbi-visuals-utils-testutils";

import { BarChart as VisualClass } from "../src/barChart";

import powerbi from "powerbi-visuals-api";
import VisualConstructorOptions = powerbi.extensibility.visual.VisualConstructorOptions;

export class BarChartBuilder extends VisualBuilderBase<VisualClass> {
  constructor(width: number, height: number) {
    super(width, height);
  }

  protected build(options: VisualConstructorOptions) {
    return new VisualClass(options);
  }

  public get mainElement() {
    return $(this.element).children("svg.barChart");
  }
}
Il build metodo crea un'istanza dell'oggetto visivo. mainElement è un metodo get, che restituisce un'istanza di un elemento DOM (Document Object Model) radice nell'oggetto visivo. Il getter è facoltativo, ma semplifica la scrittura dello unit test.
È ora disponibile una compilazione di un'istanza dell'oggetto visivo. Scriviamo il test case. Il test case di esempio controlla gli elementi SVG creati quando viene visualizzato l'oggetto visivo.
Creare un file TypeScript per scrivere test case
Aggiungere un file visualTest.ts per i test case usando il codice seguente:
import powerbi from "powerbi-visuals-api";

import { BarChartBuilder } from "./visualBuilder";
import { SampleBarChartDataBuilder } from "./visualData";

import DataView = powerbi.DataView;

describe("BarChart", () => {
  let visualBuilder: BarChartBuilder;
  let dataView: DataView;
  let defaultDataViewBuilder: SampleBarChartDataBuilder;

  beforeEach(() => {
    visualBuilder = new BarChartBuilder(500, 500);
    defaultDataViewBuilder = new SampleBarChartDataBuilder();
    dataView = defaultDataViewBuilder.getDataView();
  });

  it("root DOM element is created", () => {
    visualBuilder.updateRenderTimeout(dataView, () => {
      expect(visualBuilder.mainElement[0]).toBeInDOM();
    });
  });
});
Diversi metodi di Gelsomino sono chiamati:
describe: descrive un test case. Nel contesto del framework Di Jasmine,describespesso descrive una suite o un gruppo di specifiche.beforeEach: viene chiamato prima di ogni chiamata delitmetodo , definito neldescribemetodo .it: definisce una singola specifica. Ilitmetodo deve contenere uno o piùexpectations.expect: crea un'aspettativa per una specifica. Una specifica ha esito positivo se tutte le aspettative passano senza errori.toBeInDOM: è uno dei metodi matcher . Per altre informazioni sui matcher, vedere Namespace: matchers( Namespace: matchers).
Per altre informazioni su Jasmine, vedere la pagina della documentazione del framework di Jasmine.
Avviare unit test
Questo test verifica che l'elemento SVG radice per l'oggetto visivo esista quando viene eseguito l'oggetto visivo. Per eseguire lo unit test, immettere il comando seguente nello strumento da riga di comando:
npm run test
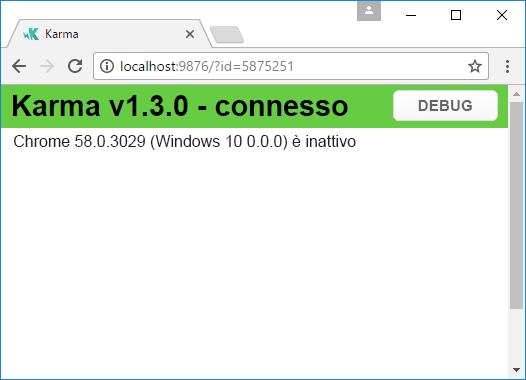
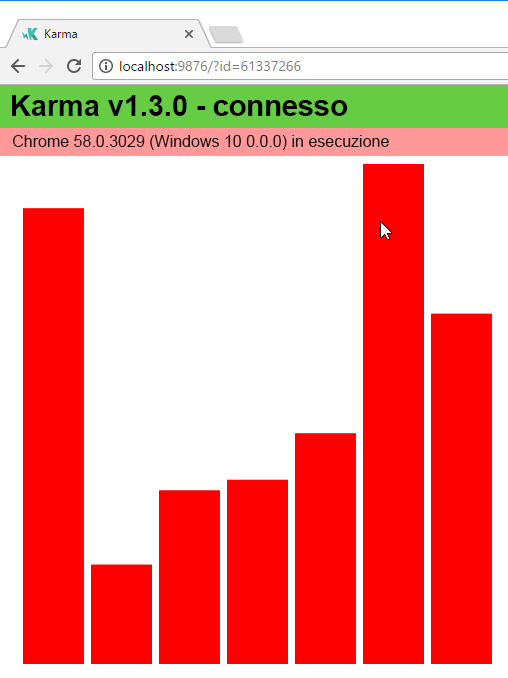
karma.js esegue il test case nel browser Chrome.
Nota
È necessario installare Google Chrome in locale.
Nella finestra della riga di comando si otterrà l'output seguente:
> karma start

23 05 2017 12:24:26.842:WARN [watcher]: Pattern "E:/WORKSPACE/PowerBI/PowerBI-visuals-sampleBarChart/data/*.csv" does not match any file.
23 05 2017 12:24:30.836:WARN [karma]: No captured browser, open https://localhost:9876/
23 05 2017 12:24:30.849:INFO [karma]: Karma v1.3.0 server started at https://localhost:9876/
23 05 2017 12:24:30.850:INFO [launcher]: Launching browser Chrome with unlimited concurrency
23 05 2017 12:24:31.059:INFO [launcher]: Starting browser Chrome
23 05 2017 12:24:33.160:INFO [Chrome 58.0.3029 (Windows 10 0.0.0)]: Connected on socket /#2meR6hjXFmsE_fjiAAAA with id 5875251
Chrome 58.0.3029 (Windows 10 0.0.0): Executed 1 of 1 SUCCESS (0.194 secs / 0.011 secs)

=============================== Coverage summary ===============================
Statements   : 27.43% ( 65/237 )
Branches     : 19.84% ( 25/126 )
Functions    : 43.86% ( 25/57 )
Lines        : 20.85% ( 44/211 )
================================================================================
Come aggiungere dati statici per unit test
Creare il file visualData.ts nella cartella di test usando il codice seguente:
import powerbi from "powerbi-visuals-api";
import DataView = powerbi.DataView;

import { testDataViewBuilder } from "powerbi-visuals-utils-testutils";

import TestDataViewBuilder = testDataViewBuilder.TestDataViewBuilder;

export class SampleBarChartDataBuilder extends TestDataViewBuilder {
  public static CategoryColumn: string = "category";
  public static MeasureColumn: string = "measure";

  public getDataView(columnNames?: string[]): DataView {
    let dateView: any = this.createCategoricalDataViewBuilder(
      [
          ...
      ],
      [
          ...
      ],
      columnNames
    ).build();

    // there's client side computed maxValue
    let maxLocal = 0;
    this.valuesMeasure.forEach((item) => {
      if (item > maxLocal) {
        maxLocal = item;
      }
    });
    (<any>dataView).categorical.values[0].maxLocal = maxLocal;

    return dataView;
  }
}
La SampleBarChartDataBuilder classe estende TestDataViewBuilder e implementa il metodo getDataViewastratto .
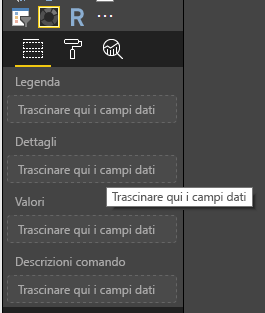
Quando si inserisce dati in bucket di campi dati, Power BI genera un oggetto categorico dataview basato sui dati.
Negli unit test non è possibile accedere alle funzioni di base di Power BI usate normalmente per riprodurre i dati. È tuttavia necessario eseguire il mapping dei dati statici all'oggetto categorico dataview. Usare la classe per eseguire il TestDataViewBuilder mapping dei dati statici.
Per altre informazioni sul mapping delle viste dati, vedere DataViewMappings.
getDataView Nel metodo chiamare il createCategoricalDataViewBuilder metodo con i dati.
sampleBarChart Nel file visual capabilities.json sono disponibili dataRoles oggetti e dataViewMapping :
"dataRoles": [
    {
        "displayName": "Category Data",
        "name": "category",
        "kind": "Grouping"
    },
    {
        "displayName": "Measure Data",
        "name": "measure",
        "kind": "Measure"
    }
],
"dataViewMappings": [
    {
        "conditions": [
            {
                "category": {
                    "max": 1
                },
                "measure": {
                    "max": 1
                }
            }
        ],
        "categorical": {
            "categories": {
                "for": {
                    "in": "category"
                }
            },
            "values": {
                "select": [
                    {
                        "bind": {
                            "to": "measure"
                        }
                    }
                ]
            }
        }
    }
],
Per generare lo stesso mapping, è necessario impostare i parametri seguenti sul createCategoricalDataViewBuilder metodo :
([
    {
        source: {
            displayName: "Category",
            queryName: SampleBarChartDataBuilder.CategoryColumn,
            type: ValueType.fromDescriptor({ text: true }),
            roles: {
                Category: true
            },
        },
        values: this.valuesCategory
    }
],
[
    {
        source: {
            displayName: "Measure",
            isMeasure: true,
            queryName: SampleBarChartDataBuilder.MeasureColumn,
            type: ValueType.fromDescriptor({ numeric: true }),
            roles: {
                Measure: true
            },
        },
        values: this.valuesMeasure
    },
], columnNames)
Dove this.valuesCategory è una matrice di categorie:
public valuesCategory: string[] = ["Monday", "Tuesday", "Wednesday", "Thursday", "Friday", "Saturday", "Sunday"];
Ed this.valuesMeasure è una matrice di misure per ogni categoria:
public valuesMeasure: number[] = [742731.43, 162066.43, 283085.78, 300263.49, 376074.57, 814724.34, 570921.34];
La versione finale di visualData.ts contiene il codice seguente:
import powerbi from "powerbi-visuals-api";
import DataView = powerbi.DataView;

import { testDataViewBuilder } from "powerbi-visuals-utils-testutils";
import { valueType } from "powerbi-visuals-utils-typeutils";
import ValueType = valueType.ValueType;

import TestDataViewBuilder = testDataViewBuilder.TestDataViewBuilder;

export class SampleBarChartDataBuilder extends TestDataViewBuilder {
  public static CategoryColumn: string = "category";
  public static MeasureColumn: string = "measure";
  public valuesCategory: string[] = [
    "Monday",
    "Tuesday",
    "Wednesday",
    "Thursday",
    "Friday",
    "Saturday",
    "Sunday",
  ];
  public valuesMeasure: number[] = [
    742731.43, 162066.43, 283085.78, 300263.49, 376074.57, 814724.34, 570921.34,
  ];

  public getDataView(columnNames?: string[]): DataView {
    let dataView: any = this.createCategoricalDataViewBuilder(
      [
        {
          source: {
            displayName: "Category",
            queryName: SampleBarChartDataBuilder.CategoryColumn,
            type: ValueType.fromDescriptor({ text: true }),
            roles: {
              category: true,
            },
          },
          values: this.valuesCategory,
        },
      ],
      [
        {
          source: {
            displayName: "Measure",
            isMeasure: true,
            queryName: SampleBarChartDataBuilder.MeasureColumn,
            type: ValueType.fromDescriptor({ numeric: true }),
            roles: {
              measure: true,
            },
          },
          values: this.valuesMeasure,
        },
      ],
      columnNames
    ).build();

    // there's client side computed maxValue
    let maxLocal = 0;
    this.valuesMeasure.forEach((item) => {
      if (item > maxLocal) {
        maxLocal = item;
      }
    });
    (<any>dataView).categorical.values[0].maxLocal = maxLocal;

    return dataView;
  }
}
È ora possibile usare la SampleBarChartDataBuilder classe nello unit test.
La ValueType classe è definita nel pacchetto powerbi-visuals-utils-testutils.
Aggiungere il pacchetto powerbi-visuals-utils-testutils alle dipendenze. package.json Nel file individuare la dependencies sezione e aggiungere il codice seguente:
"powerbi-visuals-utils-testutils": "^2.4.1",
Chiama
npm install
per installare il powerbi-visuals-utils-testutils pacchetto.
È ora possibile eseguire di nuovo lo unit test. È necessario ottenere l'output seguente:
> karma start

23 05 2017 16:19:54.318:WARN [watcher]: Pattern "E:/WORKSPACE/PowerBI/PowerBI-visuals-sampleBarChart/data/*.csv" does not match any file.
23 05 2017 16:19:58.333:WARN [karma]: No captured browser, open https://localhost:9876/
23 05 2017 16:19:58.346:INFO [karma]: Karma v1.3.0 server started at https://localhost:9876/
23 05 2017 16:19:58.346:INFO [launcher]: Launching browser Chrome with unlimited concurrency
23 05 2017 16:19:58.394:INFO [launcher]: Starting browser Chrome
23 05 2017 16:19:59.873:INFO [Chrome 58.0.3029 (Windows 10 0.0.0)]: Connected on socket /#NcNTAGH9hWfGMCuEAAAA with id 3551106
Chrome 58.0.3029 (Windows 10 0.0.0): Executed 1 of 1 SUCCESS (1.266 secs / 1.052 secs)

=============================== Coverage summary ===============================
Statements   : 56.72% ( 135/238 )
Branches     : 32.54% ( 41/126 )
Functions    : 66.67% ( 38/57 )
Lines        : 52.83% ( 112/212 )
================================================================================
Il riepilogo mostra che la copertura è aumentata. Per altre informazioni sul code coverage corrente, aprire il coverage/html-report/index.html file.
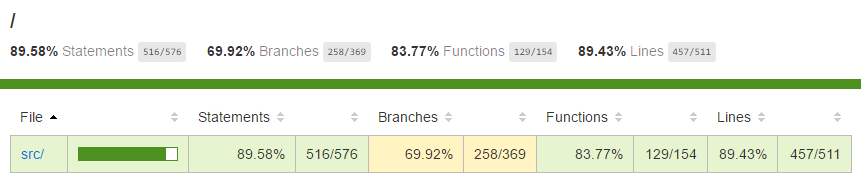
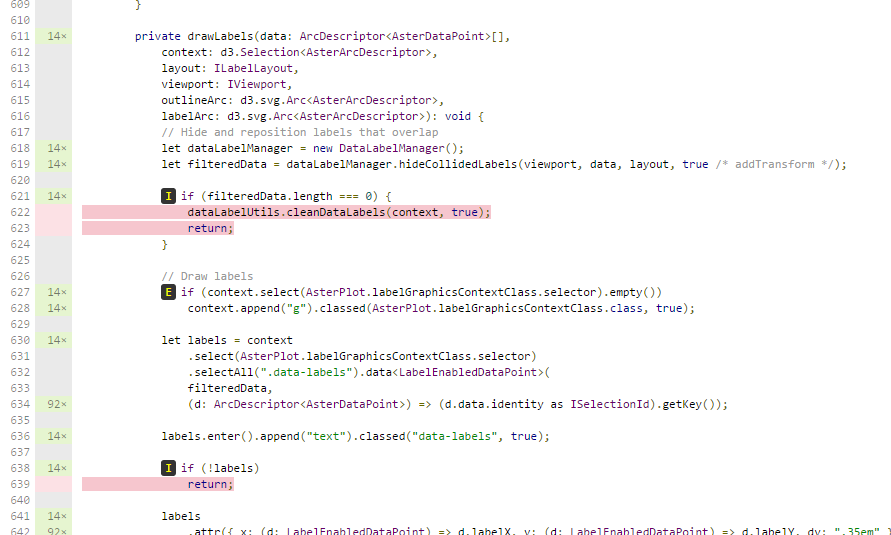
In alternativa, esaminare l'ambito della src cartella:
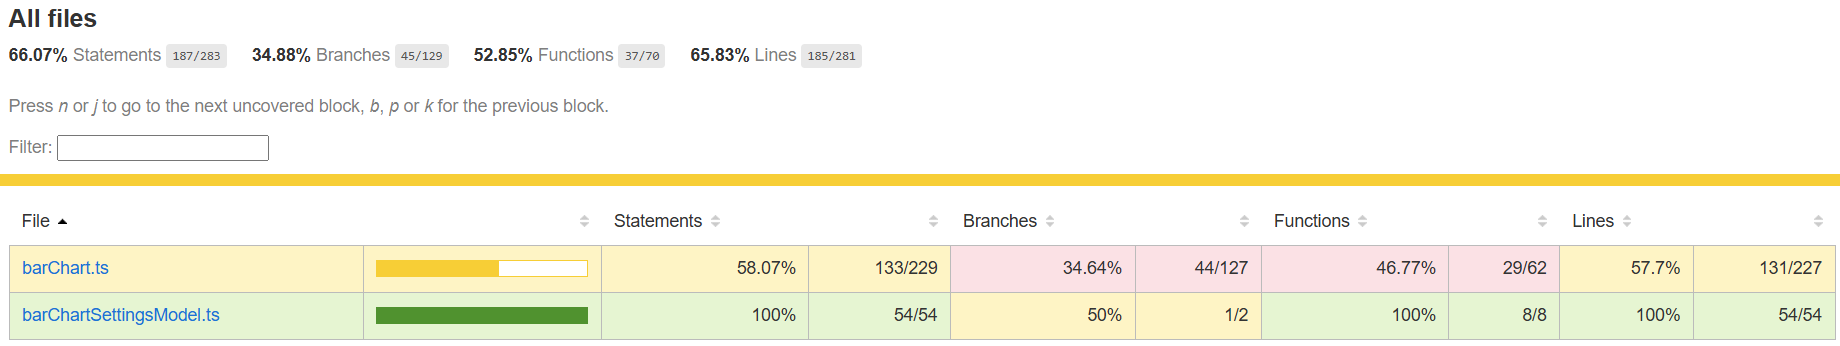
Nell'ambito del file è possibile visualizzare il codice sorgente. Le coverage utilità evidenziano la riga in rosso se alcune righe di codice non vengono eseguite durante gli unit test.
Importante
Il code coverage non significa che si abbia una buona copertura delle funzionalità dell'oggetto visivo. Uno unit test semplice offre una copertura superiore al 96% in src/barChart.ts.
Debug
Per eseguire il debug dei test tramite la console del browser, modificare il singleRun valore in karma.conf.ts in false. Questa impostazione manterrà il browser in esecuzione all'avvio del browser dopo l'esecuzione dei test.
L'oggetto visivo viene aperto nel browser Chrome.
Contenuto correlato
Quando l'oggetto visivo è pronto, è possibile inviarlo per la pubblicazione. Per altre informazioni, vedere Pubblicare oggetti visivi di Power BI in AppSource.