Esercizio - Identificare i computer con utilizzo elevato della CPU
In questo caso si scriveranno query KQL per recuperare e trasformare i dati dalla tabellaPerf per comprendere quali computer hanno raggiunto o stanno per raggiungere la capacità di calcolo totale e quali computer sono sottoutilizzati.
1. Impostare gli obiettivi
Per risolvere i problemi di prestazioni, attenuare i potenziali problemi e identificare le opportunità di operare in modo più efficiente, è necessario analizzare l'utilizzo dell'unità di elaborazione centrale (CPU) delle macchine virtuali nell'ambiente IT.
Per identificare i problemi di prestazioni correlati alla CPU e le opportunità per diventare più efficienti, sono necessarie informazioni su:
- Tendenze di utilizzo della CPU di ogni computer attivo.
- Utilizzo della CPU dei computer in momenti di picco e inattività.
2. Valutare i registri
Gli agenti Windows e Linux inviano contatori delle prestazioni di componenti hardware, sistemi operativi e applicazioni in esecuzione nei computer monitorati alla tabella Perf in Monitoraggio di Azure.
Eseguire una semplice query sulla tabella Perf per recuperare i log dalle ultime 24 ore e ottenere un'idea dello schema della tabella e dei dati contenuti nella tabella:
Fare clic per eseguire la query nell'ambiente demo di analisi dei log
Perf  // The table you’re querying
| where TimeGenerated > ago(1d) // Filters for entries generated in the past day

È possibile notare che le colonne TimeGenerated, Computer, ObjectName, CounterName, InstanceName, e CounterValue contengono dati rilevanti per l'analisi.
La colonna ObjectName elenca i nomi di tutti gli oggetti per cui Monitoraggio di Azure raccoglie i dati dai computer monitorati. La colonna CounterName contiene i nomi dei vari contatori delle prestazioni raccolti da Monitoraggio di Azure. Entrambe queste colonne contengono molti valori, molti dei quali compaiono più volte. Per visualizzare chiaramente i valori distinti in queste colonne e determinare quali contatori sono rilevanti per l'analisi corrente, eseguire questa query:
Fai clic per eseguire la query nell'ambiente demo di analisi dei log
Perf // The table you’re querying
| distinct ObjectName,CounterName // Lists distinct combinations of ObjectName and CounterName values
Questo screenshot mostra le combinazioni distinte di valori ObjectName e CounterName nella colonna CounterName nelle ultime 24 ore:

Il contatore % Processor Time fornisce una comprensione dell'utilizzo del processore o dell'unità di elaborazione centrale (CPU). Queste sono le informazioni necessarie!
Valutiamo ora come possiamo usare questi dati e quali operazioni KQL consentono di estrarre e trasformare i dati:
| Colonna | Descrizione | Obiettivo di analisi | Operazioni KQL correlate |
|---|---|---|---|
TimeGenerated |
Indica quando la macchina virtuale ha generato ogni log. | Definisci l'ambito temporale dell'analisi. | where TimeGenerated > ago(1d) Per ulteriori informazioni, vedi ago(), dove operatori e Operatori numerici. |
Computer |
Computer da cui è stato raccolto l'evento. | Associa l'utilizzo della CPU a un computer specifico. | summarize... by Computer Per ulteriori informazioni, vedi Operatore di riepilogo. |
ObjectName |
Contiene i nomi di tutti gli oggetti per cui la tabella contiene dati sulle prestazioni. | Monitorare le prestazioni del processore. | where ObjectName == "Processor" Per altre informazioni, vedere == (uguali) operatore. |
CounterName |
Contiene i nomi di tutti i contatori delle prestazioni nella tabella. | Monitorare il contatore delle prestazioni % Processor Time . |
where CounterName == "% Processor Time" Per ulteriori informazioni, vedi dove l'operatore e == (uguali) l'operatore. |
InstanceName |
Elenca le istanze monitorate dell'oggetto monitorato. | Monitorare tutti i core del processore. | where InstanceName == "_Total" Per ulteriori informazioni, vedere dove l'operatore e == (uguali) operatore. |
CounterValue |
La misura raccolta per il contatore. | Recuperare le misurazioni delle prestazioni per il contatore delle prestazioni % Processor Time. |
summarize min(CounterValue), avg(CounterValue), max(CounterValue), percentiles(CounterValue, 90,99) Per altre informazioni, vedere l'operatore di riepilogo e le funzioni di aggregazione min(), max(), media()e percentili(). |
3. Scrivi la tua query
Scrivere una query che riepiloga l'utilizzo medio, minimo e massimo della CPU di tutti i computer nell'ultimo giorno.
Recuperare tutti i log generati nell'ultimo giorno che hanno segnalato il contatore delle prestazioni
% Processor Time:Fare clic per eseguire la query nell'ambiente demo di analisi dei log.
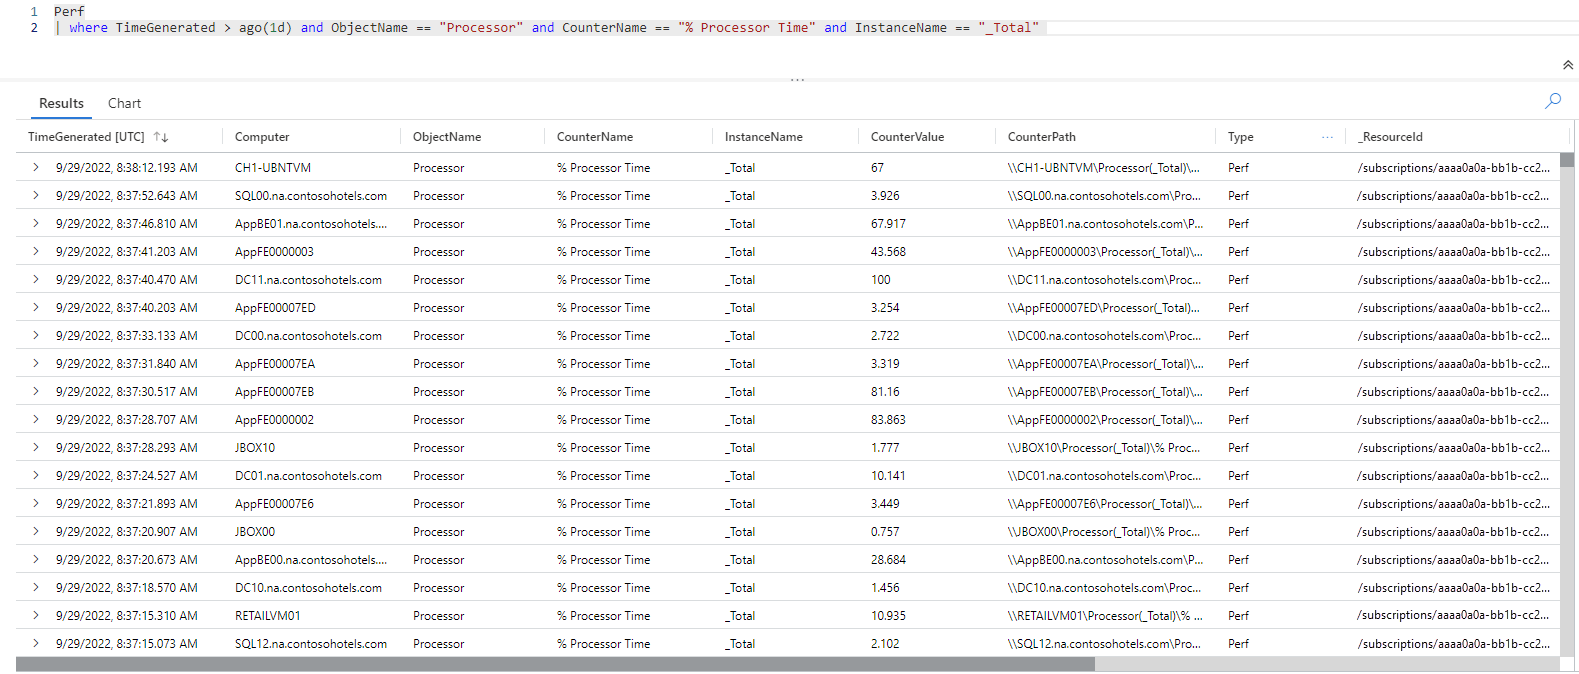
Perf  // The table you’re querying
| where TimeGenerated > ago(1d) and ObjectName == "Processor" and CounterName == "% Processor Time" and InstanceName == "_Total" // Filters for entries generated in the past day related to total processor time measurements
Questa query recupera tutti i log correlati alle misurazioni totali del tempo del processore dall'ultimo giorno.
Trovare i valori minimi, massimi e medi dei contatori e calcolare i valori del contatore del 90° e del 99° percentile per ogni computer:
Fare clic per eseguire la query nell'ambiente demo di analisi dei log
Perf  // The table you’re querying
| where TimeGenerated > ago(1d) and ObjectName == "Processor" and CounterName == "% Processor Time" and InstanceName == "_Total" // Filters for entries generated in the past day related to total processor time measurements
| summarize min(CounterValue), avg(CounterValue), max(CounterValue), percentiles(CounterValue, 90,99) by Computer // Presents the minimum, maximum, average, 90th and 99th percentile counter values for each computer
Il set di risultati di questa query mostra i valori del contatore minimo, massimo, medio, 90° e 99° percentile
% Processor Timeper ogni computer per cui sono presenti dati nell'area di lavoro Log Analytics.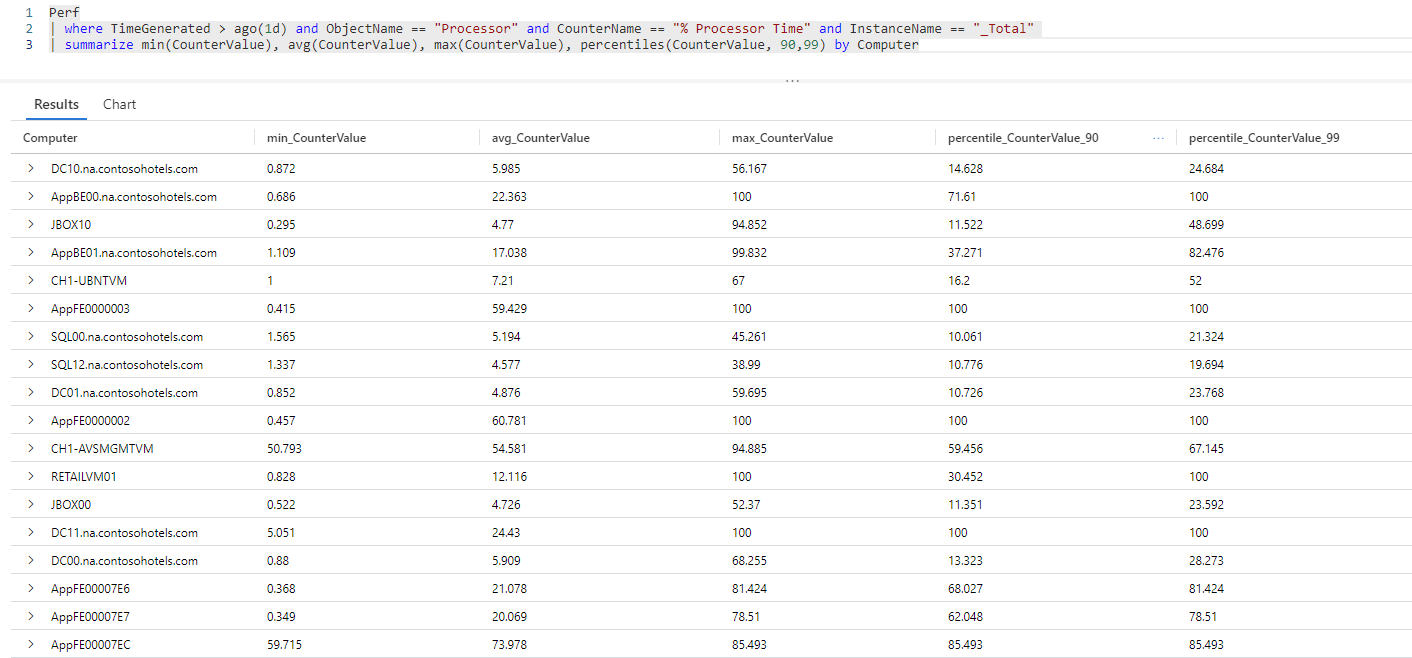
Filtrare i risultati della query per le voci in cui il valore del contatore
% Processor Timeè maggiore di 80 nell'intervallo del 90° e del 99° percentile:Fare clic per eseguire la query nell'ambiente demo di analisi dei log
Perf  // The table you’re querying
| where TimeGenerated > ago(1d) and ObjectName == "Processor" and CounterName == "% Processor Time" and InstanceName == "_Total" // Filters for entries generated in the past day related to total processor time measurements
| summarize min(CounterValue), avg(CounterValue), max(CounterValue), percentiles(CounterValue, 90,99) by Computer // Presents the minimum, maximum, average, 90th and 99th percentile counter values for each computer
| where percentile_CounterValue_90 > 80 and percentile_CounterValue_99 > 80 // Filters previous query results for instances where the 90th and 99th percentile counters are higher than 80
Il set di risultati di questa query è costituito da tutti i computer per i quali i primi valori del 10% e del 15%
% Processor Timesono superiori a 80.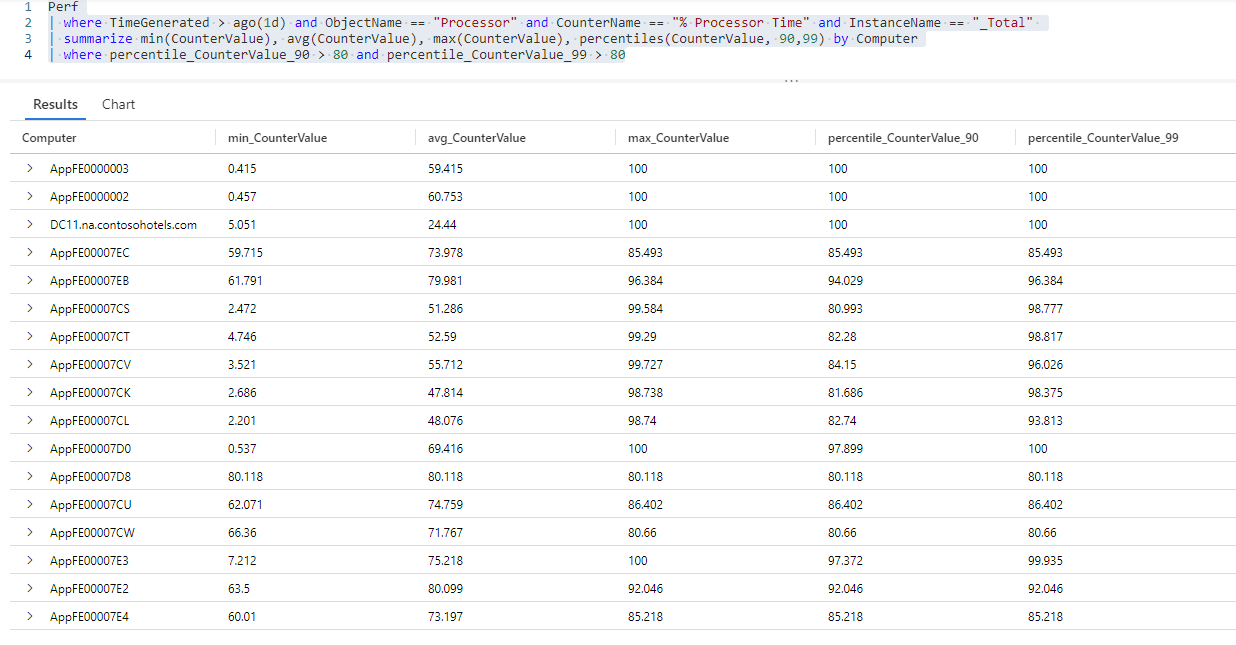


Richiesta: aggiungere informazioni sul sistema operativo dalla tabella Heartbeat ai risultati della query
È spesso possibile ottenere una migliore comprensione dei risultati della query correlando le informazioni da una tabella diversa ai risultati della query usando l'operatore join. Per altre informazioni, vedere operatore di join.
È possibile usare l'operatore join per aggiungere informazioni sul sistema operativo in esecuzione in ogni computer, disponibile nella tabella Heartbeat, come illustrato nel primo esercizio?
Soluzione:
Aggiungere informazioni dalla tabella
Heartbeatsul sistema operativo in esecuzione in ogni computer nei risultati della query:Fare clic per eseguire la query nell'ambiente demo di analisi dei log
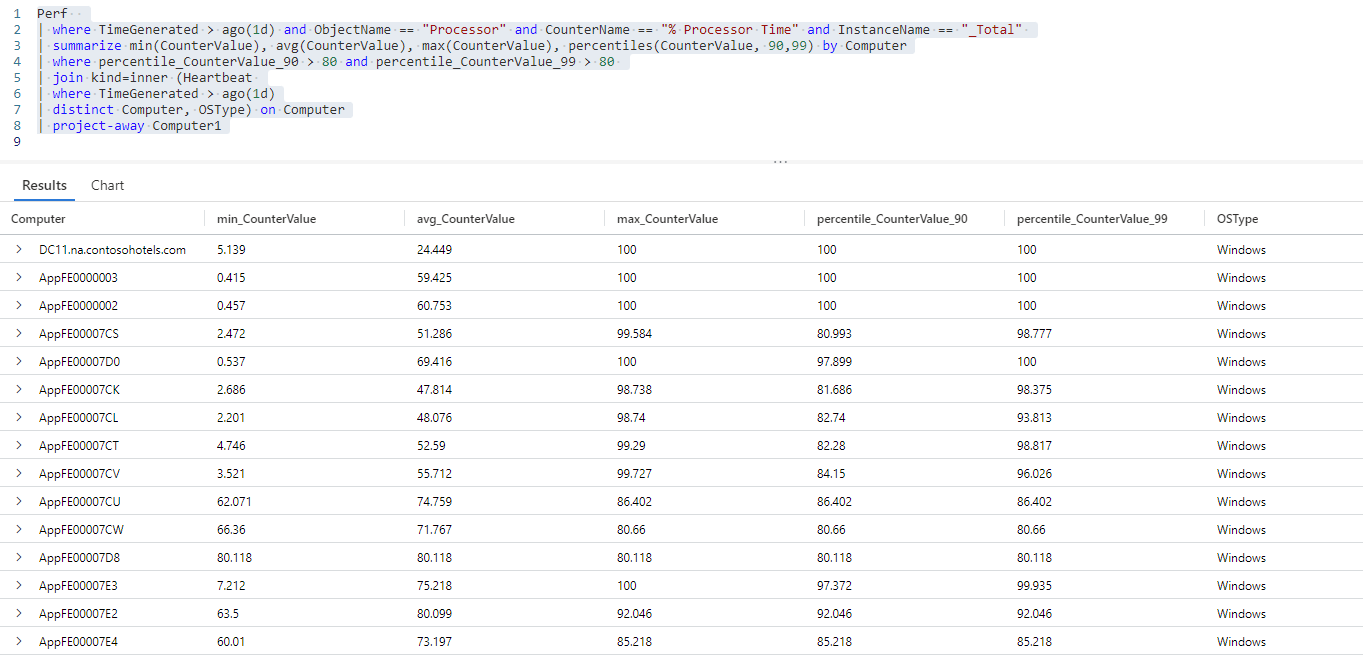
Perf  // The table you’re querying
| where TimeGenerated > ago(1d) and ObjectName == "Processor" and CounterName == "% Processor Time" and InstanceName == "_Total" // Filters for entries generated in the past day related to total processor time measurements
| summarize min(CounterValue), avg(CounterValue), max(CounterValue), percentiles(CounterValue, 90,99) by Computer // Presents the minimum, maximum, average, 90th and 99th percentile counter values for each computer
| where percentile_CounterValue_90 > 80 and percentile_CounterValue_99 > 80 // Filters previous query results for instances where the 90th and 99th percentile counters are higher than 50
| join kind=inner (Heartbeat // Introduces data from the "Heartbeat" table to the previous query results
| where TimeGenerated > ago(1d) // Time range for the data added from the "Heartbeat" table
| distinct Computer, OSType) on Computer // Adds distinct combinations of computer and operating system
Questa iterazione della query aggiunge le colonne
ComputereOSTypedalla tabellaHeartbeatai risultati della query precedenti.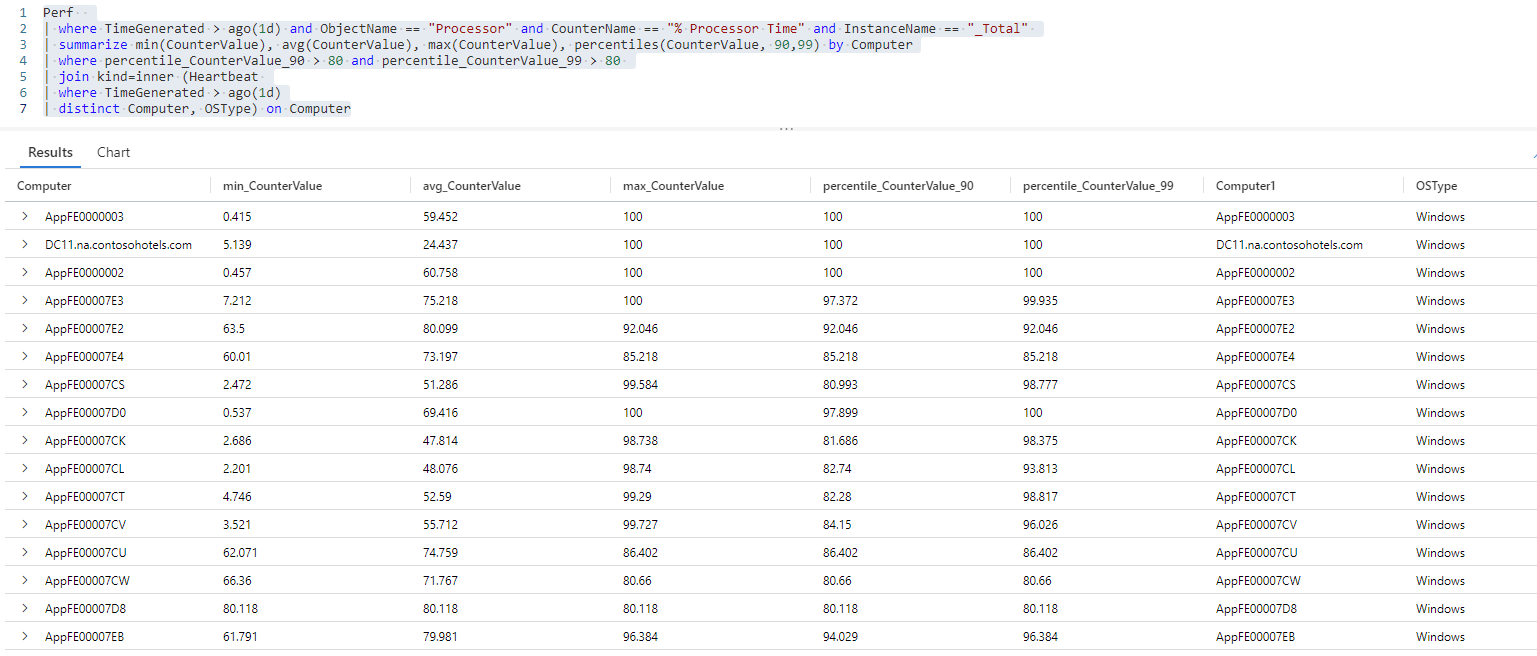
La colonna
Computerviene ora visualizzata due volte nei risultati della query, una volta dalla query nella tabellaPerfe una dalla query nella tabellaHeartbeat. La colonnaComputerdella tabellaHeartbeatè stata rinominataComputer1, ma le due tabelle contengono dati identici. La presenza di entrambe le colonne consente di correlare i risultati delle due tabelle, ma è ora possibile filtrare la colonna duplicata.Rimuovere la colonna
Computer1dai risultati della query:Fare clic per eseguire la query nell'ambiente demo di analisi dei log
Perf  // The table you’re querying
| where TimeGenerated > ago(1d) and ObjectName == "Processor" and CounterName == "% Processor Time" and InstanceName == "_Total" // Filters for entries generated in the past day related to total processor time measurements
| summarize min(CounterValue), avg(CounterValue), max(CounterValue), percentiles(CounterValue, 90,99) by Computer // Presents the minimum, maximum, average, 90th and 99th percentile counter values for each computer
| where percentile_CounterValue_90 > 80 and percentile_CounterValue_99 > 80 // Filters previous query results for instances where the 90th and 99th percentile counters are higher than 50
| join kind=inner (Heartbeat // Introduces data from the "Heartbeat" table to the previous query results
| where TimeGenerated > ago(1d) // Time range for the data added from the "Heartbeat" table
| distinct Computer, OSType) on Computer // Adds distinct combinations of computer and operating system
| project-away Computer1 // Removes the "Computer1" column from the query results
Il set di risultati di questa query elenca tutti i computer che hanno raggiunto la capacità di CPU completa e il sistema operativo in esecuzione in ogni computer, che sarà utile per un'ulteriore analisi.