DevTools in the Windows 10 April 2018 update (EdgeHTML 17)
The EdgeHTML 17 release of the DevTools ships in two ways: as the traditional in-browser (F12) tools for Microsoft Edge, and previewing as a standalone Windows 10 app from the Microsoft Store!
The tools have been updated with a number of major features, including basic support for remote debugging (via our new DevTools Protocol), PWA debugging features, IndexedDB cache management, vertical docking and more! We also continued the overall refactoring effort started last release as part of ongoing investments in performance and reliability.
Here are the latest Microsoft Edge DevTools features that shipped in the Windows 10 April 2018 Update (EdgeHTML 17).
Microsoft Edge DevTools app preview
The Microsoft Edge DevTools are now available for preview as a standalone Windows 10 app from the Microsoft Store. With the store version comes a chooser panel for attaching to open local and remote page targets and a tabbed layout for easy switching between DevTools instances. Also exclusive to the DevTools app is the ability to debug web content in apps (such as add-ins for Office, Cortana, EdgeHTML webview, and Windows-installed PWAs).
The Edge DevTools are also still available (F12) from within the browser (without the chooser panel).
Decoupling the DevTools from the browser provides these UX and architectural advantages:
- The DevTools run in a separate app container sandbox from Microsoft Edge, providing better reliability for both.
- The app provides easy switching between active DevTools instance tabs (rather than having to switch between open Microsoft Edge tabs)
- We're able to instrument the EdgeHTML browser engine and open it to the larger devtools ecosystem with cross-browser APIs.
- We can ship DevTools updates independently from the Windows (and EdgeHTML) release cycle.
Check out the DevTools guide for more on local and remote debugging using the DevTools app.
DevTools Protocol
Developer tools can use the Microsoft Edge DevTools Protocol to inspect and debug the Microsoft Edge browser. It provides a set of methods and events that are organized into different Domains of EdgeHTML engine instrumentation.
Tooling clients can call these methods and monitor these events through JSON web socket messages exchanged with the DevTools Server hosted by Microsoft Edge or the Windows Device Portal.
Microsoft Edge DevTools uses this protocol to enable remote debugging of a host machine running Microsoft Edge from the standalone DevTools client available from the Microsoft Store. Currently this preview support is limited to JS debugging of another Edge on another desktop device or VM. Over time, we'll add support for the full set of DevTools against any EdgeHTML instance on any Windows 10 device.
The latest Visual Studio Preview builds (Visual Studio 15.7 Preview 1 or later) use the DevTools Protocol to enable launching and debugging Microsoft Edge (JavaScript code) from within the Visual Studio IDE of any ASP.NET or .NET Core project.
IndexedDB inspection
New to the Debugger this release is an IndexedDB Manager with support for inspecting and refreshing your object stores and deleting individual key-value entries. Expect even more functionality in future releases.
PWA debugging
Support for debugging Progressive Web Apps (PWAs) is now enabled by default, providing tool tabs for Service Workers, Cache API, and IndexedDB management.
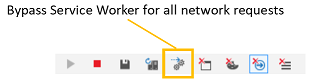
Additionally, the Network panel toolbar has a new button, Bypass Service Worker for all network requests, to toggle on/off your registered service workers as network proxies:
You can debug your PWA as an installed Windows 10 app by selecting it from the list of Local targets (browser tab/PWA/webview) in the chooser of the standalone DevTools app.
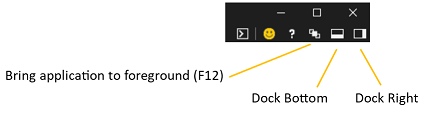
Docking to the right in Microsoft Edge
You can now dock the DevTools to the right of the page you're debugging from within Microsoft Edge, in addition to docking at the bottom and undocking the DevTools from the browser window. Use Ctrl+Shift+D to cycle between the Dock Bottom, Dock Right, and Undock positions, or the icons in the top-right corner of the DevTools: