この記事では、データ ソースからのポイント データをマップ上のバブル レイヤーにレンダリングする方法について説明します。 バブル レイヤーは、固定ピクセル半径を持つ円としてポイントをマップ上にレンダリングするものです。
ヒント
バブル レイヤーの既定では、データ ソース内のすべてのジオメトリの座標がレンダリングされます。 ポイント ジオメトリ フィーチャーのみがレンダリングされるようにレイヤーを制限するには、レイヤーの filter プロパティを ['==', ['geometry-type'], 'Point'] に設定します。または、MultiPoint フィーチャーも含める場合は、['any', ['==', ['geometry-type'], 'Point'], ['==', ['geometry-type'], 'MultiPoint']] に設定します。
バブル レイヤーを追加する
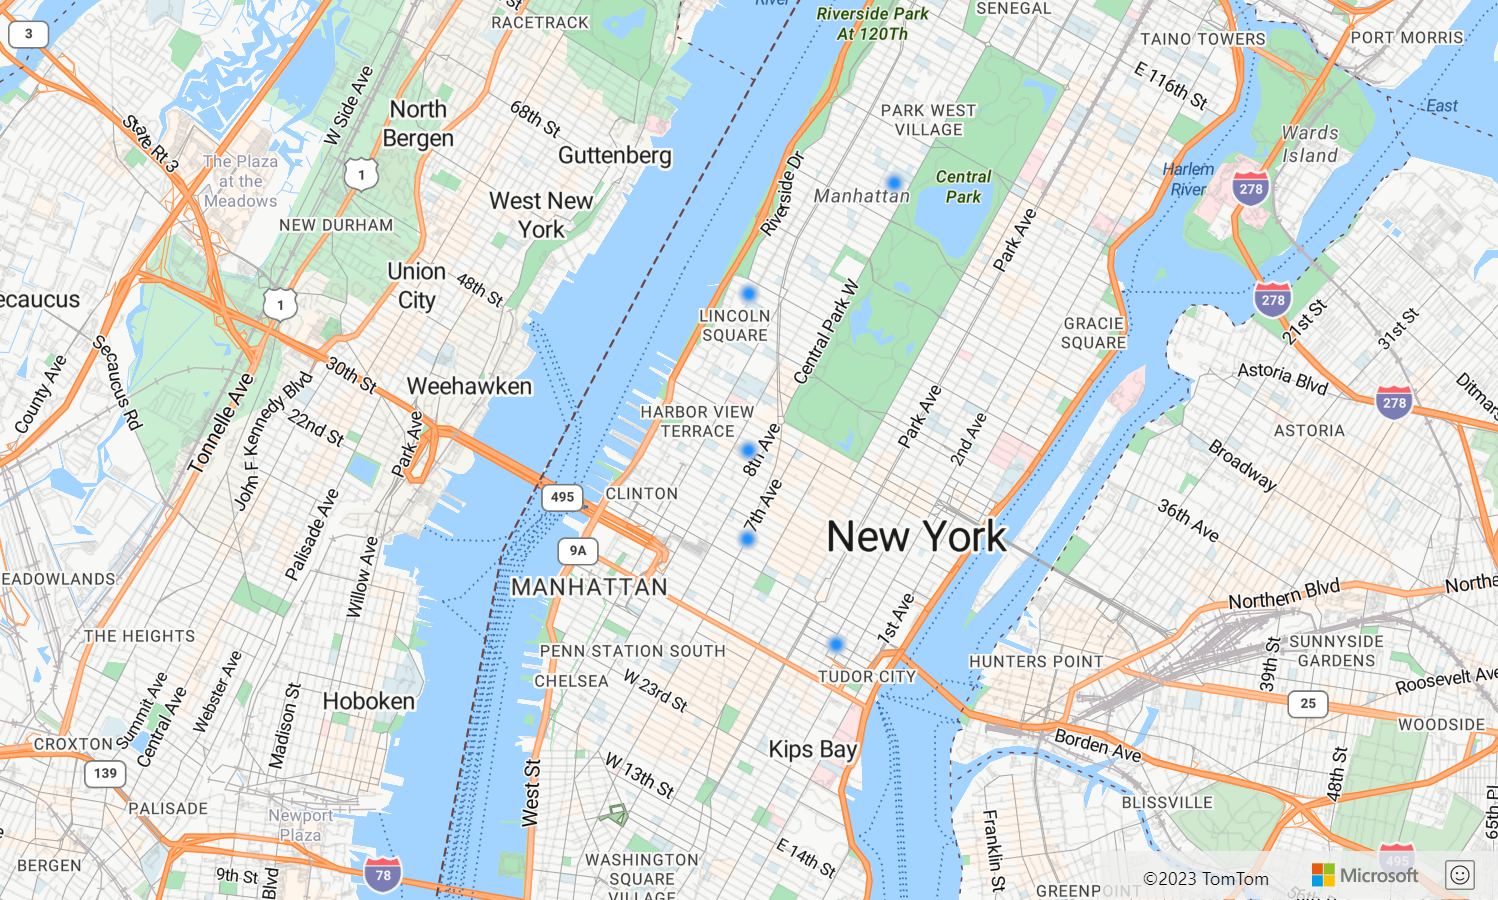
次のコードでは、ポイントの配列がデータ ソースに読み込まれます。 次に、データ ポイントがバブル レイヤーに接続されます。 バブル レイヤーは、半径が 6 ピクセル、ストローク幅が 3 ピクセルの各バブルをレンダリングします。
/*Ensure that the map is fully loaded*/
map.events.add("load", function () {

  /*Add point locations*/
  var points = [
    new atlas.data.Point([-73.985708, 40.75773]),
    new atlas.data.Point([-73.985600, 40.76542]),
    new atlas.data.Point([-73.985550, 40.77900]),
    new atlas.data.Point([-73.975550, 40.74859]),
    new atlas.data.Point([-73.968900, 40.78859])]

  /*Create a data source and add it to the map*/
  var dataSource = new atlas.source.DataSource();
  map.sources.add(dataSource);
  /*Add the points to the data source*/
  dataSource.add(points);

  //Create a bubble layer to render the filled in area of the circle, and add it to the map.*/
  map.layers.add(new atlas.layer.BubbleLayer(dataSource, null, {
    radius: 6,
    strokeColor: "LightSteelBlue",
    strokeWidth: 3,
    color: "DodgerBlue",
    blur: 0.5
  }));
});
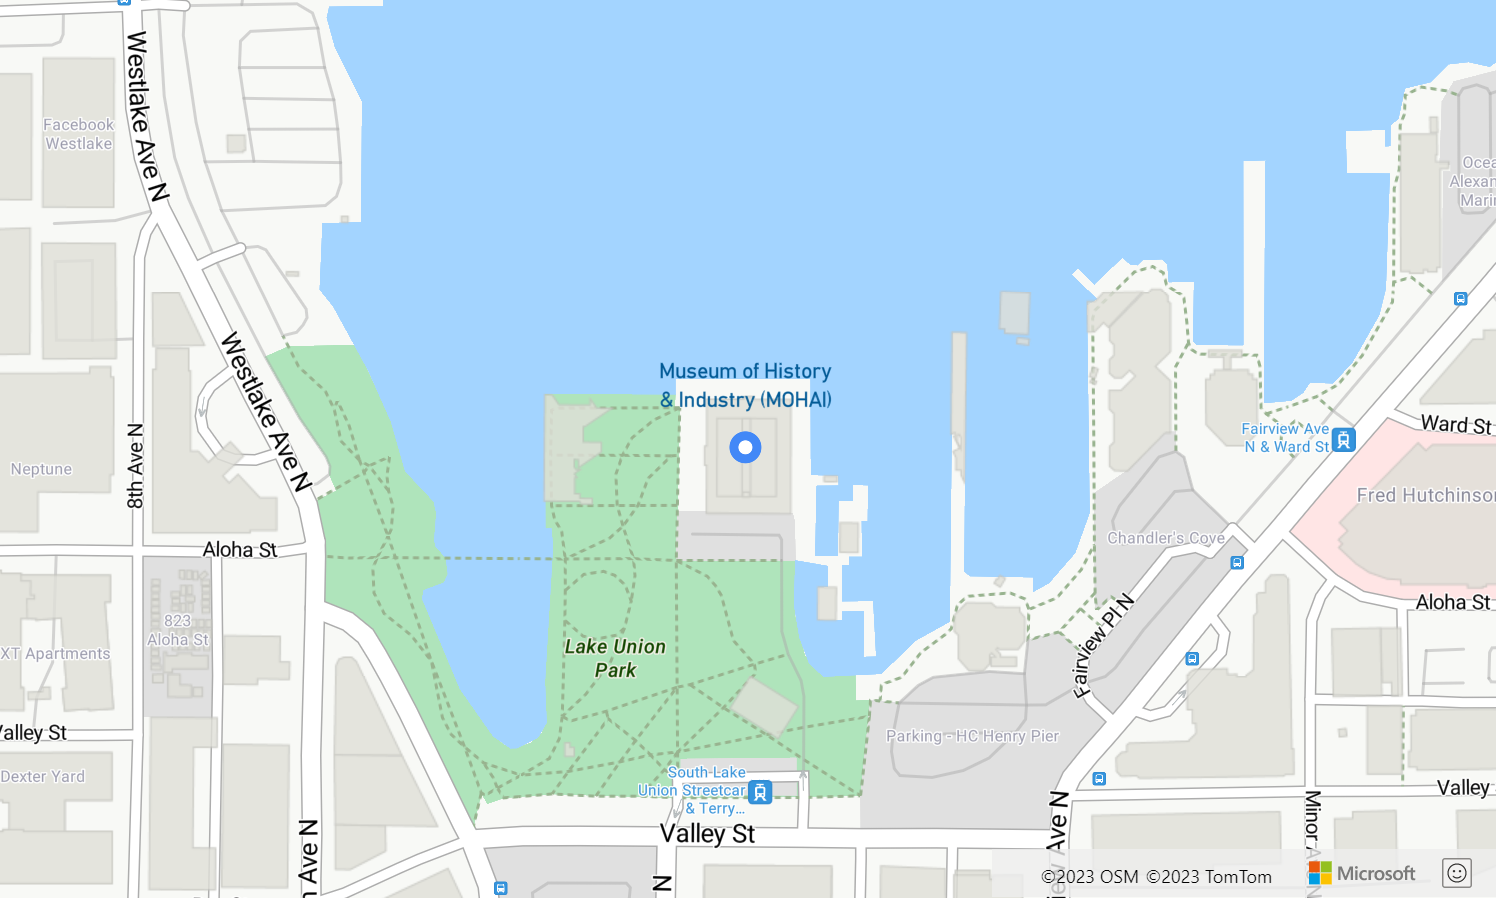
バブル レイヤーでラベルを表示する
このコードでは、バブル レイヤーを使用してマップ上にポイントをレンダリングする方法と、シンボル レイヤーを使用してラベルをレンダリングする方法を示しています。 シンボル レイヤーのアイコンを非表示にするには、アイコン オプションの image プロパティを none に設定します。
//Create an instance of the map control and set some options.
 function InitMap() {

    var map = new atlas.Map('myMap', {
    center: [-122.336641, 47.627631],
    zoom: 16,
    view: "Auto",
        authOptions: {
            authType: 'subscriptionKey',
            subscriptionKey: '{Your-Azure-Maps-Subscription-key}'
        }
    });

    /*Ensure that the map is fully loaded*/
    map.events.add("load", function () {

        /*Create point object*/
        var point =  new atlas.data.Point([-122.336641,47.627631]);

        /*Create a data source and add it to the map*/
        var dataSource = new atlas.source.DataSource();
        map.sources.add(dataSource);
        dataSource.add(point);

        map.layers.add(new atlas.layer.BubbleLayer(dataSource, null, {
            radius: 5,
            strokeColor: "#4288f7",
            strokeWidth: 6,
            color: "white"
        }));

        //Add a layer for rendering point data.
        map.layers.add(new atlas.layer.SymbolLayer(dataSource, null, {
            iconOptions: {
                //Hide the icon image.
                image: "none"
            },

            textOptions: {
                textField: "Museum of History & Industry (MOHAI)",
                color: "#005995",
                offset: [0, -2.2]
            },
        }));
    });
}
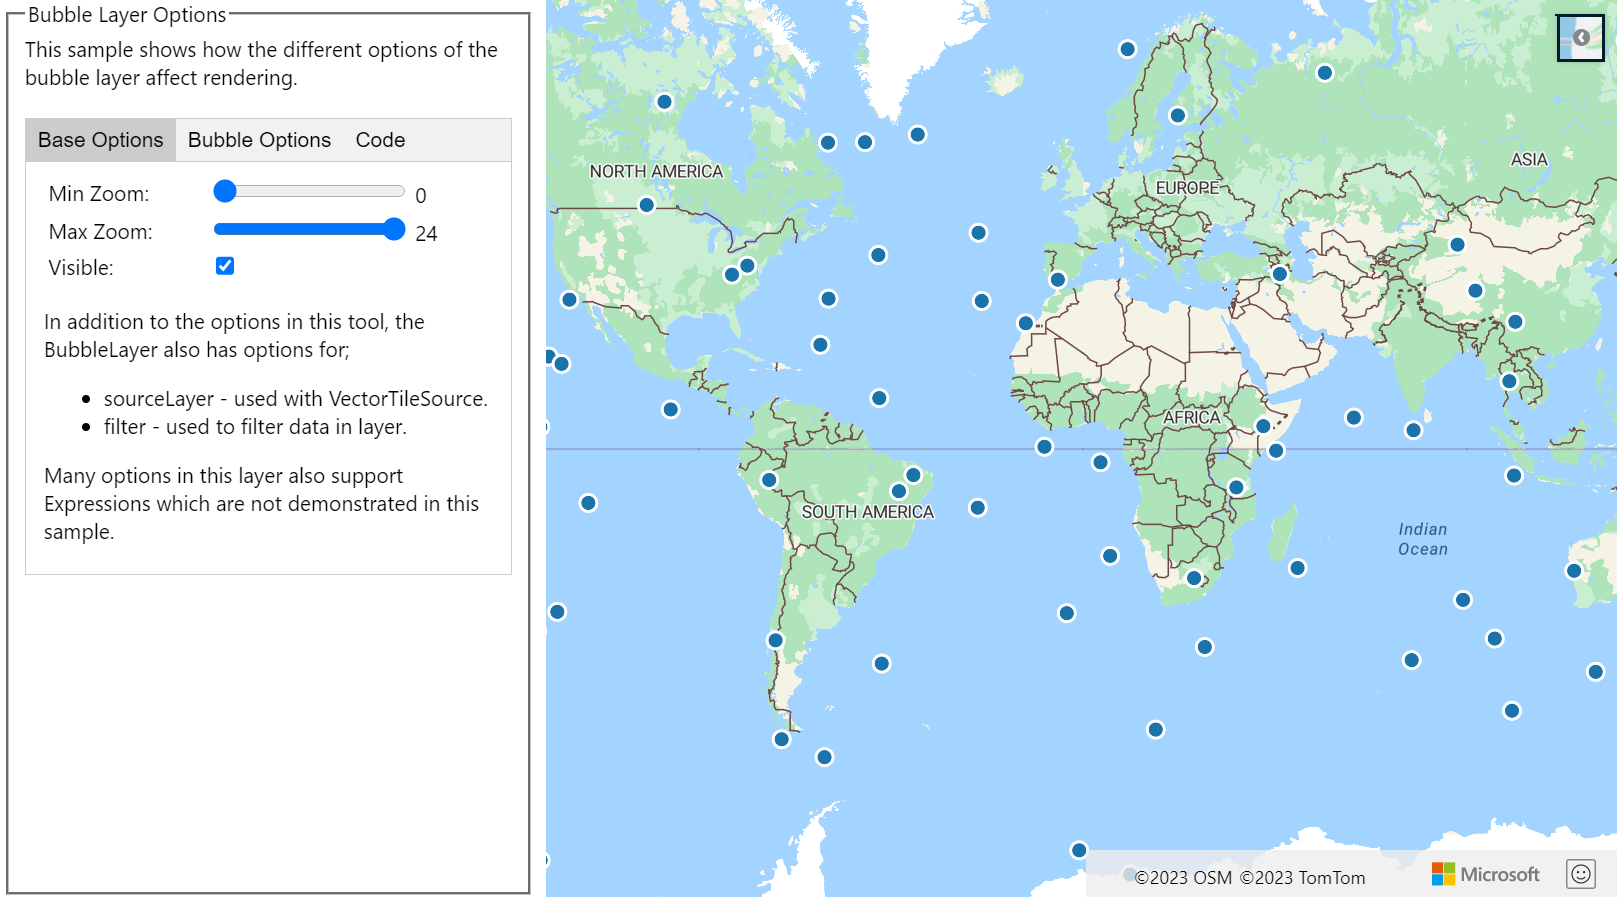
バブル レイヤーをカスタマイズする
バブル レイヤーにはごくわずかのスタイル オプションしかありません。 これらを試すには、バブル レイヤーのオプション サンプルを使用します。このサンプルのソース コードについては、バブル レイヤーのオプションのソース コードを参照してください。
次のステップ
この記事で使われているクラスとメソッドの詳細については、次を参照してください。
マップに追加できる他のコード サンプルについては、次の記事をご覧ください。