風力は、気候変動への対策として化石燃料に代わるエネルギー源です。 風はもともと一定のものではないため、風力のオペレーターは機械学習 (ML) モデルを作成して、風力発電能力を予測する必要があります。 電力需要を満たし、送電網の安定性を確保するためには、この予測が必要となります。 このチュートリアルでは、気象測定値のデモ データに Azure Maps の天気予報データを結合する方法について取り上げます。 天気予報データは、Azure Maps Weather Service を呼び出すことによって要求されます。
このチュートリアルでは、次のことについて説明します。
- VS Code で Jupyter Notebook を作成し、実行します。
- ファイルからデモ データを読み込む。
- Python で Azure Maps REST API シリーズを呼び出す。
- マップ上に場所データをレンダリングする。
- Azure Maps の気象データ (毎日の予報) でデモ データをエンリッチする。
- 予測データをグラフにプロットする。
注
このプロジェクトの Jupyter Notebook ファイルは、Weather Maps Jupyter Notebook リポジトリからダウンロードできます。
前提条件
Azure サブスクリプションをお持ちでない場合は、開始する前に 無料アカウント を作成してください。
- Azure Maps アカウント
- サブスクリプション キー
- Visual Studio Code
- VS Code での Jupyter Notebooks に関する実用的な知識
- Jupyter Notebooks で Python を使用するための環境設定。 詳細については、「環境を設定する」を参照してください。
注
Azure Maps での認証の詳細については、「Azure Maps での認証の管理」を参照してください。
プロジェクト レベルのパッケージをインストールする
"EV ルーティングと到達可能範囲" プロジェクトは aiohttp と IPython Python ライブラリに依存しています。 Visual Studio ターミナルで pip を使用してインストールできます。
pip install aiohttp
pip install ipython
pip install pandas
Visual Studio Code で Jupyter Notebook を開く
ダウンロードして、次のチュートリアルで使用するノートブックを開きます。
GitHub の AzureMapsJupyterSamples リポジトリにある weatherDataMaps.ipynb ファイルを開きます。
画面右上隅の [RAW ファイルをダウンロード] ボタンを選択し、ファイルをローカルに保存します。
ファイルを右クリックして [プログラムから開く] > [Visual Studio Code] を選択するか、VS Code ファイル エクスプローラー経由で、Visual Studio Code でダウンロードしたノートブックを開きます。
必要なモジュールとフレームワークを読み込む
コードが追加されると、セルの左にある [実行] アイコンを使用してセルを実行できまう。出力はコード セルの下に表示されます。
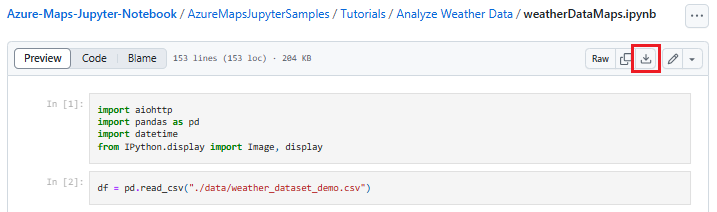
必要なモジュールとフレームワークをすべて読み込むには、次のスクリプトを実行します。
import aiohttp
import pandas as pd
import datetime
from IPython.display import Image, display
![必要な import ステートメントを含むノートブックの最初のセルをダウンロードする方法を示すスクリーンショット。[実行] ボタンが強調表示されています。](media/weather-service-tutorial/import-libraries.png)
気象データをインポートする
このチュートリアルでは、4 つの異なる風力タービンに設置されたセンサーからの気象データの測定値を利用します。 サンプル データは、30 日間分の気象データ測定値から成ります。 これらの測定値は各タービンに近接する気象データ センターから収集されています。 デモ データには、気温、風速、風向の各データの測定値が含まれています。 weather_dataset_demo.csv に含まれているデモ データを GitHub からダウンロードできます。 次のスクリプトでは、デモ データを Azure Notebook にインポートします。
df = pd.read_csv("./data/weather_dataset_demo.csv")
毎日の予報データを要求する
このシナリオでは、センサーの設置場所ごとの毎日の予報を要求します。 次のスクリプトは、Azure Maps Weather サービスの Daily Forecast API を呼び出します。 この API は、現在の日付から 15 日間の天気予報を、それぞれの風力タービンについて返します。
subscription_key = "Your Azure Maps key"

# Get a lists of unique station IDs and their coordinates
station_ids = pd.unique(df[['StationID']].values.ravel())
coords = pd.unique(df[['latitude','longitude']].values.ravel())

years,months,days = [],[],[]
dates_check=set()
wind_speeds, wind_direction = [], []

# Call azure maps Weather service to get daily forecast data for 15 days from current date
session = aiohttp.ClientSession()
j=-1
for i in range(0, len(coords), 2):
    wind_speeds.append([])
    wind_direction.append([])

    query = str(coords[i])+', '+str(coords[i+1])
    forecast_response = await(await session.get("https://atlas.microsoft.com/weather/forecast/daily/json?query={}&api-version=1.0&subscription-key={}&duration=15".format(query, subscription_key))).json()
    j+=1
    for day in range(len(forecast_response['forecasts'])):
            date = forecast_response['forecasts'][day]['date'][:10]
            wind_speeds[j].append(forecast_response['forecasts'][day]['day']['wind']['speed']['value'])
            wind_direction[j].append(forecast_response['forecasts'][day]['day']['windGust']['direction']['degrees'])

            if date not in dates_check:
                year,month,day= date.split('-')
                years.append(year)
                months.append(month)
                days.append(day)
                dates_check.add(date)

await session.close()
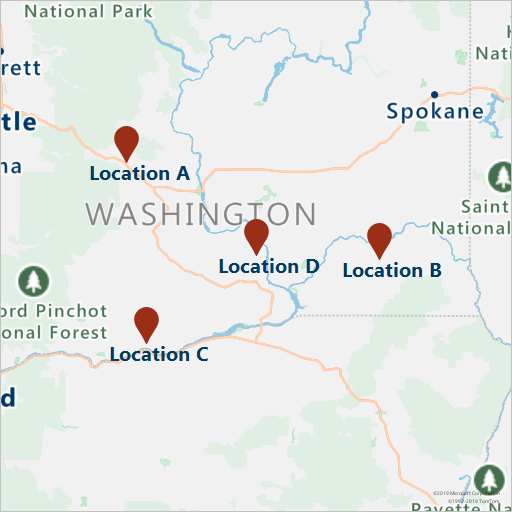
次のスクリプトでは、Get Map Image サービスを呼び出してタービンの場所を地図上にレンダリングします。
# Render the turbine locations on the map by calling the Azure Maps Get Map Image service
session = aiohttp.ClientSession()
pins="default|la-25+60|ls12|lc003C62|co9B2F15||'Location A'{} {}|'Location B'{} {}|'Location C'{} {}|'Location D'{} {}".format(coords[1],coords[0],coords[3],coords[2],coords[5],coords[4], coords[7],coords[6])
image_response = "https://atlas.microsoft.com/map/static?subscription-key={}&api-version=2024-04-01&layer=basic&style=main&zoom=6¢er={},{}&pins={}".format(subscription_key,coords[7],coords[6],pins)
static_map_response = await session.get(image_response)
poi_range_map = await static_map_response.content.read()
await session.close()
display(Image(poi_range_map))
ここでは、ステーション ID に基づいて、予測データとデモ データをグループ化します。 ステーション ID は、気象データ センターのものです。 グループ化によって、デモ データを予測データで強化します。
# Group forecasted data for all locations
df = df.reset_index(drop=True)
forecast_data = pd.DataFrame(columns=['StationID','latitude','longitude','Year','Month','Day','DryBulbCelsius','WetBulbFarenheit','WetBulbCelsius','DewPointFarenheit','DewPointCelsius','RelativeHumidity','WindSpeed','WindDirection'])

for i in range(len(station_ids)):
    loc_forecast = pd.DataFrame({'StationID':station_ids[i], 'latitude':coords[0], 'longitude':coords[1], 'Year':years, 'Month':months, 'Day':days, 'WindSpeed':wind_speeds[i], 'WindDirection':wind_direction[i]})
    forecast_data = pd.concat([forecast_data,loc_forecast], axis=0, sort=False)

combined_weather_data = pd.concat([df,forecast_data])
grouped_weather_data = combined_weather_data.groupby(['StationID'])
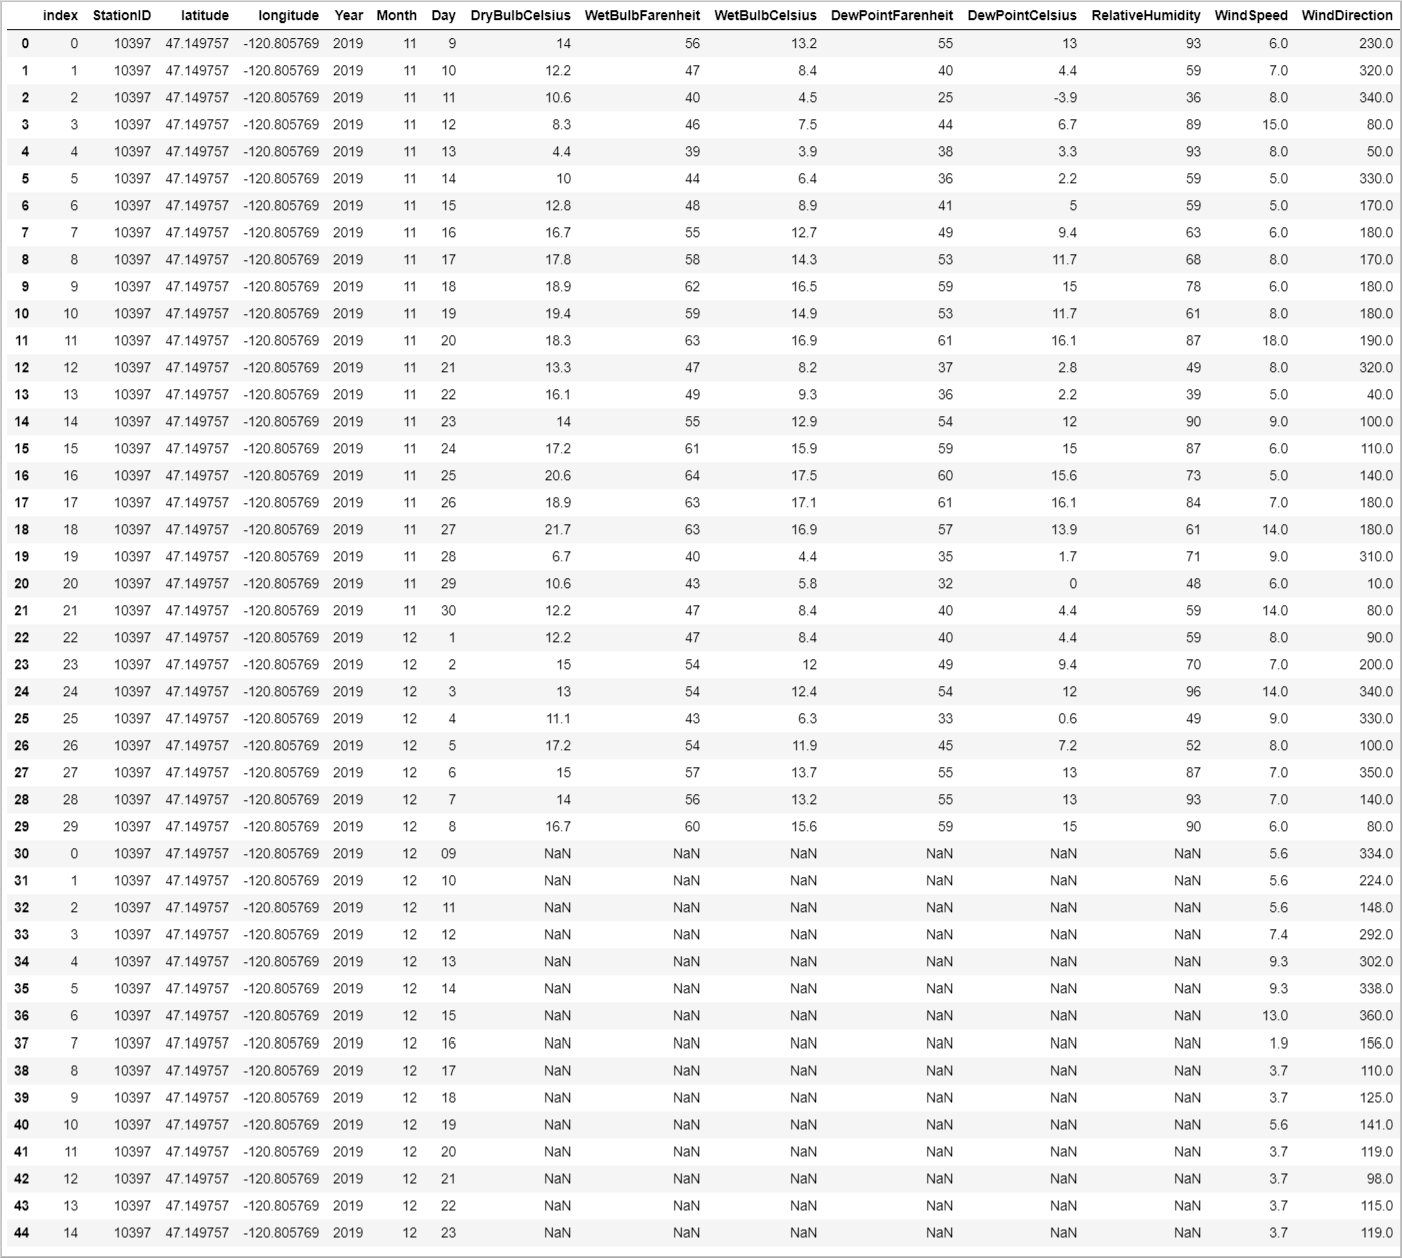
次の表は、各地に設置されたタービンの 1 つについて、履歴データと予測データを併せて表示したものです。
# Display data for first location
grouped_weather_data.get_group(station_ids[0]).reset_index()
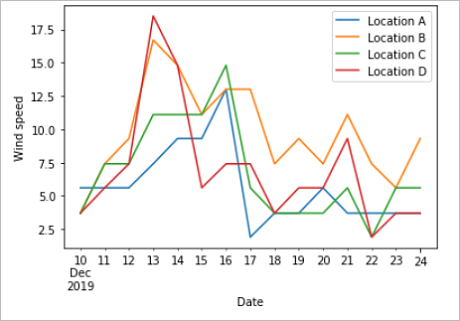
予測データをプロットする
予測されている日付に対して予測値をプロットします。 このプロットによって、今後 15 日間に風速と風向がどのように変化するかを見ることができます。
# Plot wind speed
curr_date = datetime.datetime.now().date()
windsPlot_df = pd.DataFrame({ 'Location A': wind_speeds[0], 'Location B': wind_speeds[1], 'Location C': wind_speeds[2], 'Location D': wind_speeds[3]}, index=pd.date_range(curr_date,periods=15))
windsPlot = windsPlot_df.plot.line()
windsPlot.set_xlabel("Date")
windsPlot.set_ylabel("Wind speed")
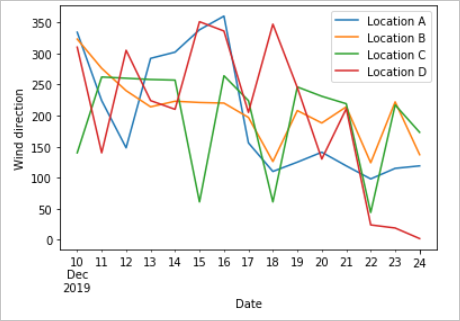
#Plot wind direction
windsPlot_df = pd.DataFrame({ 'Location A': wind_direction[0], 'Location B': wind_direction[1], 'Location C': wind_direction[2], 'Location D': wind_direction[3]}, index=pd.date_range(curr_date,periods=15))
windsPlot = windsPlot_df.plot.line()
windsPlot.set_xlabel("Date")
windsPlot.set_ylabel("Wind direction")
次のグラフは、予測データを視覚化したものです。 風速の変化については、左側のグラフを参照してください。 風向の変化については、右側のグラフを参照してください。 このデータは、データが要求された日を起点とするその後 15 日間の予測です。
このチュートリアルでは、Azure Maps の REST API を呼び出して天気予報データを取得する方法について説明しました。 そのデータをグラフで視覚化する方法についても説明しました。
このチュートリアルで使用した Azure Maps API シリーズの詳細については、以下を参照してください。
Azure Maps REST API シリーズの完全な一覧については、Azure Maps REST API に関する記事を参照してください。