series_fit_lowess_fl()
関数series_fit_lowess_fl()は、LOWESS 回帰を系列に適用する、ユーザー定義関数 (UDF) です。 この関数は、複数の系列 (動的な数値配列) を含むテーブルを受け取り、元の系列の平滑化されたバージョンである "Lowess 曲線" を生成します。
前提条件
- Python プラグインは、クラスター 有効にする必要があります。 これは、関数で使用されるインライン Python に必要です。
- Python プラグインは、データベース 有効にする必要があります。 これは、関数で使用されるインライン Python に必要です。
構文
T | invoke series_fit_lowess_fl(y_series, y_fit_series, [ fit_size ], [ x_series ] , [ x_istime ])
構文規則について詳しく知る。
パラメーター
| 件名 | タイプ | Required | 説明 |
|---|---|---|---|
| y_series | string |
✔️ | 依存関係変数を含む入力テーブル列の名前。 この列は適合対象の系列です。 |
| y_fit_series | string |
✔️ | 適合する系列を格納する列の名前。 |
| fit_size | int |
各ポイントについて、ローカル回帰がそれぞれの fit_size 最も近いポイントに適用されます。 既定値は 5 です。 | |
| x_series | string |
依存変数、つまり x 軸または時間軸を含む列の名前。 このパラメーターは省略可能であり、等間隔ではない系列に対してのみ必要です。 x は等間隔の系列の回帰には冗長なので、既定値は空の文字列です。 | |
| x_istime | bool |
このブール値パラメーターは、 x_series が指定され、datetime のベクトルである場合にのみ必要です。 既定値は、false です。 |
関数定義
関数を定義するには、次のようにコードをクエリ定義関数として埋め込むか、データベースに格納された関数として作成します。
次の let ステートメントを使用して関数を定義。 権限は必要ありません。
重要
let ステートメント単独では実行できません。 その後に 表形式の式ステートメントが続く必要があります。 series_fit_lowess_fl()の動作例を実行するには、「Examplesを参照してください。
let series_fit_lowess_fl=(tbl:(*), y_series:string, y_fit_series:string, fit_size:int=5, x_series:string='', x_istime:bool=False)
{
    let kwargs = bag_pack('y_series', y_series, 'y_fit_series', y_fit_series, 'fit_size', fit_size, 'x_series', x_series, 'x_istime', x_istime);
    let code = ```if 1:
        y_series = kargs["y_series"]
        y_fit_series = kargs["y_fit_series"]
        fit_size = kargs["fit_size"]
        x_series = kargs["x_series"]
        x_istime = kargs["x_istime"]
        import statsmodels.api as sm
        def lowess_fit(ts_row, x_col, y_col, fsize):
            y = ts_row[y_col]
            fraction = fsize/len(y)
            if x_col == "": # If there is no x column creates sequential range [1, len(y)]
               x = np.arange(len(y)) + 1
            else: # if x column exists check whether its a time column. If so, normalize it to the [1, len(y)] range, else take it as is.
               if x_istime:
                   x = pd.to_numeric(pd.to_datetime(ts_row[x_col]))
                   x = x - x.min()
                   x = x / x.max()
                   x = x * (len(x) - 1) + 1
               else:
                   x = ts_row[x_col]
            lowess = sm.nonparametric.lowess
            z = lowess(y, x, return_sorted=False, frac=fraction)
            return list(z)
        result = df
        result[y_fit_series] = df.apply(lowess_fit, axis=1, args=(x_series, y_series, fit_size))
    ```;
    tbl
     | evaluate python(typeof(*), code, kwargs)
};
// Write your query to use the function here.
例
次の例では、 invoke 演算子 を使用して関数を実行します。
通常の時系列での LOWESS 回帰
クエリ定義関数を使用するには、埋め込み関数定義の後に呼び出します。
let series_fit_lowess_fl=(tbl:(*), y_series:string, y_fit_series:string, fit_size:int=5, x_series:string='', x_istime:bool=False)
{
let kwargs = bag_pack('y_series', y_series, 'y_fit_series', y_fit_series, 'fit_size', fit_size, 'x_series', x_series, 'x_istime', x_istime);
let code = ```if 1:
y_series = kargs["y_series"]
y_fit_series = kargs["y_fit_series"]
fit_size = kargs["fit_size"]
x_series = kargs["x_series"]
x_istime = kargs["x_istime"]
import statsmodels.api as sm
def lowess_fit(ts_row, x_col, y_col, fsize):
y = ts_row[y_col]
fraction = fsize/len(y)
if x_col == "": # If there is no x column creates sequential range [1, len(y)]
x = np.arange(len(y)) + 1
else: # if x column exists check whether its a time column. If so, normalize it to the [1, len(y)] range, else take it as is.
if x_istime:
x = pd.to_numeric(pd.to_datetime(ts_row[x_col]))
x = x - x.min()
x = x / x.max()
x = x * (len(x) - 1) + 1
else:
x = ts_row[x_col]
lowess = sm.nonparametric.lowess
z = lowess(y, x, return_sorted=False, frac=fraction)
return list(z)
result = df
result[y_fit_series] = df.apply(lowess_fit, axis=1, args=(x_series, y_series, fit_size))
```;
tbl
| evaluate python(typeof(*), code, kwargs)
};
//
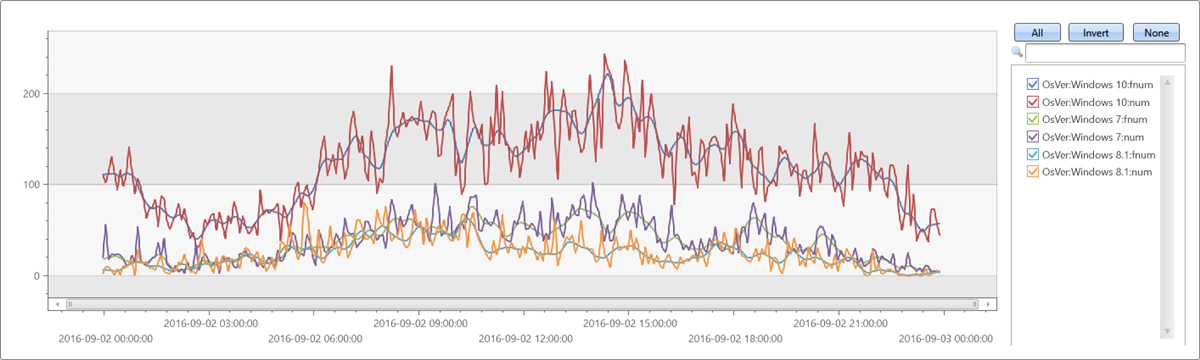
// Apply 9 points LOWESS regression on regular time series
//
let max_t = datetime(2016-09-03);
demo_make_series1
| make-series num=count() on TimeStamp from max_t-1d to max_t step 5m by OsVer
| extend fnum = dynamic(null)
| invoke series_fit_lowess_fl('num', 'fnum', 9)
| render timechart
出力
不規則な時系列をテストする
クエリ定義関数を使用するには、埋め込み関数定義の後に呼び出します。
let series_fit_lowess_fl=(tbl:(*), y_series:string, y_fit_series:string, fit_size:int=5, x_series:string='', x_istime:bool=False)
{
    let kwargs = bag_pack('y_series', y_series, 'y_fit_series', y_fit_series, 'fit_size', fit_size, 'x_series', x_series, 'x_istime', x_istime);
    let code = ```if 1:
        y_series = kargs["y_series"]
        y_fit_series = kargs["y_fit_series"]
        fit_size = kargs["fit_size"]
        x_series = kargs["x_series"]
        x_istime = kargs["x_istime"]
        import statsmodels.api as sm
        def lowess_fit(ts_row, x_col, y_col, fsize):
            y = ts_row[y_col]
            fraction = fsize/len(y)
            if x_col == "": # If there is no x column creates sequential range [1, len(y)]
               x = np.arange(len(y)) + 1
            else: # if x column exists check whether its a time column. If so, normalize it to the [1, len(y)] range, else take it as is.
               if x_istime:
                   x = pd.to_numeric(pd.to_datetime(ts_row[x_col]))
                   x = x - x.min()
                   x = x / x.max()
                   x = x * (len(x) - 1) + 1
               else:
                   x = ts_row[x_col]
            lowess = sm.nonparametric.lowess
            z = lowess(y, x, return_sorted=False, frac=fraction)
            return list(z)
        result = df
        result[y_fit_series] = df.apply(lowess_fit, axis=1, args=(x_series, y_series, fit_size))
    ```;
    tbl
     | evaluate python(typeof(*), code, kwargs)
};
let max_t = datetime(2016-09-03);
demo_make_series1
| where TimeStamp between ((max_t-1d)..max_t)
| summarize num=count() by bin(TimeStamp, 5m), OsVer
| order by TimeStamp asc
| where hourofday(TimeStamp) % 6 != 0   //  delete every 6th hour to create irregular time series
| summarize TimeStamp=make_list(TimeStamp), num=make_list(num) by OsVer
| extend fnum = dynamic(null)
| invoke series_fit_lowess_fl('num', 'fnum', 9, 'TimeStamp', True)
| render timechart
出力

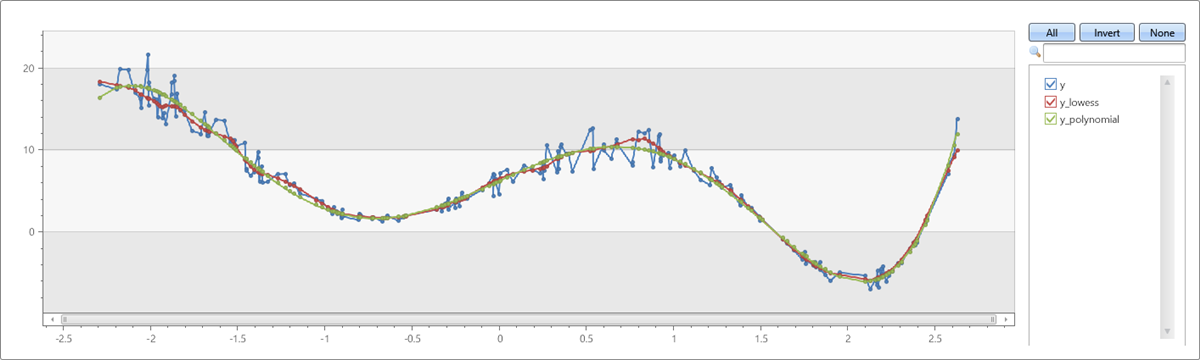
LOWESS と多項式適合を比較する
クエリ定義関数を使用するには、埋め込み関数定義の後に呼び出します。
let series_fit_lowess_fl=(tbl:(*), y_series:string, y_fit_series:string, fit_size:int=5, x_series:string='', x_istime:bool=False)
{
    let kwargs = bag_pack('y_series', y_series, 'y_fit_series', y_fit_series, 'fit_size', fit_size, 'x_series', x_series, 'x_istime', x_istime);
    let code = ```if 1:
        y_series = kargs["y_series"]
        y_fit_series = kargs["y_fit_series"]
        fit_size = kargs["fit_size"]
        x_series = kargs["x_series"]
        x_istime = kargs["x_istime"]
        import statsmodels.api as sm
        def lowess_fit(ts_row, x_col, y_col, fsize):
            y = ts_row[y_col]
            fraction = fsize/len(y)
            if x_col == "": # If there is no x column creates sequential range [1, len(y)]
               x = np.arange(len(y)) + 1
            else: # if x column exists check whether its a time column. If so, normalize it to the [1, len(y)] range, else take it as is.
               if x_istime:
                   x = pd.to_numeric(pd.to_datetime(ts_row[x_col]))
                   x = x - x.min()
                   x = x / x.max()
                   x = x * (len(x) - 1) + 1
               else:
                   x = ts_row[x_col]
            lowess = sm.nonparametric.lowess
            z = lowess(y, x, return_sorted=False, frac=fraction)
            return list(z)
        result = df
        result[y_fit_series] = df.apply(lowess_fit, axis=1, args=(x_series, y_series, fit_size))
    ```;
    tbl
     | evaluate python(typeof(*), code, kwargs)
};
range x from 1 to 200 step 1
| project x = rand()*5 - 2.3
| extend y = pow(x, 5)-8*pow(x, 3)+10*x+6
| extend y = y + (rand() - 0.5)*0.5*y
| summarize x=make_list(x), y=make_list(y)
| extend y_lowess = dynamic(null)
| invoke series_fit_lowess_fl('y', 'y_lowess', 15, 'x')
| extend series_fit_poly(y, x, 5)
| project x, y, y_lowess, y_polynomial=series_fit_poly_y_poly_fit
| render linechart
出力
この機能はサポートされていません。
フィードバック
以下は間もなく提供いたします。2024 年を通じて、コンテンツのフィードバック メカニズムとして GitHub の issue を段階的に廃止し、新しいフィードバック システムに置き換えます。 詳細については、「https://aka.ms/ContentUserFeedback」を参照してください。
フィードバックの送信と表示