series_fit_poly_fl()
関数 series_fit_poly_fl() は、系列に多項式回帰を適用する ユーザー定義関数 (UDF) です。 この関数は、複数の系列 (動的な数値配列) を含むテーブルを受け取り、多項式回帰を使用して各系列に最適な高次多項式を生成します。 この関数は、系列の範囲に対する多項式係数と補間多項式の両方を返します。
Note
- このドキュメントで説明する関数の代わりに、ネイティブ関数 series_fit_poly() を使用します。 ネイティブ関数は同じ機能を提供し、パフォーマンスとスケーラビリティに優れています。 このドキュメントは、参照目的でのみ提供されています。
- make-series 演算子によって作成されるような等間隔の系列の線形回帰の場合は、ネイティブ関数 series_fit_line() を使用します。
前提条件
- クラスターで Python プラグインを有効にする必要があります。 これは、 関数で使用されるインライン Python に必要です。
- データベースで Python プラグイン を有効にする必要があります。 これは、 関数で使用されるインライン Python に必要です。
構文
T | invoke series_fit_poly_fl(, y_series, y_fit_series, fit_coeff度,[ x_series ],[ x_istime ])
構文規則について詳しく知る。
パラメーター
| 名前 | 型 | 必須 | 説明 |
|---|---|---|---|
| y_series | string |
✔️ | 従属変数を含む入力テーブル列の名前。 適合対象の系列です。 |
| y_fit_series | string |
✔️ | 最適な系列を格納する列の名前。 |
| fit_coeff | string |
✔️ | 最適な多項式係数を格納する列の名前。 |
| degree | int |
✔️ | 適合に使用する多項式の次数。 たとえば、線形回帰の場合は 1、二次回帰の場合は 2、などとなります。 |
| x_series | string |
独立変数 (x 軸または時間軸) を含む列の名前。 このパラメーターは省略可能であり、等間隔ではない系列に対してのみ必要です。 x は等間隔の系列の回帰には冗長なので、既定値は空の文字列です。 | |
| x_istime | bool |
このパラメーターは、x_series が指定されていて、それが datetime のベクターである場合にのみ必要です。 |
関数の定義
関数を定義するには、次のように、コードをクエリ定義関数として埋め込むか、データベースに格納されている関数として作成します。
次の let ステートメントを使用して関数を定義します。 権限は必要ありません。
重要
let ステートメントは単独では実行できません。 その後に 表形式の式ステートメントを記述する必要があります。 の動作例 series_fit_poly_fl()を実行するには、「 例」を参照してください。
let series_fit_poly_fl=(tbl:(*), y_series:string, y_fit_series:string, fit_coeff:string, degree:int, x_series:string='', x_istime:bool=False)
{
    let kwargs = bag_pack('y_series', y_series, 'y_fit_series', y_fit_series, 'fit_coeff', fit_coeff, 'degree', degree, 'x_series', x_series, 'x_istime', x_istime);
    let code = ```if 1:
        y_series = kargs["y_series"]
        y_fit_series = kargs["y_fit_series"]
        fit_coeff = kargs["fit_coeff"]
        degree = kargs["degree"]
        x_series = kargs["x_series"]
        x_istime = kargs["x_istime"]

        def fit(ts_row, x_col, y_col, deg):
            y = ts_row[y_col]
            if x_col == "": # If there is no x column creates sequential range [1, len(y)]
               x = np.arange(len(y)) + 1
            else: # if x column exists check whether its a time column. If so, normalize it to the [1, len(y)] range, else take it as is.
               if x_istime:
                   x = pd.to_numeric(pd.to_datetime(ts_row[x_col]))
                   x = x - x.min()
                   x = x / x.max()
                   x = x * (len(x) - 1) + 1
               else:
                   x = ts_row[x_col]
            coeff = np.polyfit(x, y, deg)
            p = np.poly1d(coeff)
            z = p(x)
            return z, coeff

        result = df
        if len(df):
           result[[y_fit_series, fit_coeff]] = df.apply(fit, axis=1, args=(x_series, y_series, degree,), result_type="expand")
    ```;
    tbl
     | evaluate python(typeof(*), code, kwargs)
};
// Write your query to use the function here.
例
次の例では、 invoke 演算子 を使用して関数を実行します。
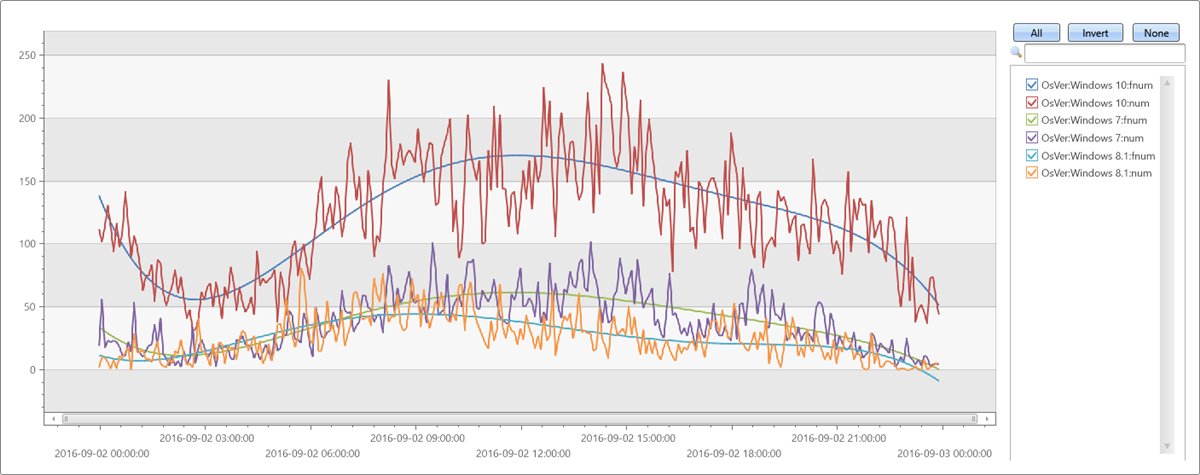
5 次多項式を通常の時系列に合わせる
クエリ定義関数を使用するには、埋め込み関数定義の後にそれを呼び出します。
let series_fit_poly_fl=(tbl:(*), y_series:string, y_fit_series:string, fit_coeff:string, degree:int, x_series:string='', x_istime:bool=False)
{
    let kwargs = bag_pack('y_series', y_series, 'y_fit_series', y_fit_series, 'fit_coeff', fit_coeff, 'degree', degree, 'x_series', x_series, 'x_istime', x_istime);
    let code = ```if 1:
        y_series = kargs["y_series"]
        y_fit_series = kargs["y_fit_series"]
        fit_coeff = kargs["fit_coeff"]
        degree = kargs["degree"]
        x_series = kargs["x_series"]
        x_istime = kargs["x_istime"]

        def fit(ts_row, x_col, y_col, deg):
            y = ts_row[y_col]
            if x_col == "": # If there is no x column creates sequential range [1, len(y)]
               x = np.arange(len(y)) + 1
            else: # if x column exists check whether its a time column. If so, normalize it to the [1, len(y)] range, else take it as is.
               if x_istime:
                   x = pd.to_numeric(pd.to_datetime(ts_row[x_col]))
                   x = x - x.min()
                   x = x / x.max()
                   x = x * (len(x) - 1) + 1
               else:
                   x = ts_row[x_col]
            coeff = np.polyfit(x, y, deg)
            p = np.poly1d(coeff)
            z = p(x)
            return z, coeff

        result = df
        if len(df):
           result[[y_fit_series, fit_coeff]] = df.apply(fit, axis=1, args=(x_series, y_series, degree,), result_type="expand")
    ```;
    tbl
     | evaluate python(typeof(*), code, kwargs)
};
//
// Fit fifth order polynomial to a regular (evenly spaced) time series, created with make-series
//
let max_t = datetime(2016-09-03);
demo_make_series1
| make-series num=count() on TimeStamp from max_t-1d to max_t step 5m by OsVer
| extend fnum = dynamic(null), coeff=dynamic(null), fnum1 = dynamic(null), coeff1=dynamic(null)
| invoke series_fit_poly_fl('num', 'fnum', 'coeff', 5)
| render timechart with(ycolumns=num, fnum)
出力
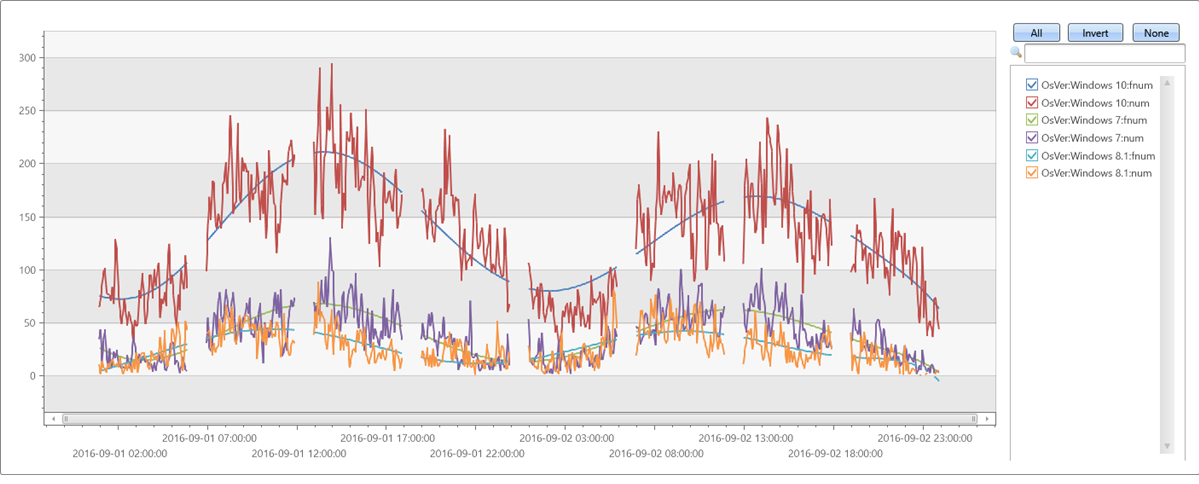
不規則な時系列をテストする
クエリ定義関数を使用するには、埋め込み関数定義の後にそれを呼び出します。
let series_fit_poly_fl=(tbl:(*), y_series:string, y_fit_series:string, fit_coeff:string, degree:int, x_series:string='', x_istime:bool=False)
{
    let kwargs = bag_pack('y_series', y_series, 'y_fit_series', y_fit_series, 'fit_coeff', fit_coeff, 'degree', degree, 'x_series', x_series, 'x_istime', x_istime);
    let code = ```if 1:
        y_series = kargs["y_series"]
        y_fit_series = kargs["y_fit_series"]
        fit_coeff = kargs["fit_coeff"]
        degree = kargs["degree"]
        x_series = kargs["x_series"]
        x_istime = kargs["x_istime"]

        def fit(ts_row, x_col, y_col, deg):
            y = ts_row[y_col]
            if x_col == "": # If there is no x column creates sequential range [1, len(y)]
               x = np.arange(len(y)) + 1
            else: # if x column exists check whether its a time column. If so, normalize it to the [1, len(y)] range, else take it as is.
               if x_istime:
                   x = pd.to_numeric(pd.to_datetime(ts_row[x_col]))
                   x = x - x.min()
                   x = x / x.max()
                   x = x * (len(x) - 1) + 1
               else:
                   x = ts_row[x_col]
            coeff = np.polyfit(x, y, deg)
            p = np.poly1d(coeff)
            z = p(x)
            return z, coeff

        result = df
        if len(df):
           result[[y_fit_series, fit_coeff]] = df.apply(fit, axis=1, args=(x_series, y_series, degree,), result_type="expand")
    ```;
    tbl
     | evaluate python(typeof(*), code, kwargs)
};
let max_t = datetime(2016-09-03);
demo_make_series1
| where TimeStamp between ((max_t-2d)..max_t)
| summarize num=count() by bin(TimeStamp, 5m), OsVer
| order by TimeStamp asc
| where hourofday(TimeStamp) % 6 != 0   //  delete every 6th hour to create unevenly spaced time series
| summarize TimeStamp=make_list(TimeStamp), num=make_list(num) by OsVer
| extend fnum = dynamic(null), coeff=dynamic(null)
| invoke series_fit_poly_fl('num', 'fnum', 'coeff', 8, 'TimeStamp', True)
| render timechart with(ycolumns=num, fnum)
出力
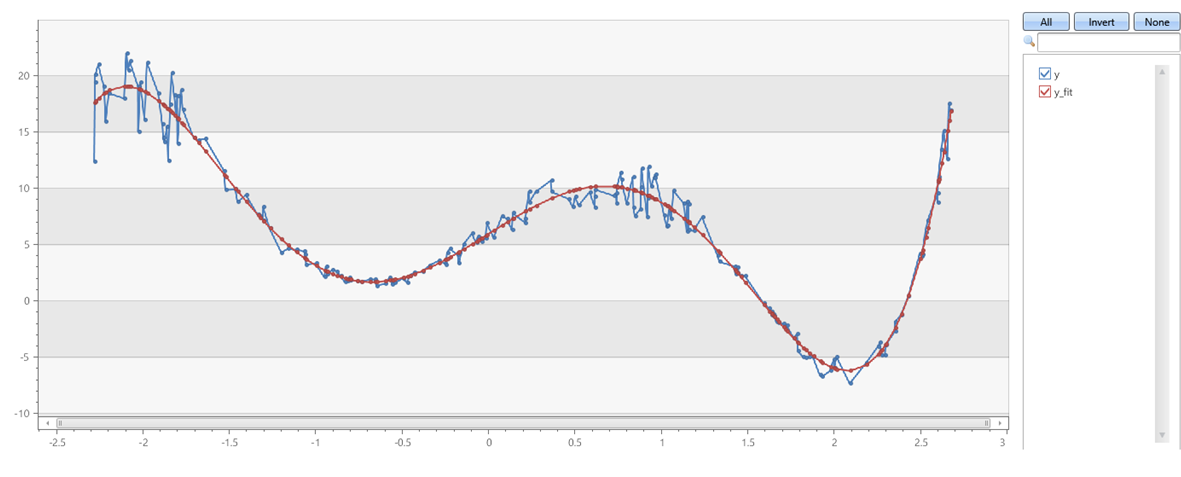
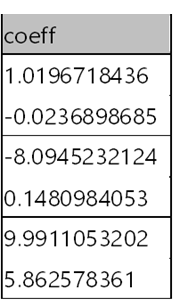
x & y 軸のノイズを含む 5 次多項式
クエリ定義関数を使用するには、埋め込み関数定義の後にそれを呼び出します。
let series_fit_poly_fl=(tbl:(*), y_series:string, y_fit_series:string, fit_coeff:string, degree:int, x_series:string='', x_istime:bool=False)
{
    let kwargs = bag_pack('y_series', y_series, 'y_fit_series', y_fit_series, 'fit_coeff', fit_coeff, 'degree', degree, 'x_series', x_series, 'x_istime', x_istime);
    let code = ```if 1:
        y_series = kargs["y_series"]
        y_fit_series = kargs["y_fit_series"]
        fit_coeff = kargs["fit_coeff"]
        degree = kargs["degree"]
        x_series = kargs["x_series"]
        x_istime = kargs["x_istime"]

        def fit(ts_row, x_col, y_col, deg):
            y = ts_row[y_col]
            if x_col == "": # If there is no x column creates sequential range [1, len(y)]
               x = np.arange(len(y)) + 1
            else: # if x column exists check whether its a time column. If so, normalize it to the [1, len(y)] range, else take it as is.
               if x_istime:
                   x = pd.to_numeric(pd.to_datetime(ts_row[x_col]))
                   x = x - x.min()
                   x = x / x.max()
                   x = x * (len(x) - 1) + 1
               else:
                   x = ts_row[x_col]
            coeff = np.polyfit(x, y, deg)
            p = np.poly1d(coeff)
            z = p(x)
            return z, coeff

        result = df
        if len(df):
           result[[y_fit_series, fit_coeff]] = df.apply(fit, axis=1, args=(x_series, y_series, degree,), result_type="expand")
    ```;
    tbl
     | evaluate python(typeof(*), code, kwargs)
};
range x from 1 to 200 step 1
| project x = rand()*5 - 2.3
| extend y = pow(x, 5)-8*pow(x, 3)+10*x+6
| extend y = y + (rand() - 0.5)*0.5*y
| summarize x=make_list(x), y=make_list(y)
| extend y_fit = dynamic(null), coeff=dynamic(null)
| invoke series_fit_poly_fl('y', 'y_fit', 'coeff', 5, 'x')
|fork (project-away coeff) (project coeff | mv-expand coeff)
| render linechart
出力
この機能はサポートされていません。
フィードバック
以下は間もなく提供いたします。2024 年を通じて、コンテンツのフィードバック メカニズムとして GitHub の issue を段階的に廃止し、新しいフィードバック システムに置き換えます。 詳細については、「https://aka.ms/ContentUserFeedback」を参照してください。
フィードバックの送信と表示