この記事では、システム テーブルを使用して、アカウント内の Lakeflow ジョブのコストとパフォーマンスを監視する方法の例を示します。
これらのクエリでは、Jobs Compute およびサーバーレス コンピューティングで実行されるジョブのコストのみを計算します。 SQL ウェアハウスで実行されるジョブと汎用コンピューティングはジョブとして課金されないため、コスト属性から除外されます。
注
これらのクエリは、現在のワークスペースのクラウド リージョン外のワークスペースからレコードを返しません。 現在のリージョン以外のワークスペースからのジョブ コストを監視するには、そのリージョンにデプロイされているワークスペースでこれらのクエリを実行します。
要求事項
-
system.lakeflowスキーマは、アカウント管理者が有効にする必要があります。システム テーブルへのアクセスを参照してください。 - これらのシステム テーブルにアクセスするには、ユーザーは次のいずれかを行う必要があります。
- メタストア管理者とアカウント管理者の両方であるか、または
- システム スキーマに対する
USE権限とSELECT権限を持つ。 システム テーブルへのアクセス権の付与を参照してください。
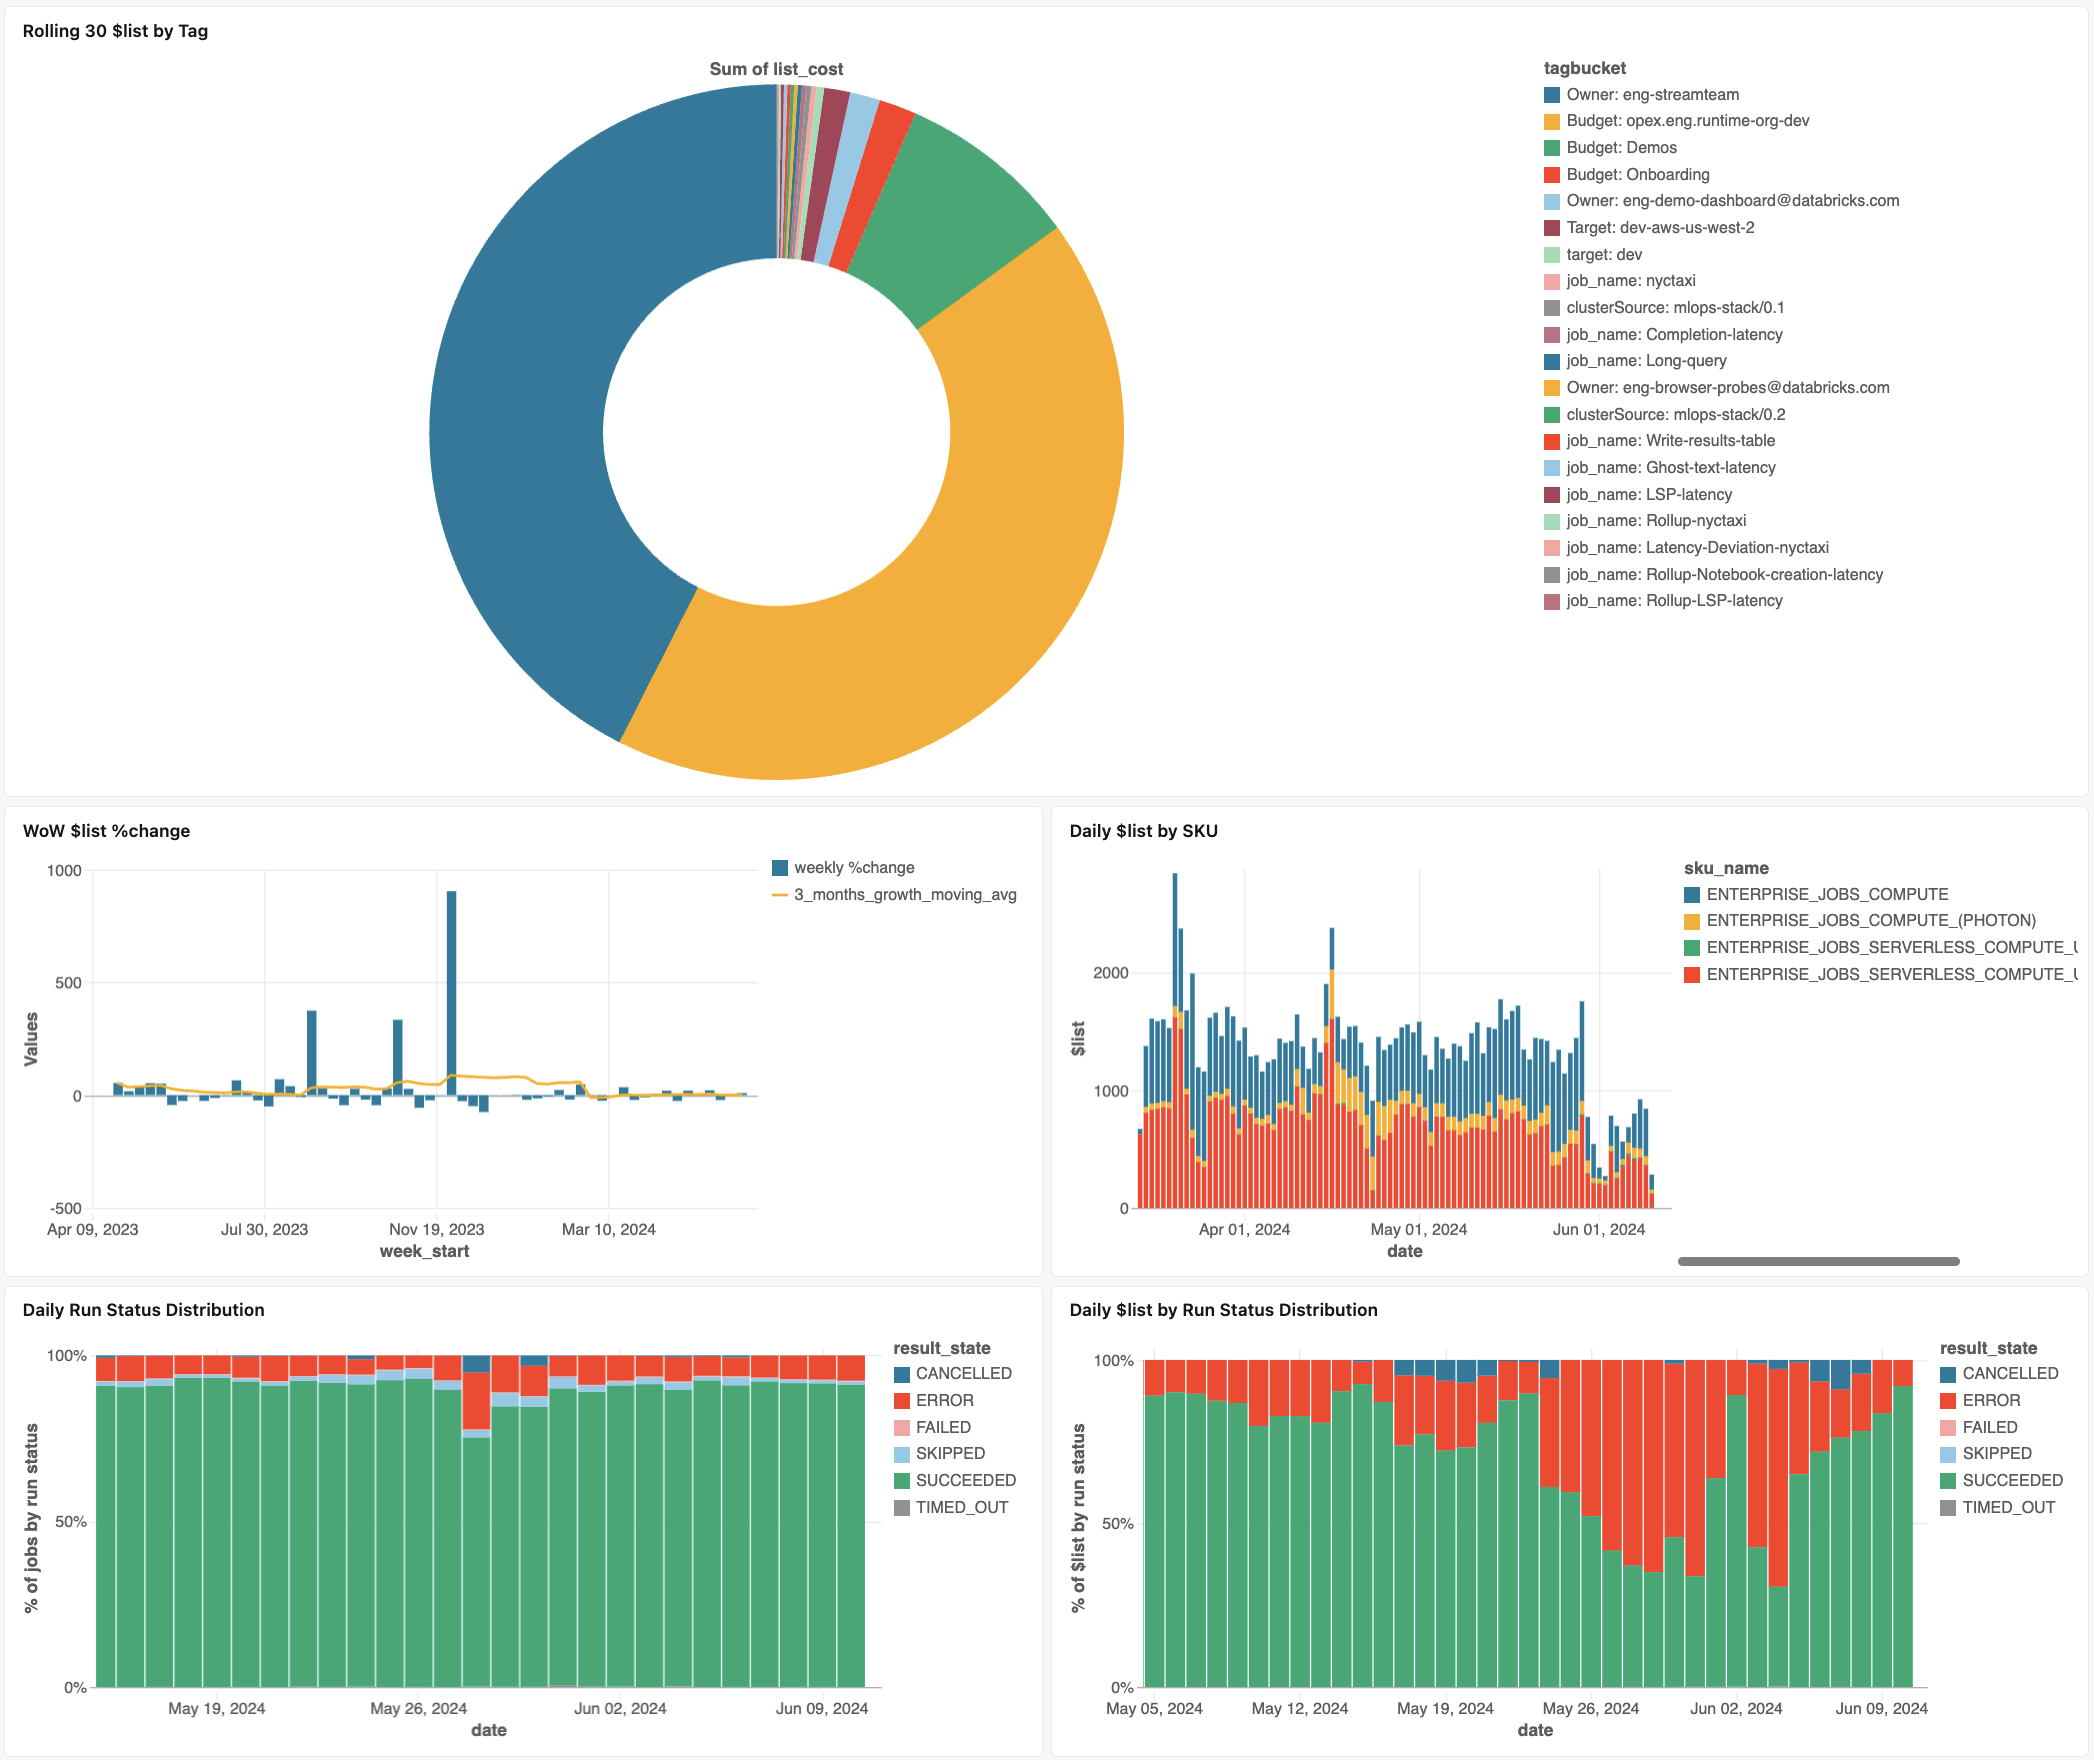
ジョブ監視ダッシュボード
次のダッシュボードでは、システム テーブルを使用して、Lakeflow ジョブと運用の正常性を包括的に監視できます。 これには、ジョブ パフォーマンスの追跡、障害の監視、リソース使用率などの一般的なユース ケースが含まれます。
ダッシュボードをインポートする
- Databricks GitHub リポジトリからダッシュボード JSON ファイルをダウンロードします。
- ダッシュボードをワークスペースにインポートします。 ダッシュボードをインポートする手順については、「ダッシュボード ファイルをインポートする」を参照してください。
コスト監視クエリ
ダッシュボードからの次のクエリは、ジョブ コストの監視機能を示しています。
最もコストの高いジョブ (過去 30 日間)
このクエリでは、過去 30 日間で最も支出の多いジョブを特定します。
with list_cost_per_job as (
  SELECT
    t1.workspace_id,
    t1.usage_metadata.job_id,
    COUNT(DISTINCT t1.usage_metadata.job_run_id) as runs,
    SUM(t1.usage_quantity * list_prices.pricing.default) as list_cost,
    first(identity_metadata.run_as, true) as run_as,
    first(t1.custom_tags, true) as custom_tags,
    MAX(t1.usage_end_time) as last_seen_date
  FROM system.billing.usage t1
  INNER JOIN system.billing.list_prices list_prices on
    t1.cloud = list_prices.cloud and
    t1.sku_name = list_prices.sku_name and
    t1.usage_start_time >= list_prices.price_start_time and
    (t1.usage_end_time <= list_prices.price_end_time or list_prices.price_end_time is null)
  WHERE
    t1.billing_origin_product = "JOBS"
    AND t1.usage_date >= CURRENT_DATE() - INTERVAL 30 DAY
  GROUP BY ALL
),
most_recent_jobs as (
  SELECT
    *,
    ROW_NUMBER() OVER(PARTITION BY workspace_id, job_id ORDER BY change_time DESC) as rn
  FROM
    system.lakeflow.jobs QUALIFY rn=1
)
SELECT
    t2.name,
    t1.job_id,
    t1.workspace_id,
    t1.runs,
    t1.run_as,
    SUM(list_cost) as list_cost,
    t1.last_seen_date
FROM list_cost_per_job t1
  LEFT JOIN most_recent_jobs t2 USING (workspace_id, job_id)
GROUP BY ALL
ORDER BY list_cost DESC
最もコストの高いジョブの実行 (過去 30 日間)
このクエリでは、過去 30 日間で最も支出の多いジョブの実行を特定します。
with list_cost_per_job_run as (
  SELECT
    t1.workspace_id,
    t1.usage_metadata.job_id,
    t1.usage_metadata.job_run_id as run_id,
    SUM(t1.usage_quantity * list_prices.pricing.default) as list_cost,
    first(identity_metadata.run_as, true) as run_as,
    first(t1.custom_tags, true) as custom_tags,
    MAX(t1.usage_end_time) as last_seen_date
  FROM system.billing.usage t1
  INNER JOIN system.billing.list_prices list_prices on
    t1.cloud = list_prices.cloud and
    t1.sku_name = list_prices.sku_name and
    t1.usage_start_time >= list_prices.price_start_time and
    (t1.usage_end_time <= list_prices.price_end_time or list_prices.price_end_time is null)
  WHERE
    t1.billing_origin_product = 'JOBS'
    AND t1.usage_date >= CURRENT_DATE() - INTERVAL 30 DAY
  GROUP BY ALL
),
most_recent_jobs as (
  SELECT
    *,
    ROW_NUMBER() OVER(PARTITION BY workspace_id, job_id ORDER BY change_time DESC) as rn
  FROM
    system.lakeflow.jobs QUALIFY rn=1
)
SELECT
    t1.workspace_id,
    t2.name,
    t1.job_id,
    t1.run_id,
     t1.run_as,
    SUM(list_cost) as list_cost,
    t1.last_seen_date
FROM list_cost_per_job_run t1
  LEFT JOIN most_recent_jobs t2 USING (workspace_id, job_id)
GROUP BY ALL
ORDER BY list_cost DESC
支出傾向分析 (7 ~ 14 日)
このクエリでは、過去 2 週間でリスト コスト支出の増加が最も大きかったジョブを特定します。
with job_run_timeline_with_cost as (
  SELECT
    t1.*,
    t1.usage_metadata.job_id as job_id,
    t1.identity_metadata.run_as as run_as,
    t1.usage_quantity * list_prices.pricing.default AS list_cost
  FROM system.billing.usage t1
    INNER JOIN system.billing.list_prices list_prices
      ON
        t1.cloud = list_prices.cloud AND
        t1.sku_name = list_prices.sku_name AND
        t1.usage_start_time >= list_prices.price_start_time AND
        (t1.usage_end_time <= list_prices.price_end_time or list_prices.price_end_time is NULL)
  WHERE
    t1.billing_origin_product = 'JOBS' AND
    t1.usage_date >= CURRENT_DATE() - INTERVAL 14 DAY
),
most_recent_jobs as (
  SELECT
    *,
    ROW_NUMBER() OVER(PARTITION BY workspace_id, job_id ORDER BY change_time DESC) as rn
  FROM
    system.lakeflow.jobs QUALIFY rn=1
)
SELECT
    t2.name
    ,t1.workspace_id
    ,t1.job_id
    ,t1.sku_name
    ,t1.run_as
    ,Last7DaySpend
    ,Last14DaySpend
    ,last7DaySpend - last14DaySpend as Last7DayGrowth
    ,try_divide( (last7DaySpend - last14DaySpend) , last14DaySpend) * 100 AS Last7DayGrowthPct
FROM
  (
    SELECT
      workspace_id,
      job_id,
      run_as,
      sku_name,
      SUM(list_cost) AS spend
      ,SUM(CASE WHEN usage_end_time BETWEEN date_add(current_date(), -8) AND date_add(current_date(), -1) THEN list_cost ELSE 0 END) AS Last7DaySpend
      ,SUM(CASE WHEN usage_end_time BETWEEN date_add(current_date(), -15) AND date_add(current_date(), -8) THEN list_cost ELSE 0 END) AS Last14DaySpend
    FROM job_run_timeline_with_cost
    GROUP BY ALL
  ) t1
  LEFT JOIN most_recent_jobs t2 USING (workspace_id, job_id)
ORDER BY
  Last7DayGrowth DESC
LIMIT 100
運用状態監視クエリ
このダッシュボードがジョブのパフォーマンスと信頼性を追跡するのに役立ついくつかの方法を次に示します。
失敗した作業の分析
このクエリでは、過去 30 日間で失敗した実行の数が多いジョブに関する情報を返します。 実行の数、失敗の数、成功率、およびジョブの失敗した実行のコストを表示できます。
with job_run_timeline_with_cost as (
  SELECT
    t1.*,
    t1.identity_metadata.run_as as run_as,
    t2.job_id,
    t2.run_id,
    t2.result_state,
    t1.usage_quantity * list_prices.pricing.default as list_cost
  FROM system.billing.usage t1
    INNER JOIN system.lakeflow.job_run_timeline t2
      ON
        t1.workspace_id=t2.workspace_id
        AND t1.usage_metadata.job_id = t2.job_id
        AND t1.usage_metadata.job_run_id = t2.run_id
        AND t1.usage_start_time >= date_trunc("Hour", t2.period_start_time)
        AND t1.usage_start_time < date_trunc("Hour", t2.period_end_time) + INTERVAL 1 HOUR
    INNER JOIN system.billing.list_prices list_prices on
      t1.cloud = list_prices.cloud and
      t1.sku_name = list_prices.sku_name and
      t1.usage_start_time >= list_prices.price_start_time and
      (t1.usage_end_time <= list_prices.price_end_time or list_prices.price_end_time is null)
  WHERE
    t1.billing_origin_product = 'JOBS' AND
    t1.usage_date >= CURRENT_DATE() - INTERVAL 30 DAYS
),
cumulative_run_status_cost as (
  SELECT
    workspace_id,
    job_id,
    run_id,
    run_as,
    result_state,
    usage_end_time,
    SUM(list_cost) OVER (ORDER BY workspace_id, job_id, run_id, usage_end_time ROWS BETWEEN UNBOUNDED PRECEDING AND CURRENT ROW) AS cumulative_cost
  FROM job_run_timeline_with_cost
  ORDER BY workspace_id, job_id, run_id, usage_end_time
),
cost_per_status as (
  SELECT
      workspace_id,
      job_id,
      run_id,
      run_as,
      result_state,
      usage_end_time,
      cumulative_cost - COALESCE(LAG(cumulative_cost) OVER (ORDER BY workspace_id, job_id, run_id, usage_end_time), 0) AS result_state_cost
  FROM cumulative_run_status_cost
  WHERE result_state IS NOT NULL
  ORDER BY workspace_id, job_id, run_id, usage_end_time),
cost_per_status_agg as (
  SELECT
    workspace_id,
    job_id,
    FIRST(run_as, TRUE) as run_as,
    SUM(result_state_cost) as list_cost
  FROM cost_per_status
  WHERE
    result_state IN ('ERROR', 'FAILED', 'TIMED_OUT')
  GROUP BY ALL
),
terminal_statues as (
  SELECT
    workspace_id,
    job_id,
    CASE WHEN result_state IN ('ERROR', 'FAILED', 'TIMED_OUT') THEN 1 ELSE 0 END as is_failure,
    period_end_time as last_seen_date
  FROM system.lakeflow.job_run_timeline
  WHERE
    result_state IS NOT NULL AND
    period_end_time >= CURRENT_DATE() - INTERVAL 30 DAYS
),
most_recent_jobs as (
  SELECT
    *,
    ROW_NUMBER() OVER(PARTITION BY workspace_id, job_id ORDER BY change_time DESC) as rn
  FROM
    system.lakeflow.jobs QUALIFY rn=1
)
SELECT
  first(t2.name) as name,
  t1.workspace_id,
  t1.job_id,
  COUNT(*) as runs,
  t3.run_as,
  SUM(is_failure) as failures,
  (1 - COALESCE(try_divide(SUM(is_failure), COUNT(*)), 0)) * 100 as success_ratio,
  first(t3.list_cost) as failure_list_cost,
  MAX(t1.last_seen_date) as last_seen_date
FROM terminal_statues t1
  LEFT JOIN most_recent_jobs t2 USING (workspace_id, job_id)
  LEFT JOIN cost_per_status_agg t3 USING (workspace_id, job_id)
GROUP BY ALL
ORDER BY failures DESC
再試行パターン
このクエリは、過去 30 日間に頻繁に修復されたジョブに関する情報を返します。これには、修復の回数、修復実行のコスト、修復の実行の累積期間が含まれます。
with job_run_timeline_with_cost as (
 SELECT
   t1.*,
   t2.job_id,
   t2.run_id,
   t1.identity_metadata.run_as as run_as,
   t2.result_state,
   t1.usage_quantity * list_prices.pricing.default as list_cost
 FROM system.billing.usage t1
   INNER JOIN system.lakeflow.job_run_timeline t2
     ON
       t1.workspace_id=t2.workspace_id
       AND t1.usage_metadata.job_id = t2.job_id
       AND t1.usage_metadata.job_run_id = t2.run_id
       AND t1.usage_start_time >= date_trunc("Hour", t2.period_start_time)
       AND t1.usage_start_time < date_trunc("Hour", t2.period_end_time) + INTERVAL 1 HOUR
   INNER JOIN system.billing.list_prices list_prices on
     t1.cloud = list_prices.cloud and
     t1.sku_name = list_prices.sku_name and
     t1.usage_start_time >= list_prices.price_start_time and
     (t1.usage_end_time <= list_prices.price_end_time or list_prices.price_end_time is null)
 WHERE
   t1.billing_origin_product = 'JOBS' AND
   t1.usage_date >= CURRENT_DATE() - INTERVAL 30 DAYS
),
cumulative_run_status_cost as (
 SELECT
   workspace_id,
   job_id,
   run_id,
   run_as,
   result_state,
   usage_end_time,
   SUM(list_cost) OVER (ORDER BY workspace_id, job_id, run_id, usage_end_time ROWS BETWEEN UNBOUNDED PRECEDING AND CURRENT ROW) AS cumulative_cost
 FROM job_run_timeline_with_cost
 ORDER BY workspace_id, job_id, run_id, usage_end_time
),
cost_per_status as (
 SELECT
     workspace_id,
     job_id,
     run_id,
     run_as,
     result_state,
     usage_end_time,
     cumulative_cost - COALESCE(LAG(cumulative_cost) OVER (ORDER BY workspace_id, job_id, run_id, usage_end_time), 0) AS result_state_cost
 FROM cumulative_run_status_cost
 WHERE result_state IS NOT NULL
 ORDER BY workspace_id, job_id, run_id, usage_end_time),
cost_per_unsuccesful_status_agg as (
 SELECT
   workspace_id,
   job_id,
   run_id,
   first(run_as, TRUE) as run_as,
   SUM(result_state_cost) as list_cost
 FROM cost_per_status
 WHERE
   result_state != "SUCCEEDED"
 GROUP BY ALL
),
repaired_runs as (
 SELECT
   workspace_id, job_id, run_id, COUNT(*) as cnt
 FROM system.lakeflow.job_run_timeline
 WHERE result_state IS NOT NULL
 GROUP BY ALL
 HAVING cnt > 1
),
successful_repairs as (
 SELECT t1.workspace_id, t1.job_id, t1.run_id, MAX(t1.period_end_time) as period_end_time
 FROM system.lakeflow.job_run_timeline t1
 JOIN repaired_runs t2
 ON t1.workspace_id=t2.workspace_id AND t1.job_id=t2.job_id AND t1.run_id=t2.run_id
 WHERE t1.result_state="SUCCEEDED"
 GROUP BY ALL
),
combined_repairs as (
 SELECT
   t1.*,
   t2.period_end_time,
   t1.cnt as repairs
 FROM repaired_runs t1
   LEFT JOIN successful_repairs t2 USING (workspace_id, job_id, run_id)
),
most_recent_jobs as (
 SELECT
   *,
   ROW_NUMBER() OVER(PARTITION BY workspace_id, job_id ORDER BY change_time DESC) as rn
 FROM
   system.lakeflow.jobs QUALIFY rn=1
)
SELECT
 last(t3.name) as name,
 t1.workspace_id,
 t1.job_id,
 t1.run_id,
 first(t4.run_as, TRUE) as run_as,
 first(t1.repairs) - 1 as repairs,
 first(t4.list_cost) as repair_list_cost,
 CASE WHEN t1.period_end_time IS NOT NULL THEN CAST(t1.period_end_time - MIN(t2.period_end_time) as LONG) ELSE NULL END AS repair_time_seconds
FROM combined_repairs t1
 JOIN system.lakeflow.job_run_timeline t2 USING (workspace_id, job_id, run_id)
 LEFT JOIN most_recent_jobs t3 USING (workspace_id, job_id)
 LEFT JOIN cost_per_unsuccesful_status_agg t4 USING (workspace_id, job_id, run_id)
WHERE
 t2.result_state IS NOT NULL
GROUP BY t1.workspace_id, t1.job_id, t1.run_id, t1.period_end_time
ORDER BY repairs DESC