Event Grid リソースについての診断ログを有効にする
この記事では、Event Grid リソースの診断設定を有効にする手順について詳しく説明します。 これらの設定を使用すると、エラーのトラブルシューティングを行えるように、情報をキャプチャして表示できます。 次の表は、さまざまな種類の Event Grid リソース (カスタム トピック、システム トピック、ドメイン) に使用できる設定を示しています。
| 診断設定 | Event Grid トピック | Event Grid システム トピック | イベント ドメイン | Event Grid のパートナー名前空間 |
|---|---|---|---|---|
| DeliveryFailures | はい | イエス | 有効 | いいえ |
| PublishFailures | はい | No | イエス | はい |
| DataPlaneRequests | はい | No | イエス | はい |
重要
配信エラー、発行エラー、データ プレーン要求のスキーマについては、診断ログに関するページをご覧ください。
前提条件
- プロビジョニングされた Event Grid リソース
- 診断ログのキャプチャに使用するプロビジョニングされた宛先。
- Log Analytics ワークスペース
- ストレージ アカウント
- Event Hubs
- パートナー ソリューション
Event Grid のトピックとドメインの診断ログを有効にする
注意
ここでは、トピックの診断ログを有効にする手順について詳しく説明します。 ドメインの診断ログを有効にする手順もよく似ています。 手順 2 で、Azure portal 内の Event Grid ドメインに移動します。
Azure portal にサインインします。
診断ログ設定を有効にする Event Grid トピックに移動します。
上部の検索バーで、"Event Grid トピック" を検索します。
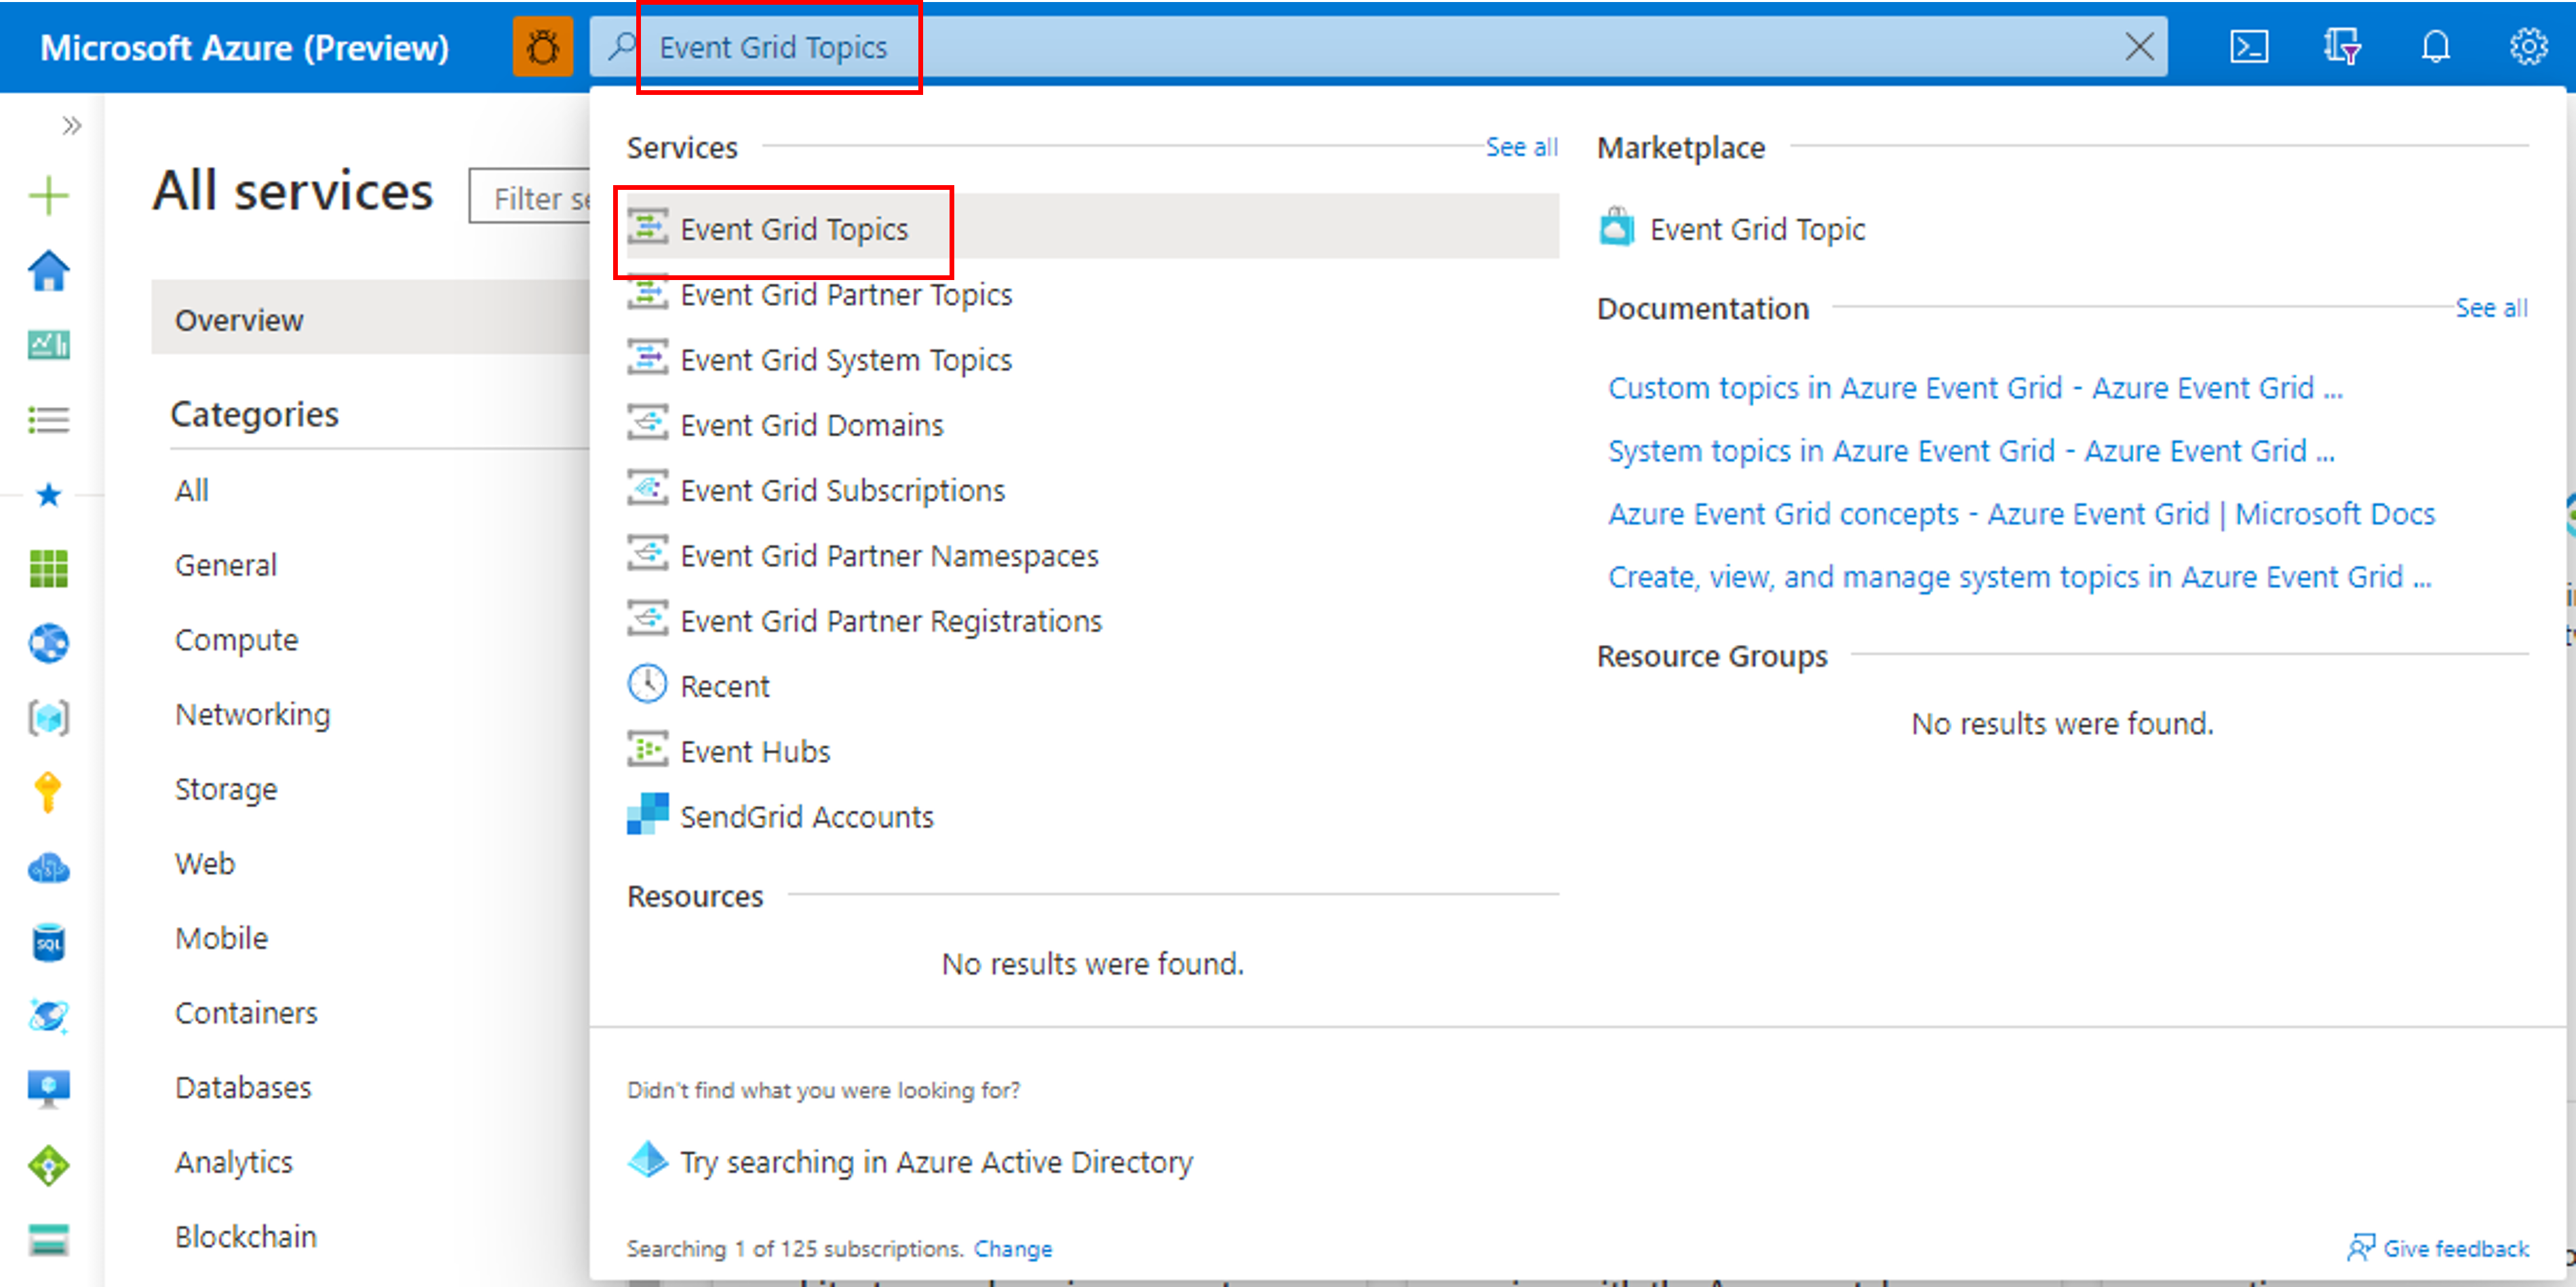
診断設定を構成するリストから、 [トピック] を選択します。
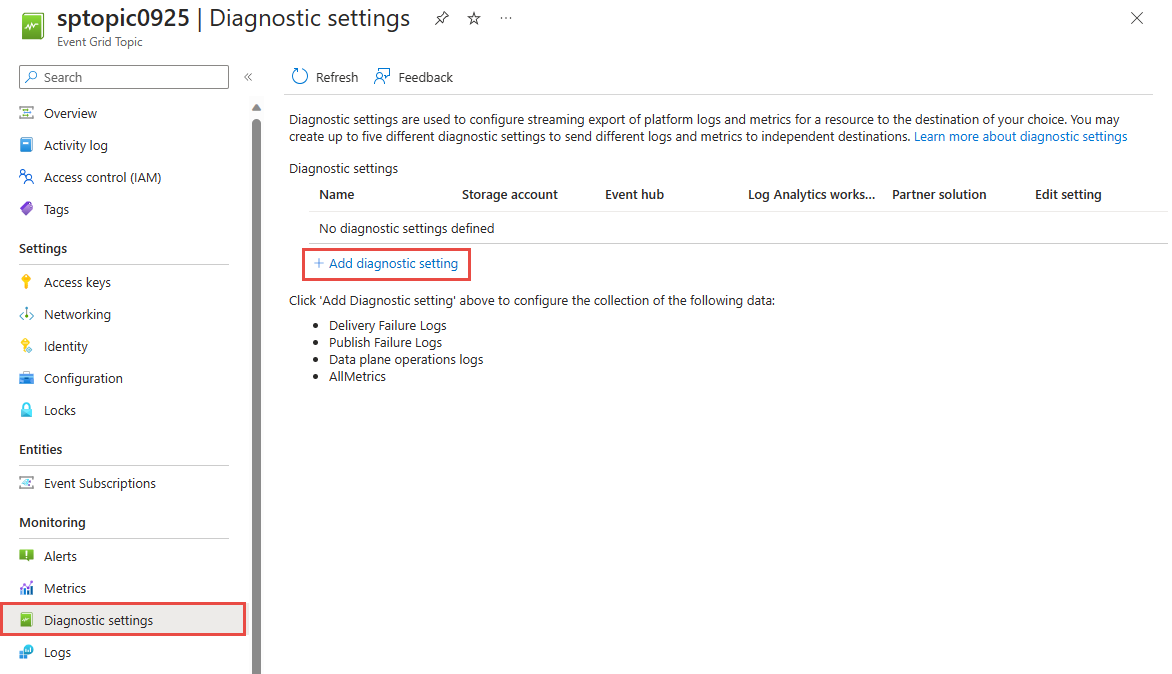
左側のメニューの [監視] の下にある [診断設定] を選択します。
[診断設定] ページで、 [Add New Diagnostic Setting](新しい診断設定の追加) を選択します。
診断設定の [名前] を指定します。
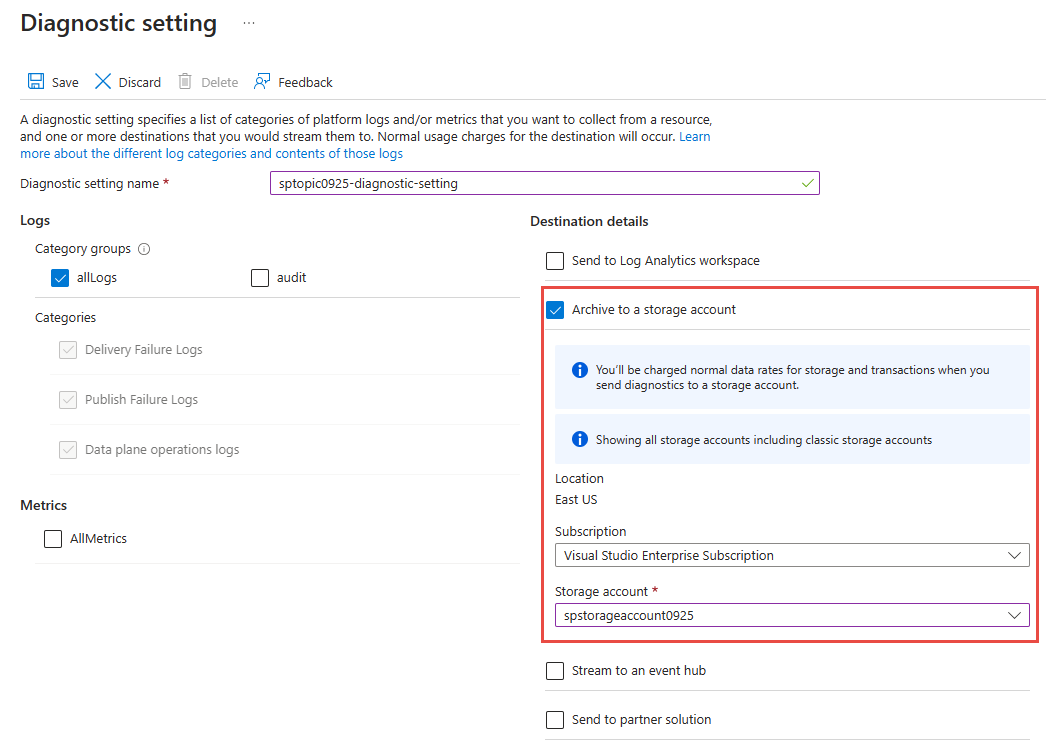
[ログ] セクションで [allLogs] オプションを選択します。
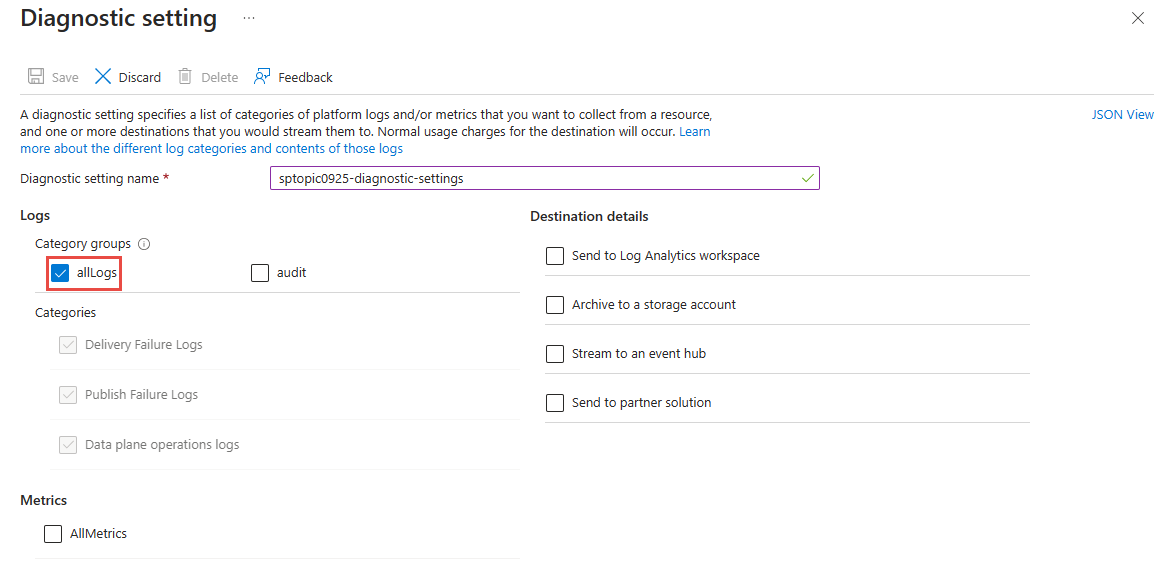
ログの 1 つまたは複数のキャプチャ先を有効にしてから、前に作成したキャプチャ リソースを選択して構成します。
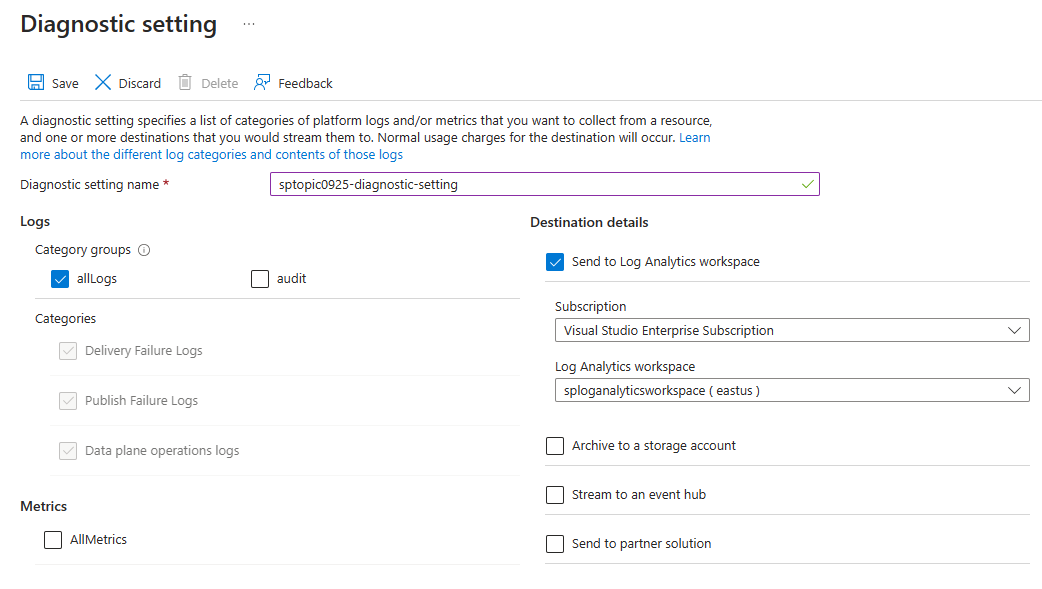
[Log Analytics への送信] を選択した場合は、Log Analytics ワークスペースを選択します。
[ストレージ アカウントへのアーカイブ] を選択した場合は、 [ストレージ アカウント - 構成] を選択してから、Azure サブスクリプションのストレージ アカウントを選択します。
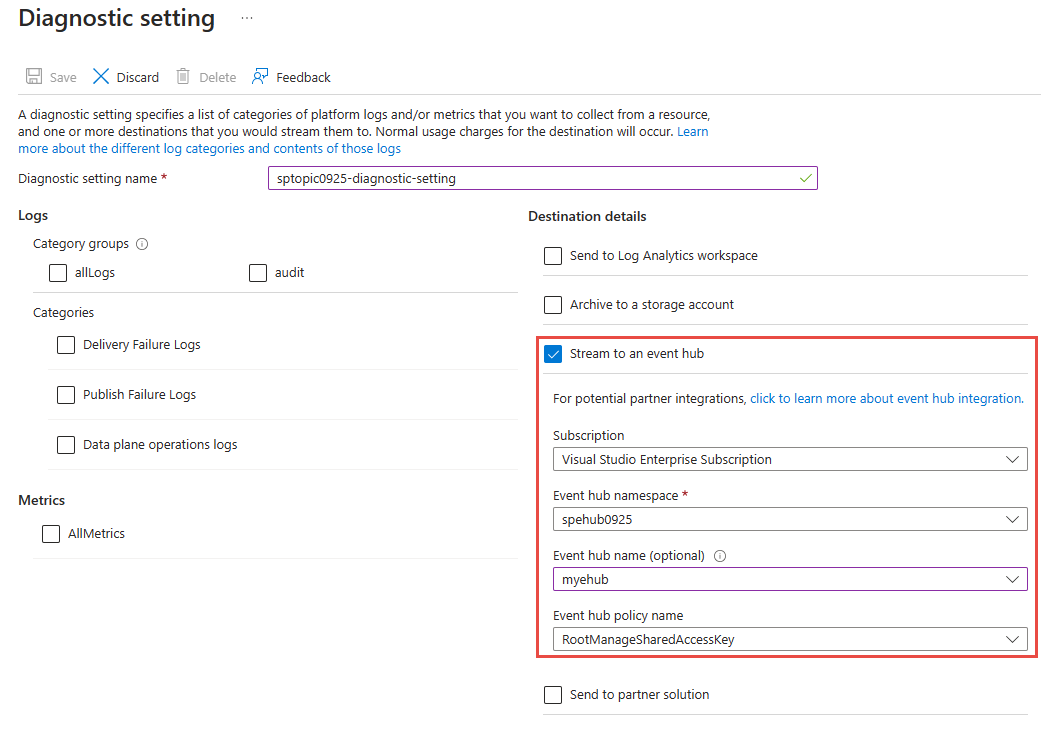
[イベント ハブへのストリーム] を選択した場合は、 [イベント ハブ - 構成] を選択してから、Event Hubs 名前空間、イベント ハブ、およびアクセス ポリシーを選択します。
[保存] を選択します。 次に、右上隅にある [X] を選択して、ページを閉じます。
次に [診断設定] ページに戻り、 [診断設定] テーブルに新しいエントリが表示されていることを確認します。
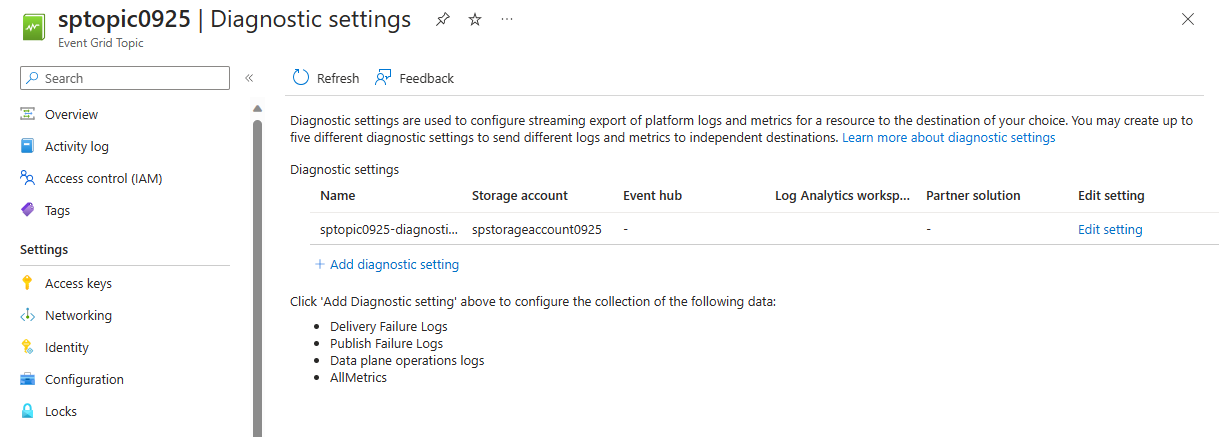
また、トピックのすべてのメトリックの収集を有効にすることもできます。
Event Grid システム トピックについての診断ログを有効にする
- Azure portal にサインインします。
- 診断ログ設定を有効にするシステム トピックに移動します。
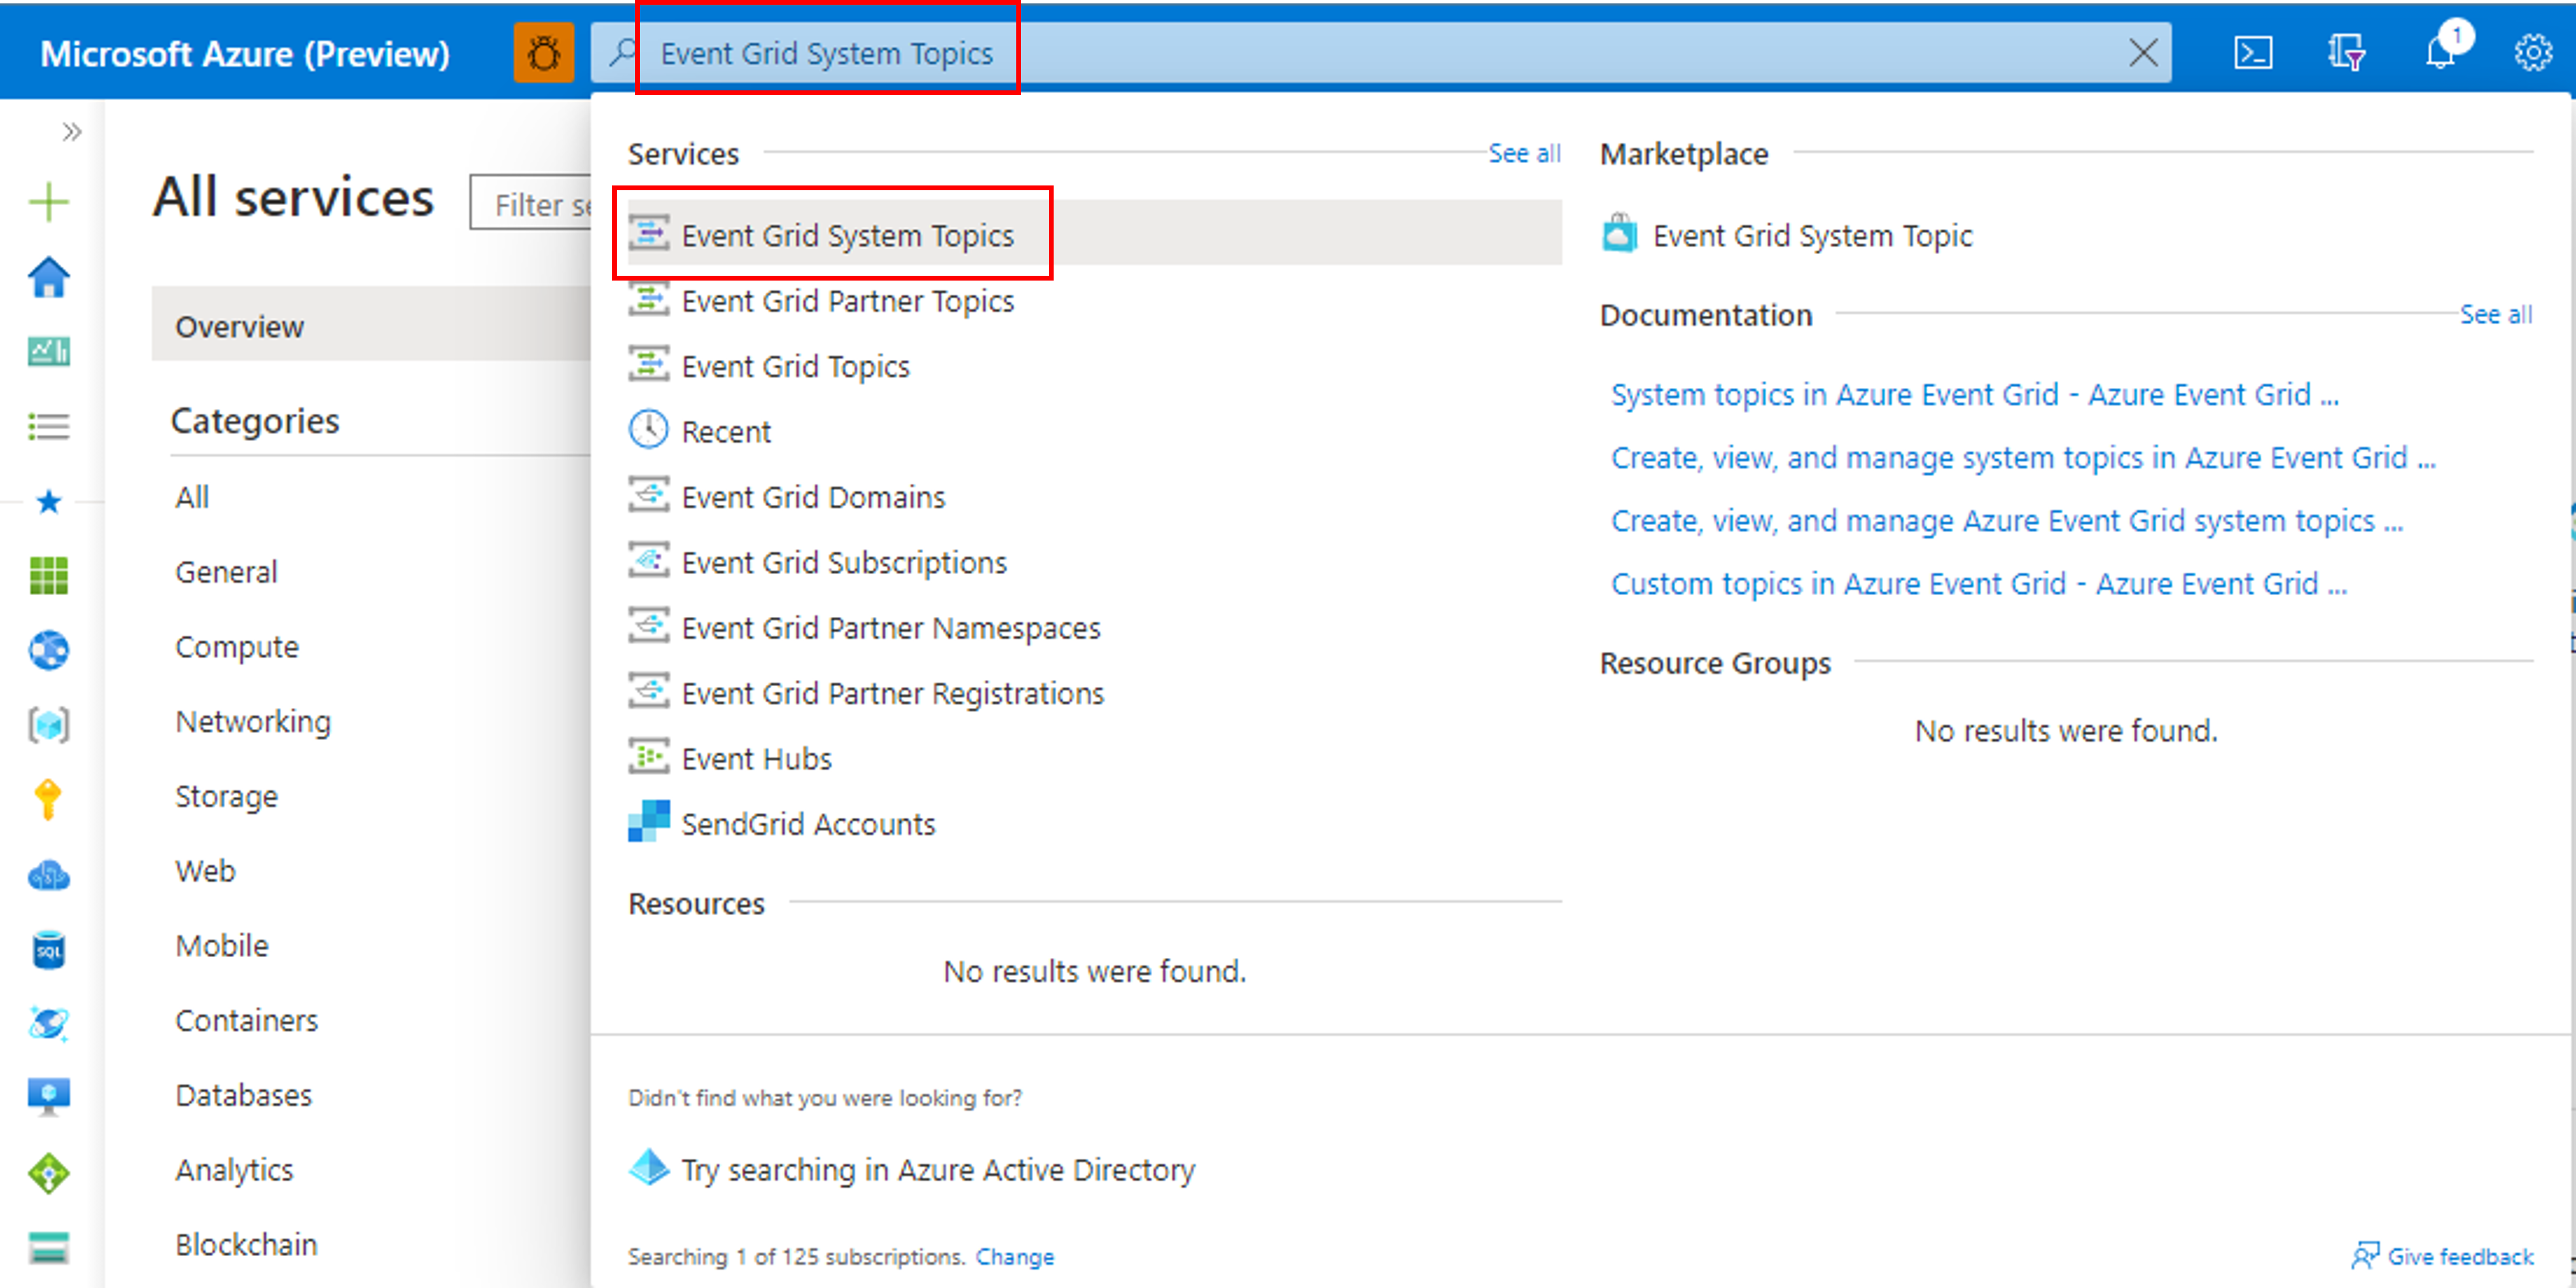
- 上部の検索バーで、"Event Grid システム トピック" を検索します。
- 診断設定を構成する [システム トピック] を選択します。
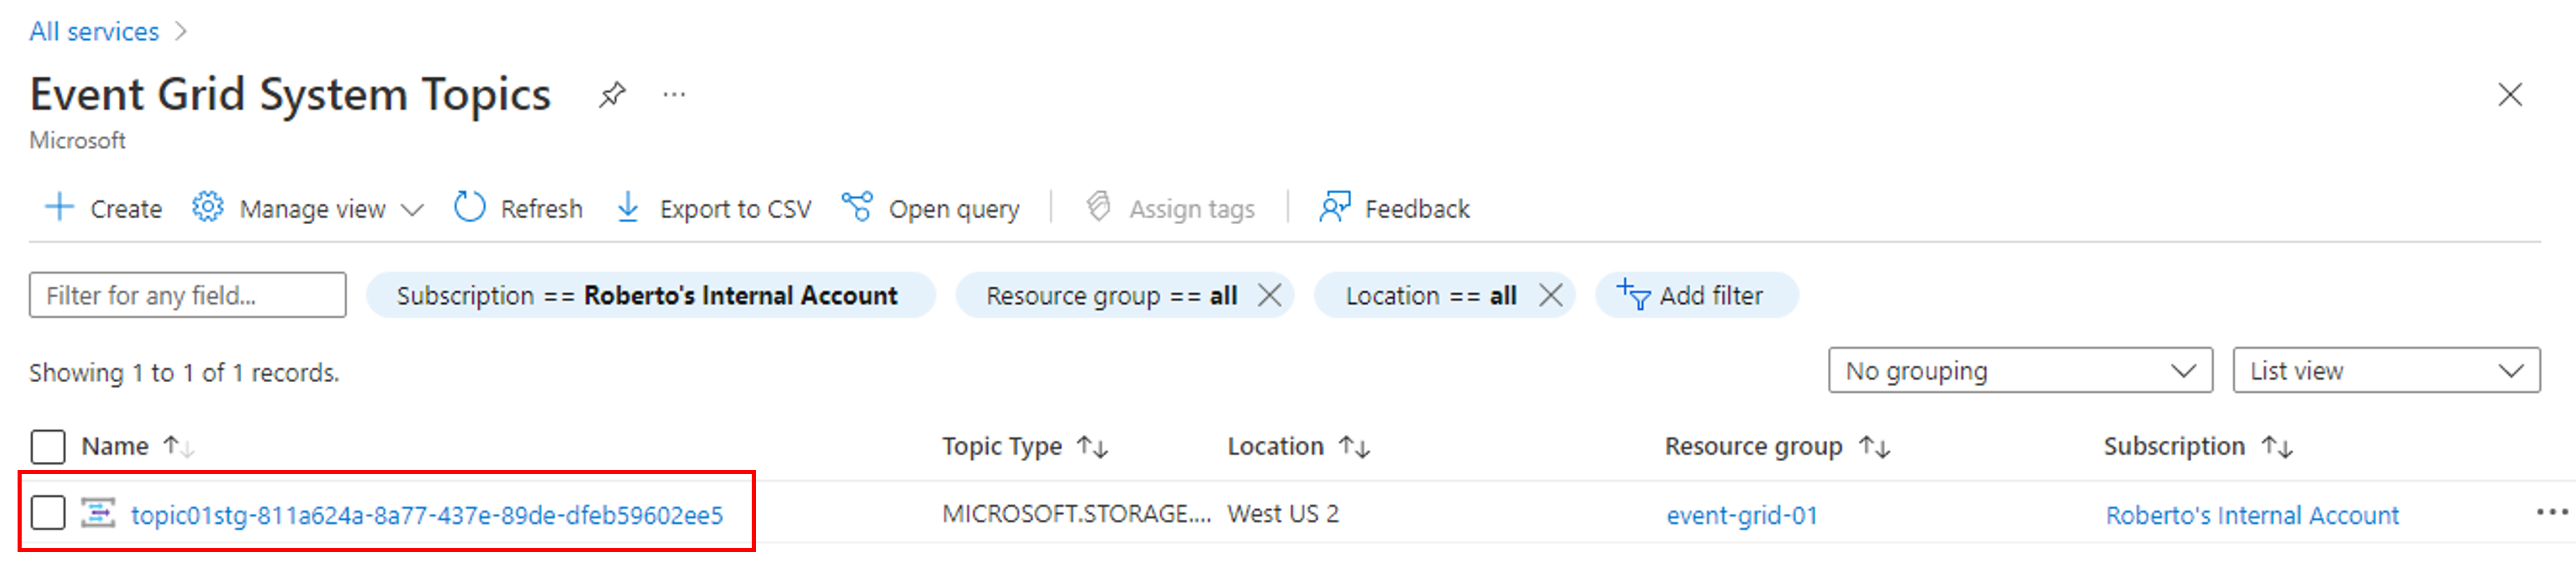
- 上部の検索バーで、"Event Grid システム トピック" を検索します。
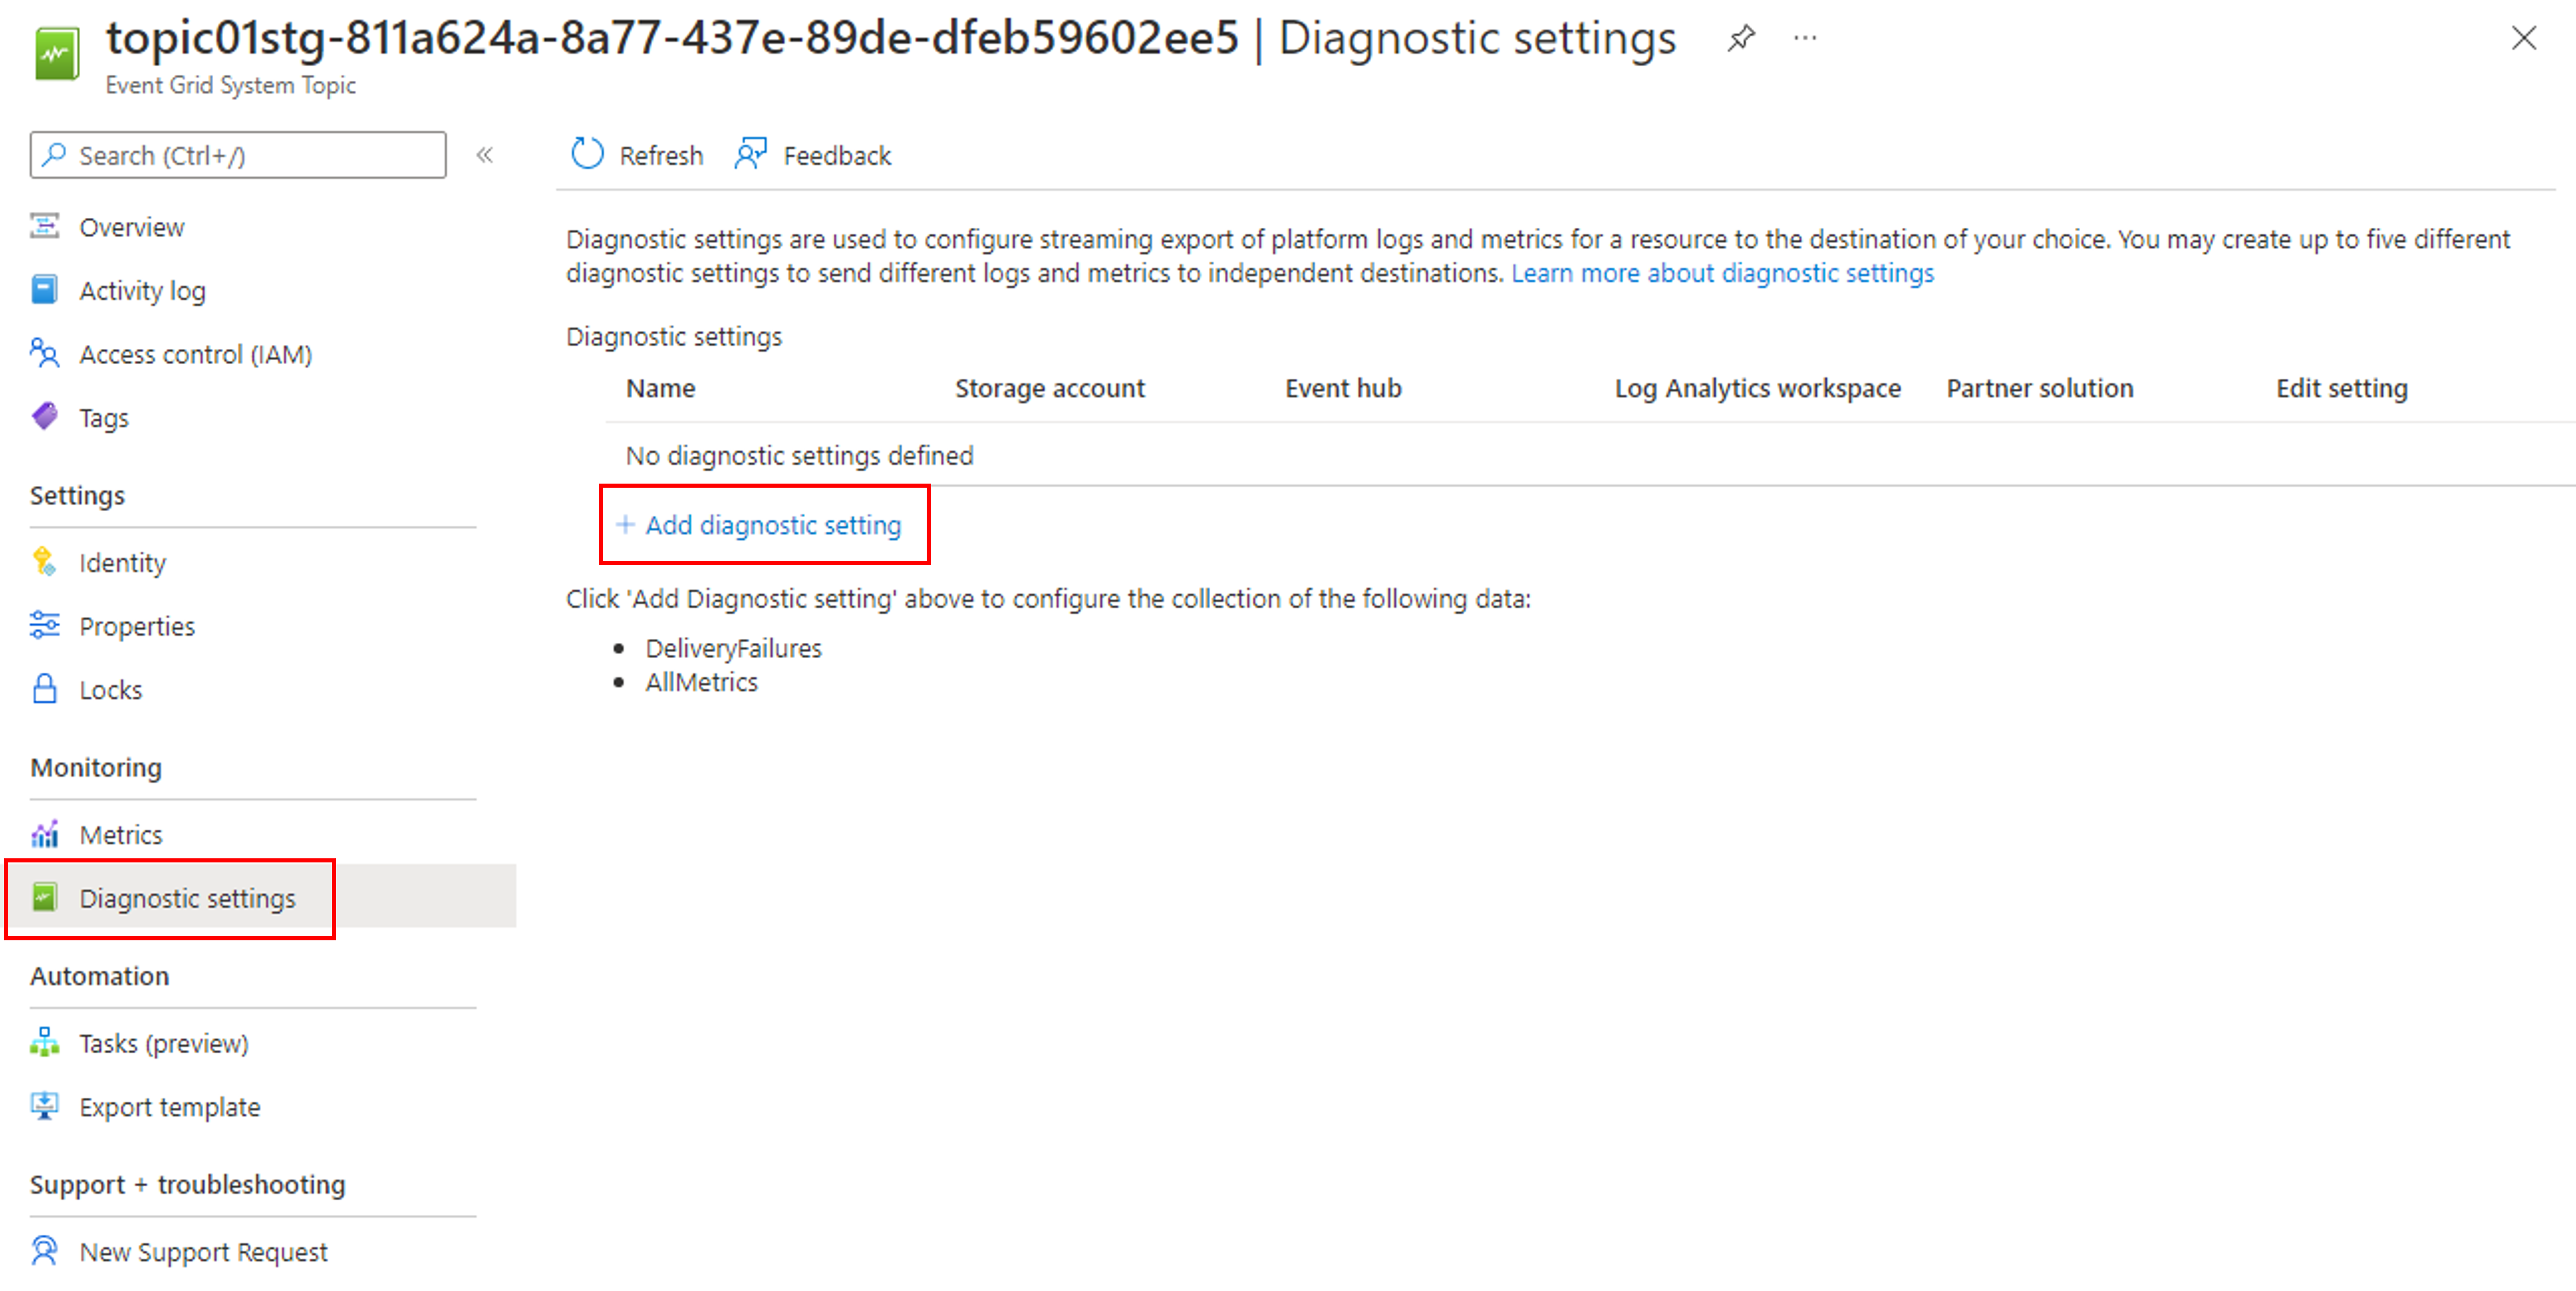
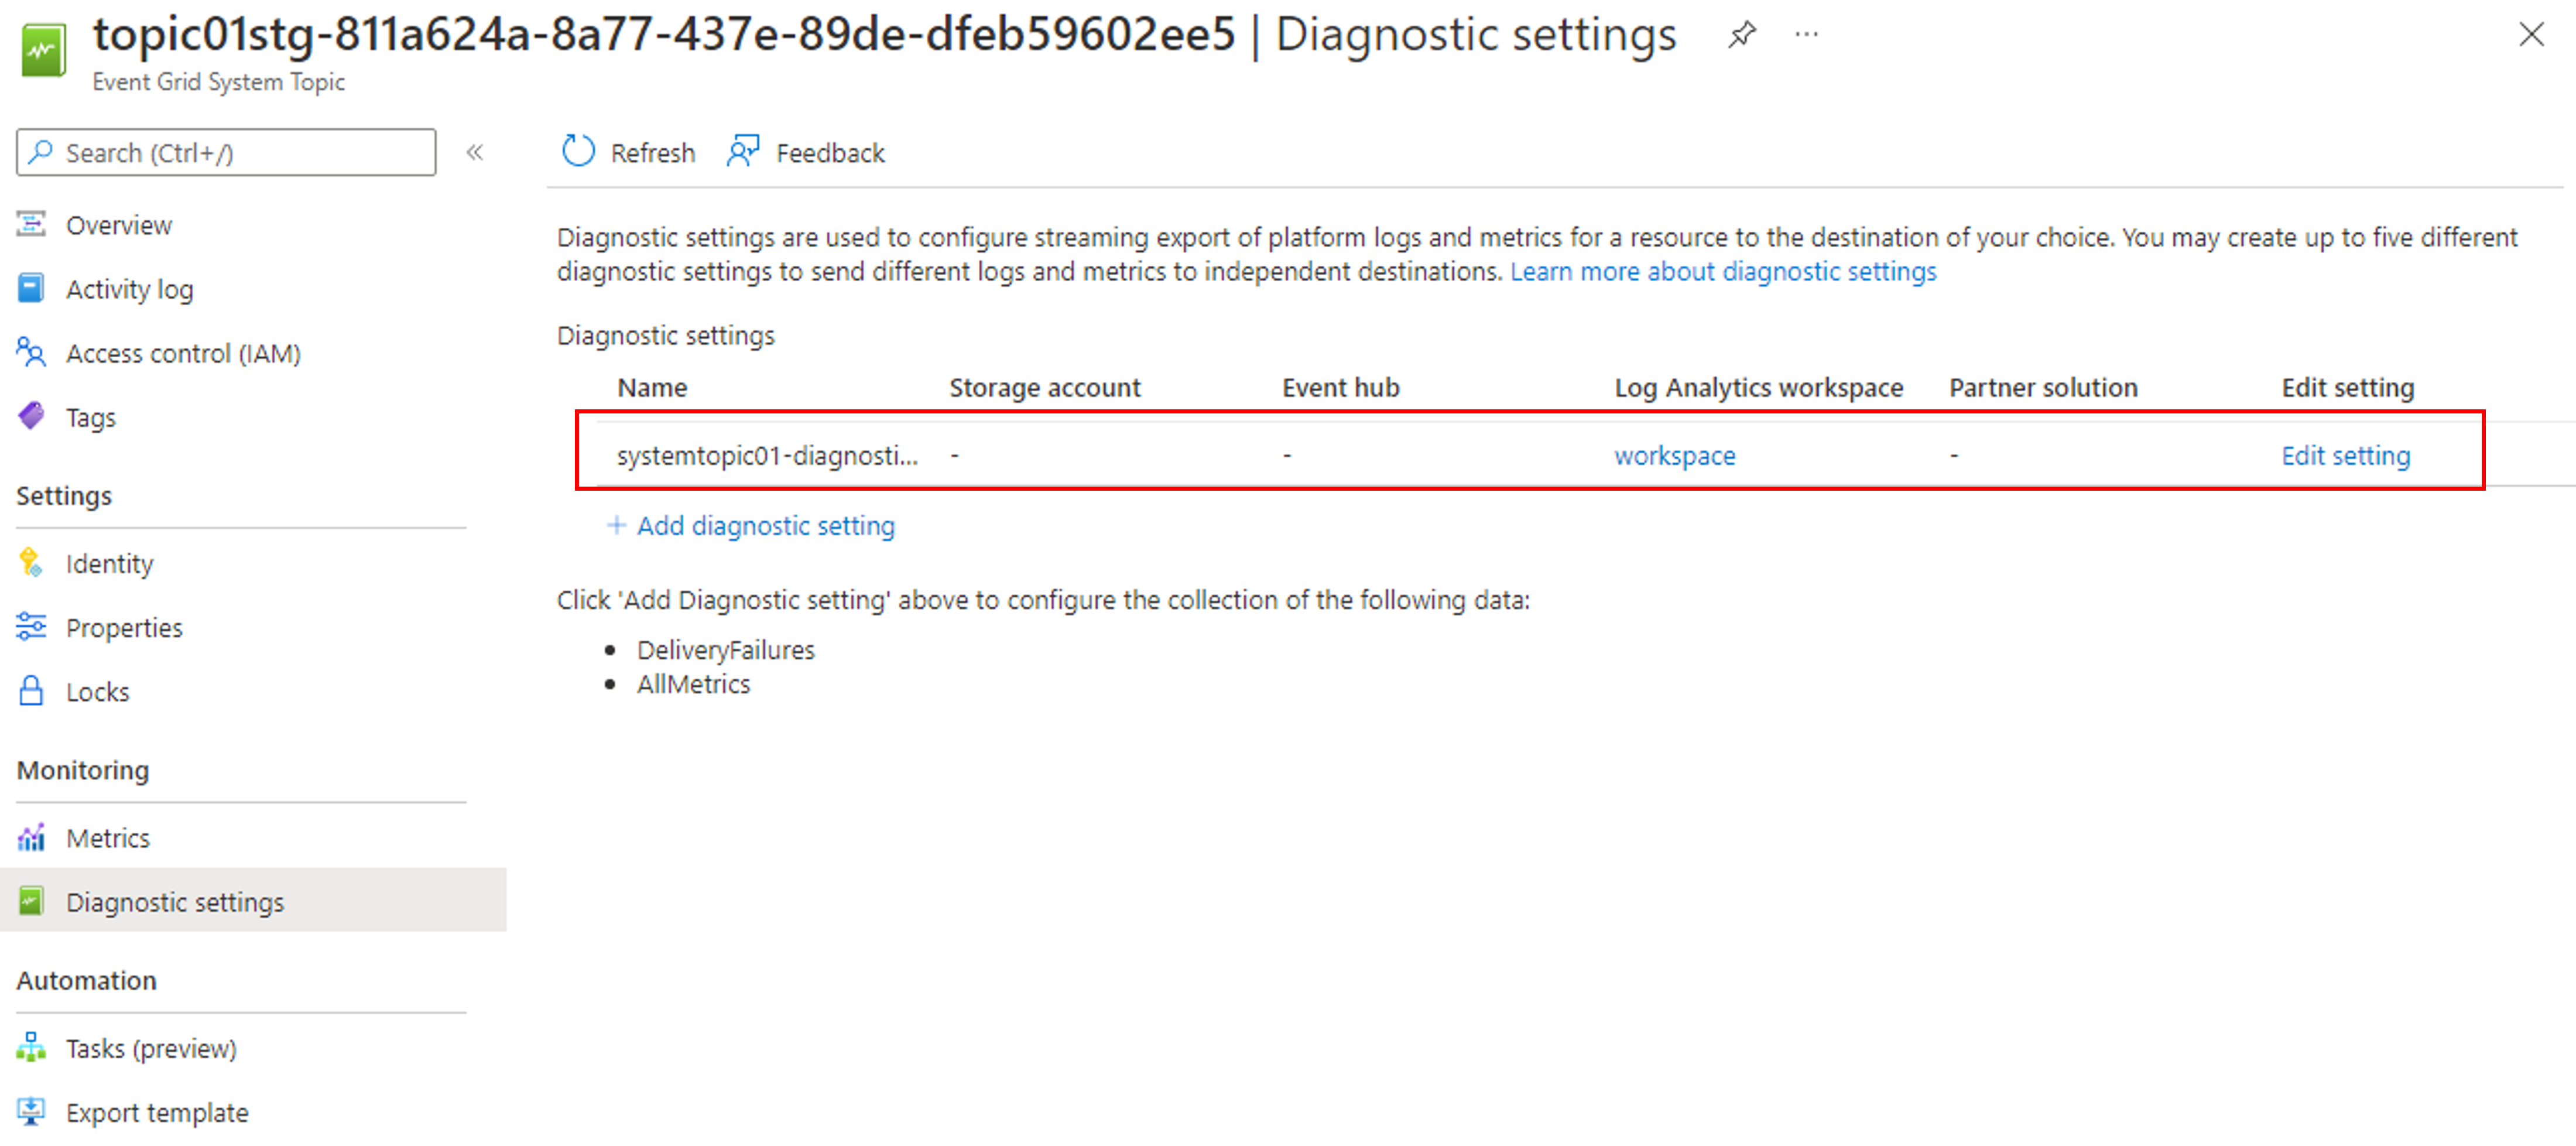
- 左側のペインで [監視] の下の [診断設定] を選択してから、 [Add diagnostic setting](診断設定の追加) を選択します。
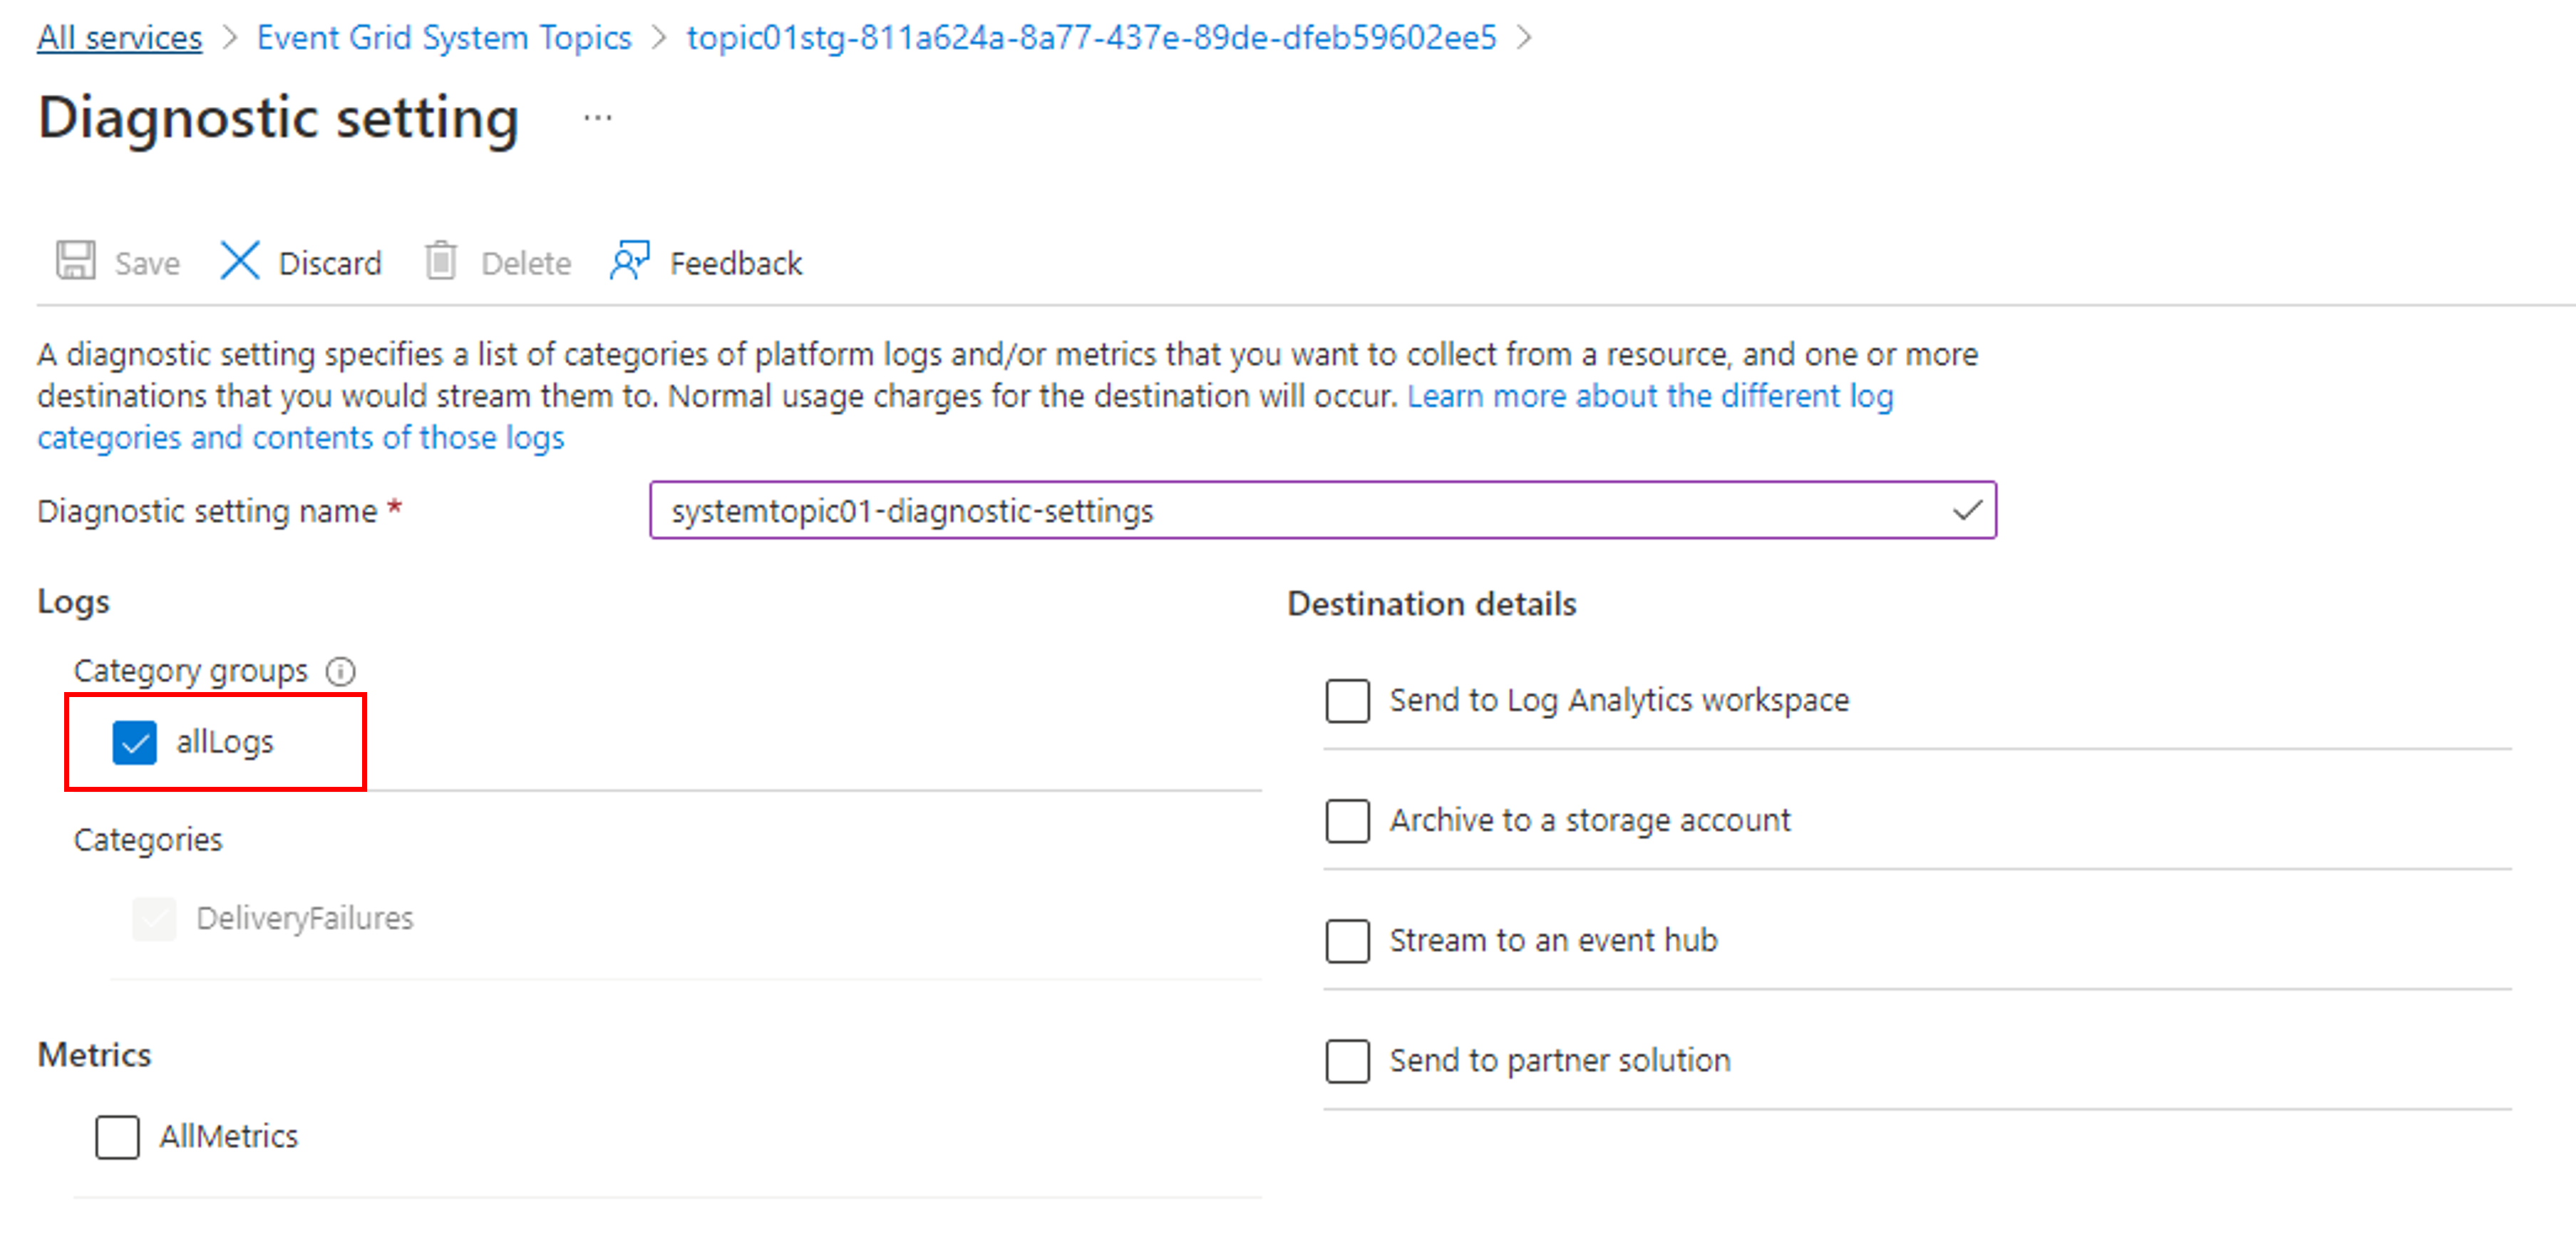
- 診断設定の [名前] を指定します。
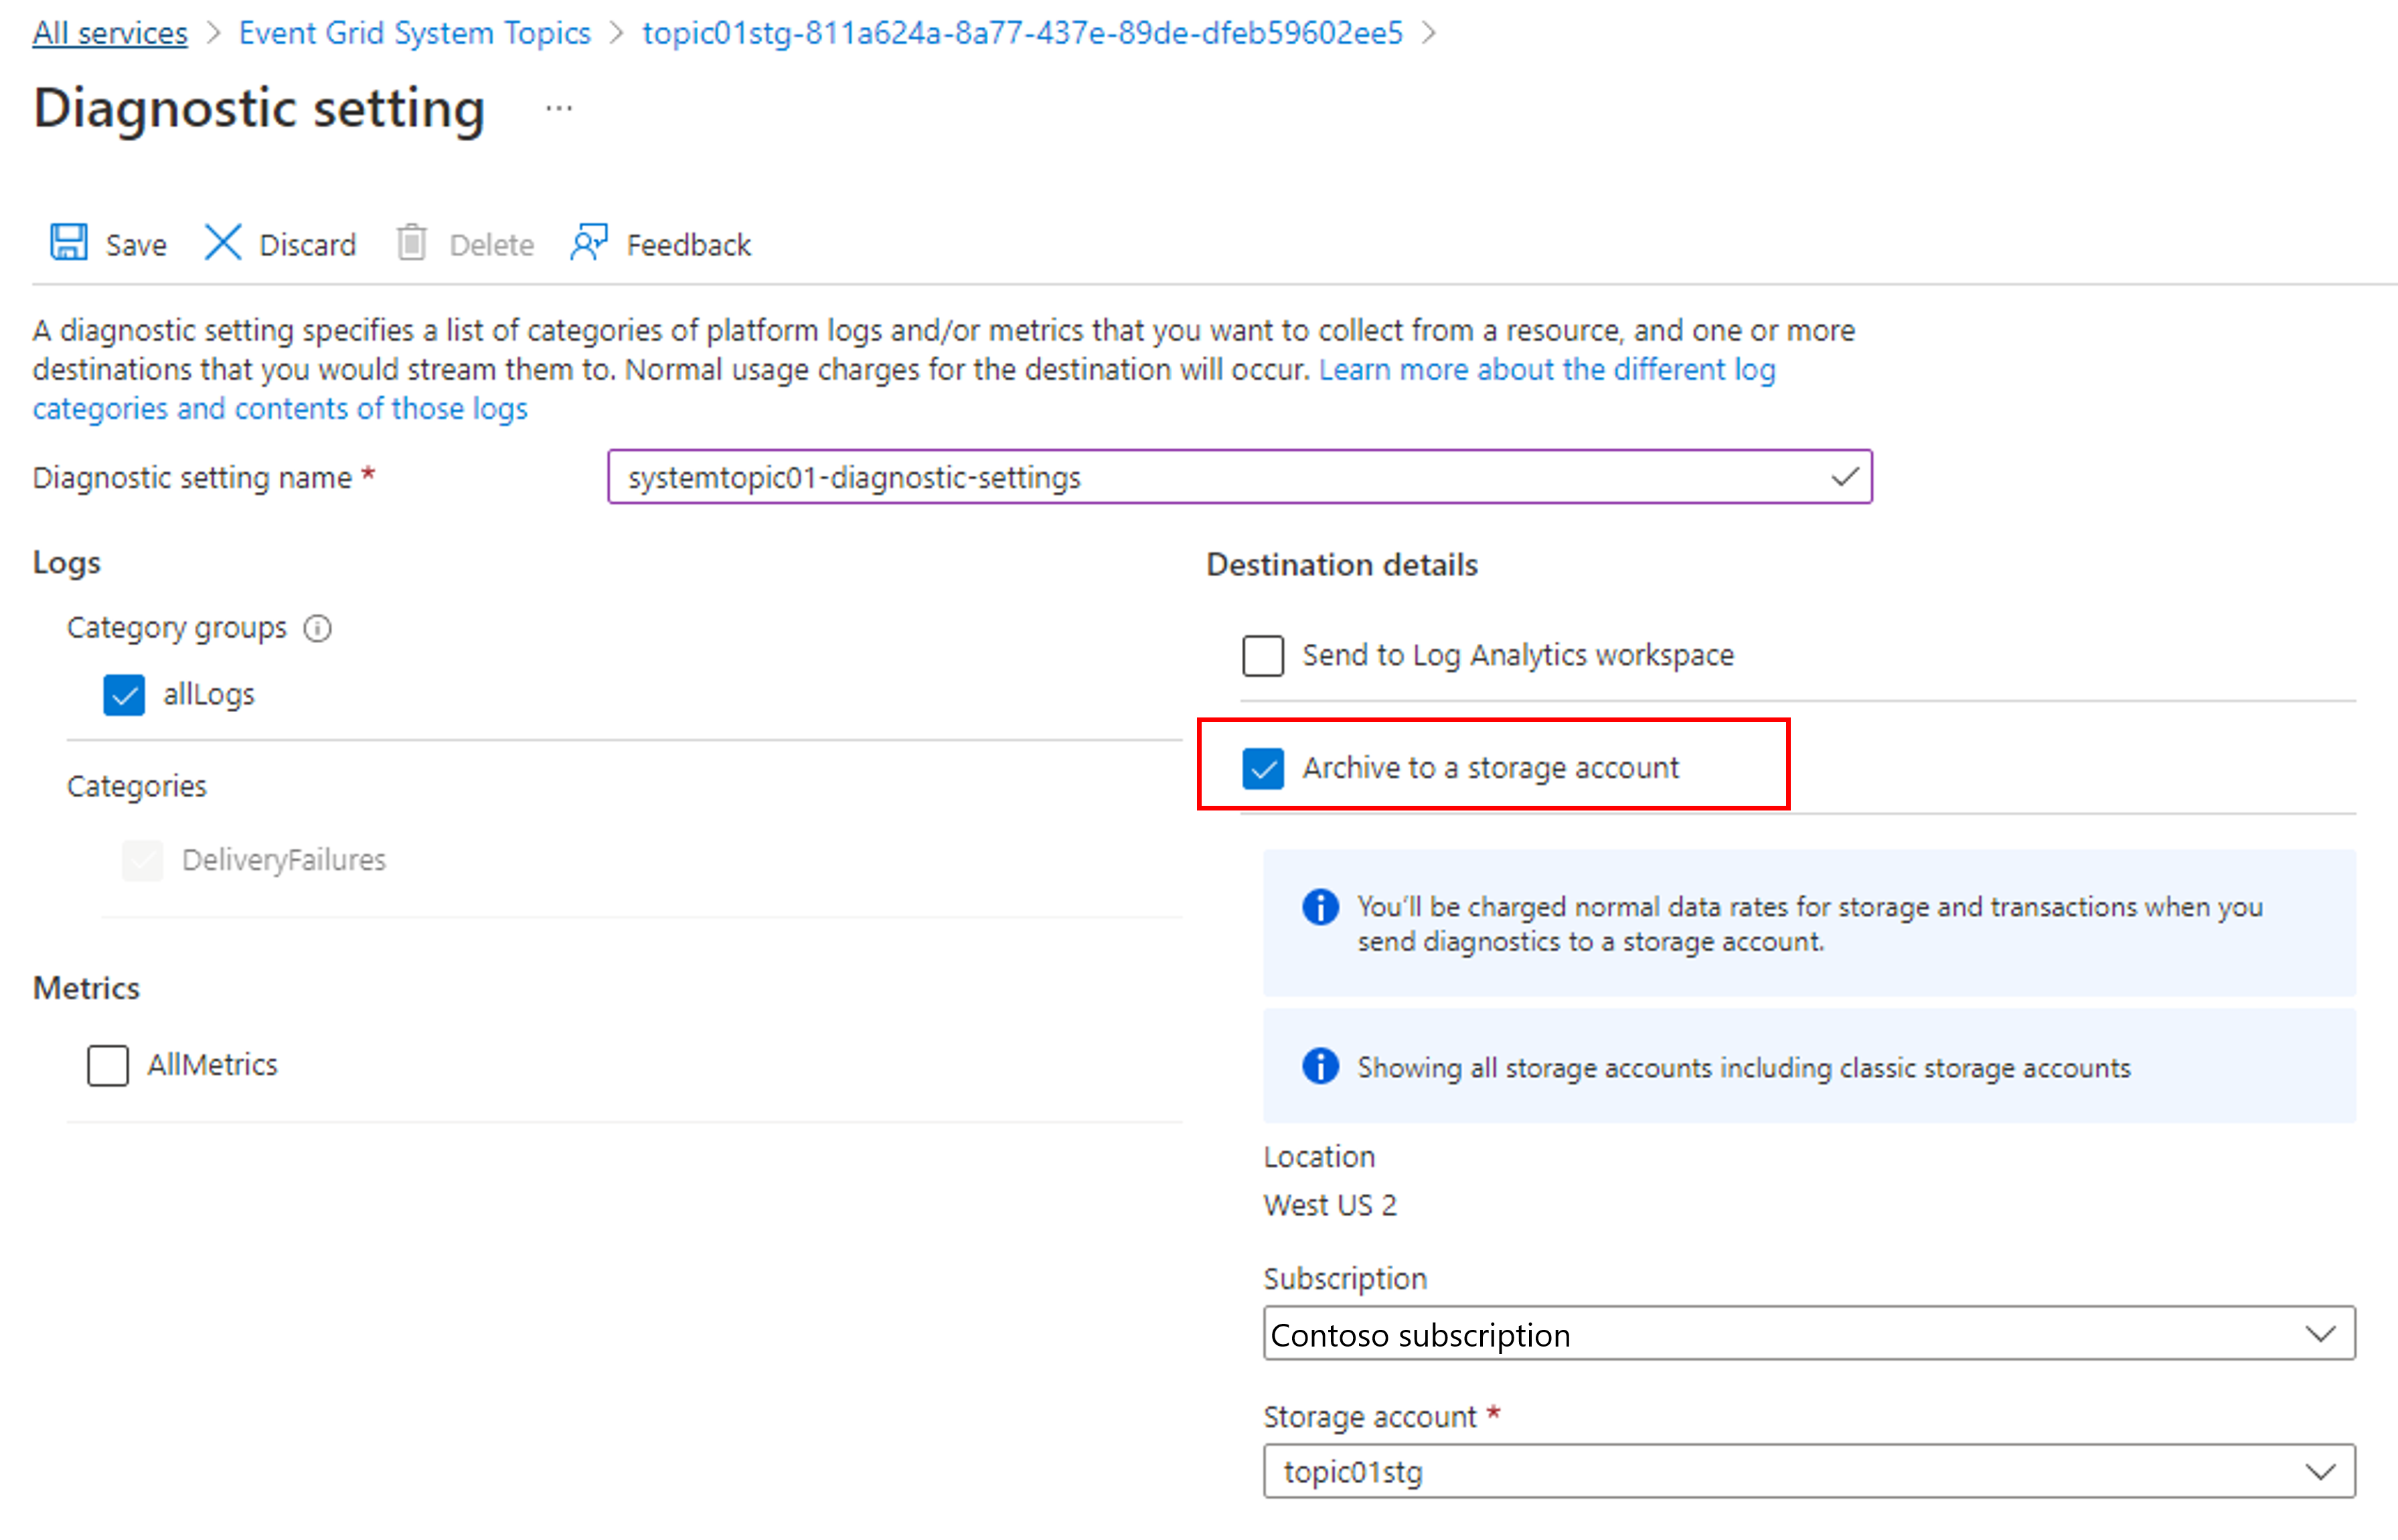
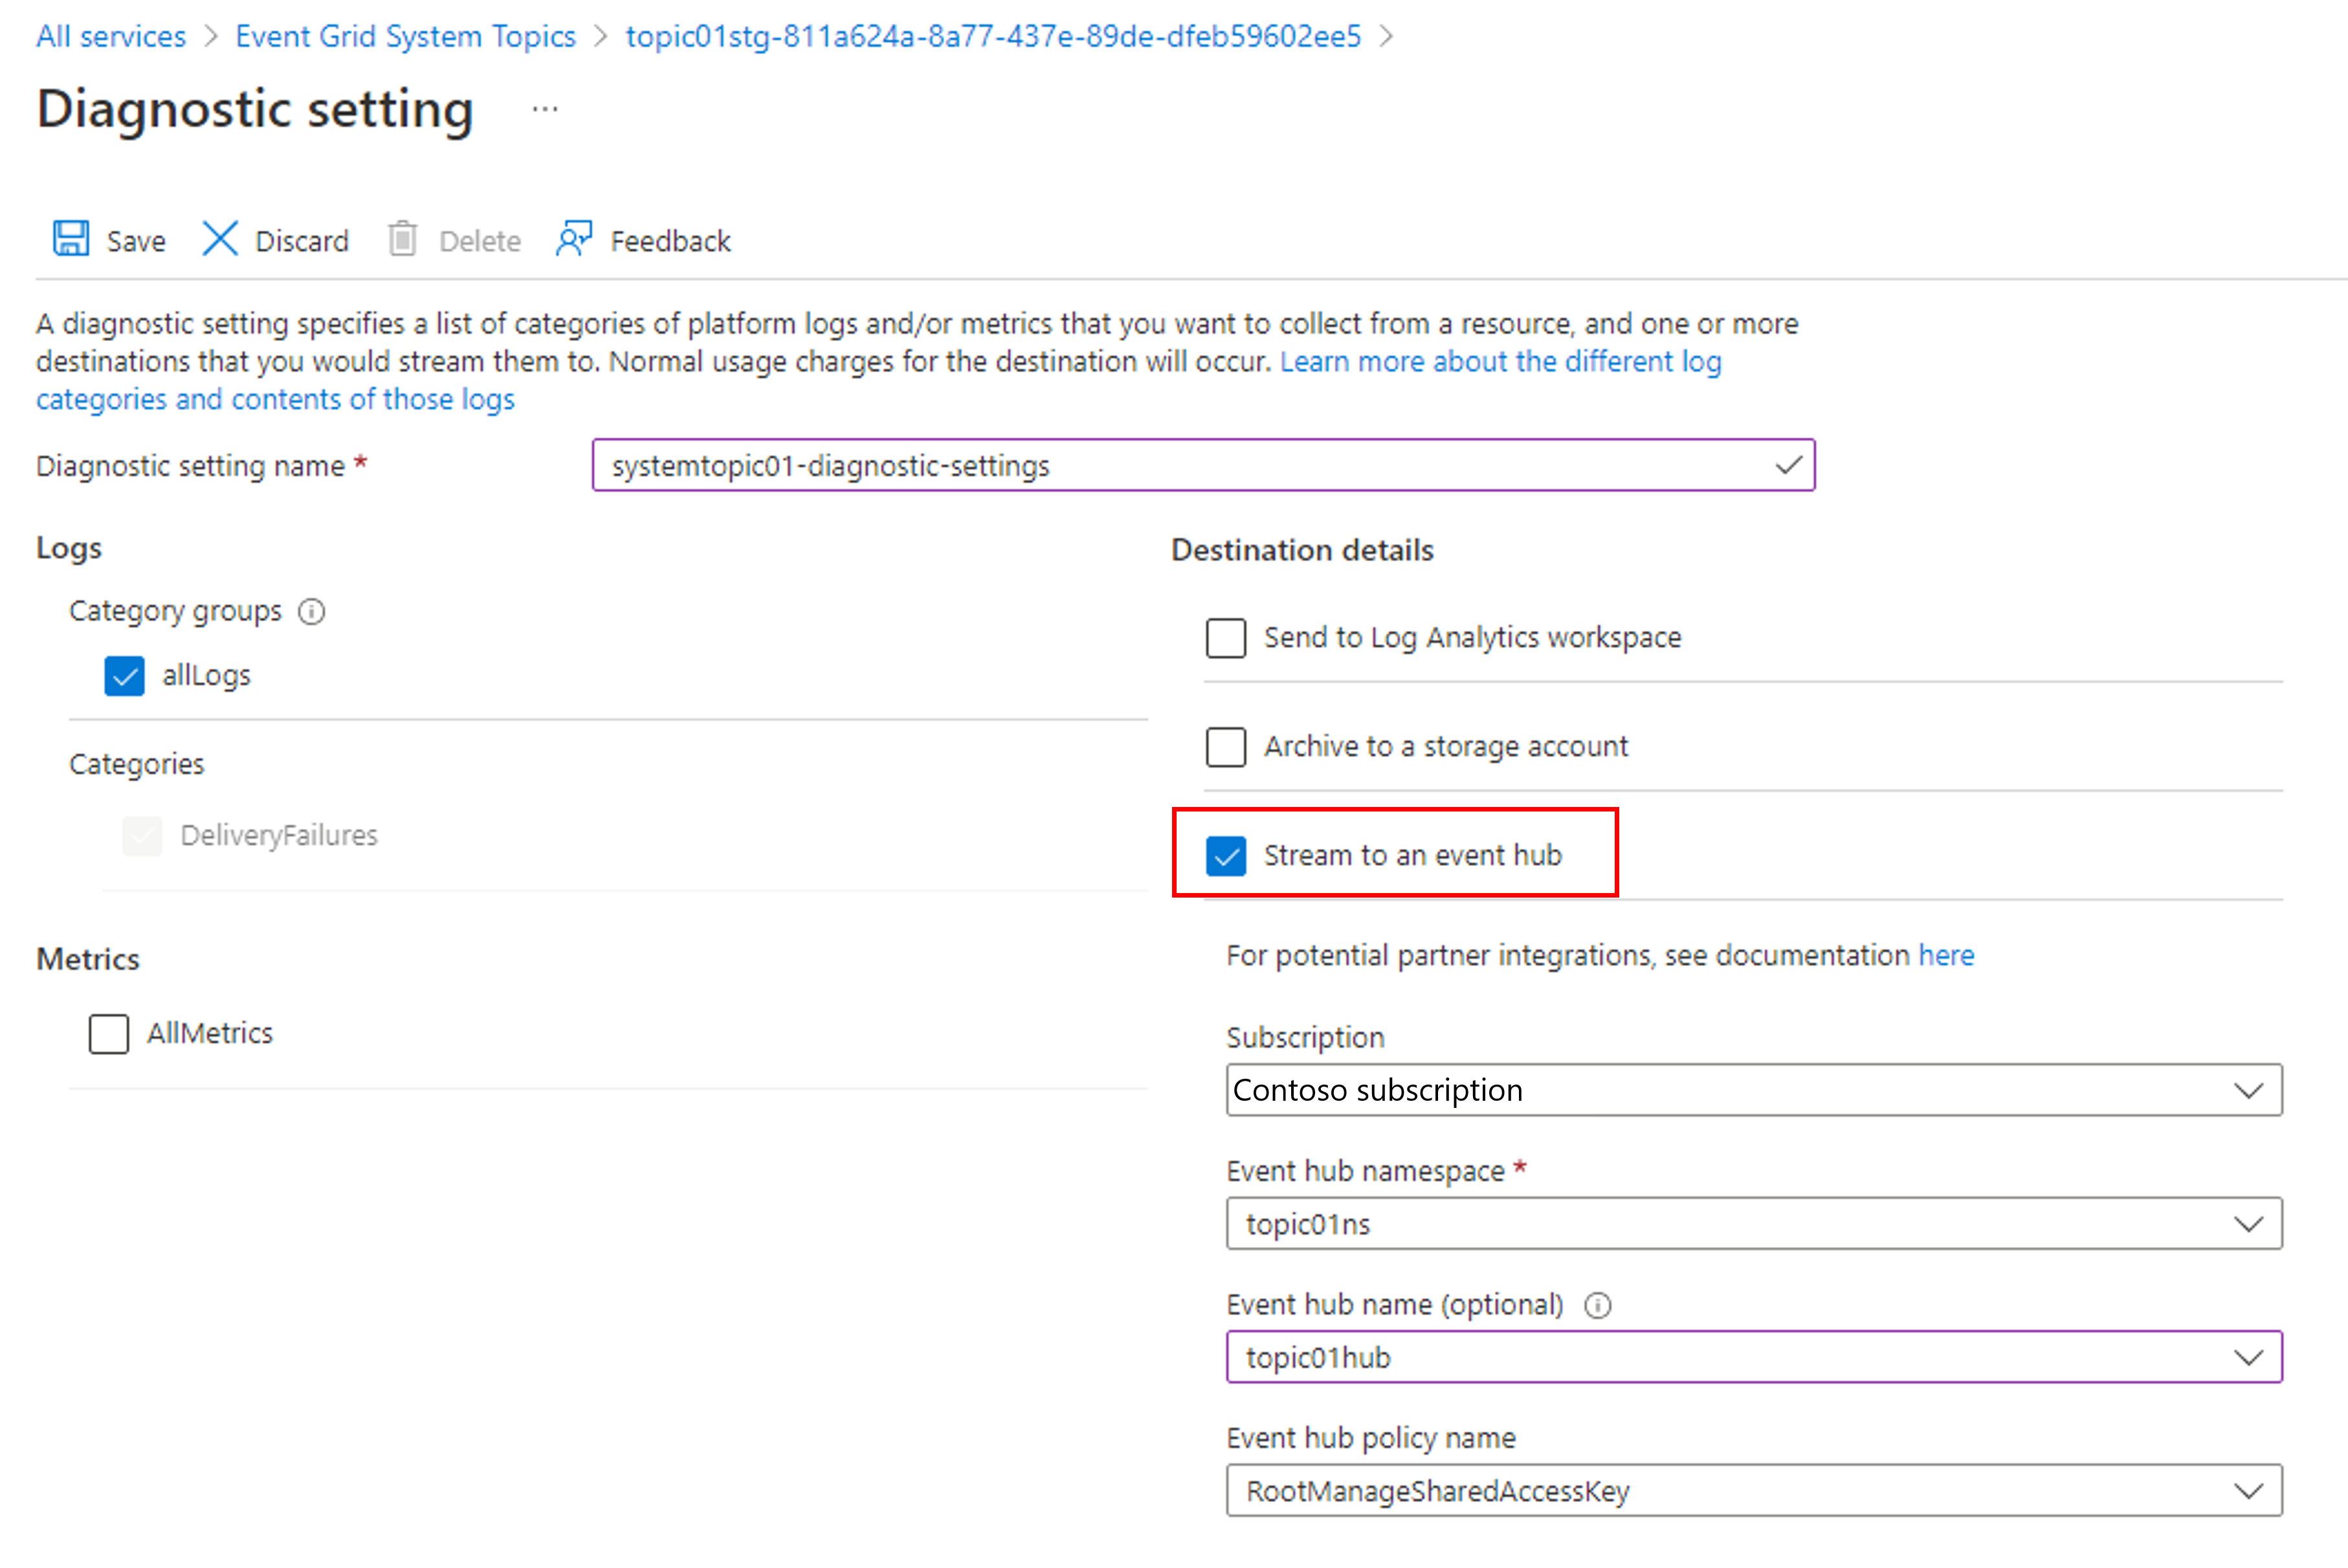
- [ログ] セクションで [allLogs] オプションを選択します。
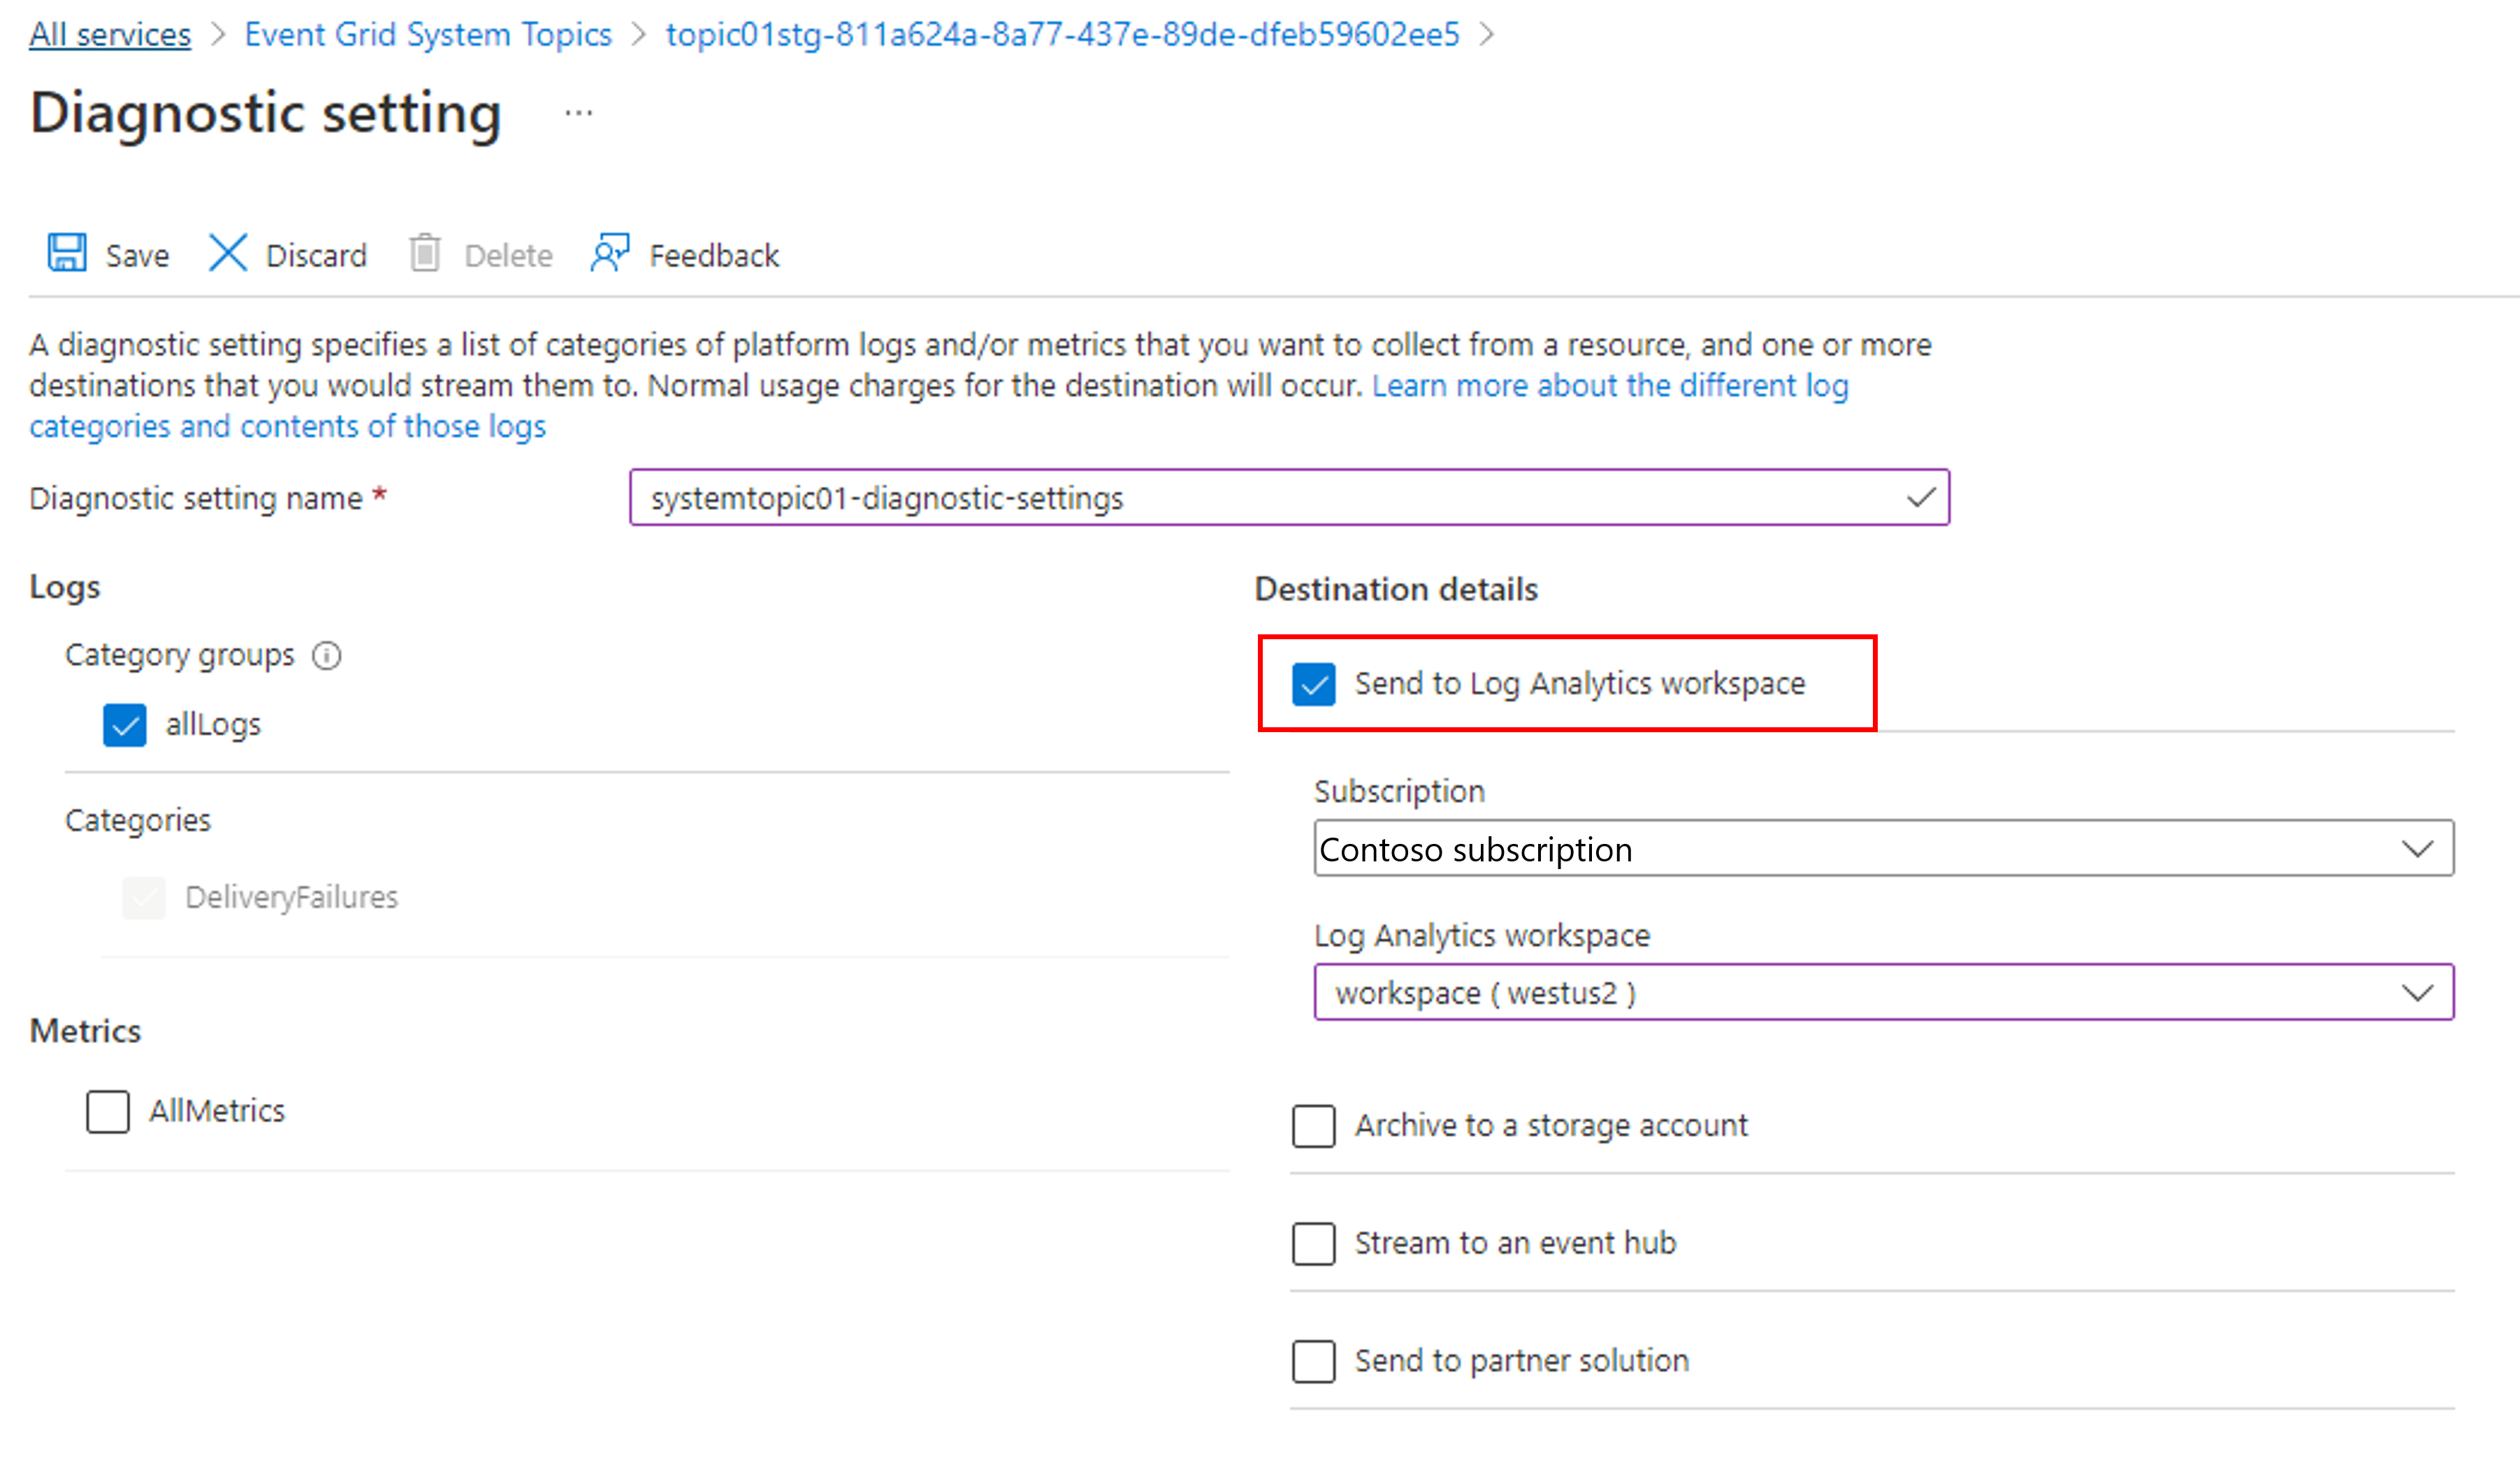
- ログの 1 つまたは複数のキャプチャ先を有効にしてから、前に作成したキャプチャ リソースを選択して構成します。
- [Log Analytics への送信] を選択した場合は、Log Analytics ワークスペースを選択します。
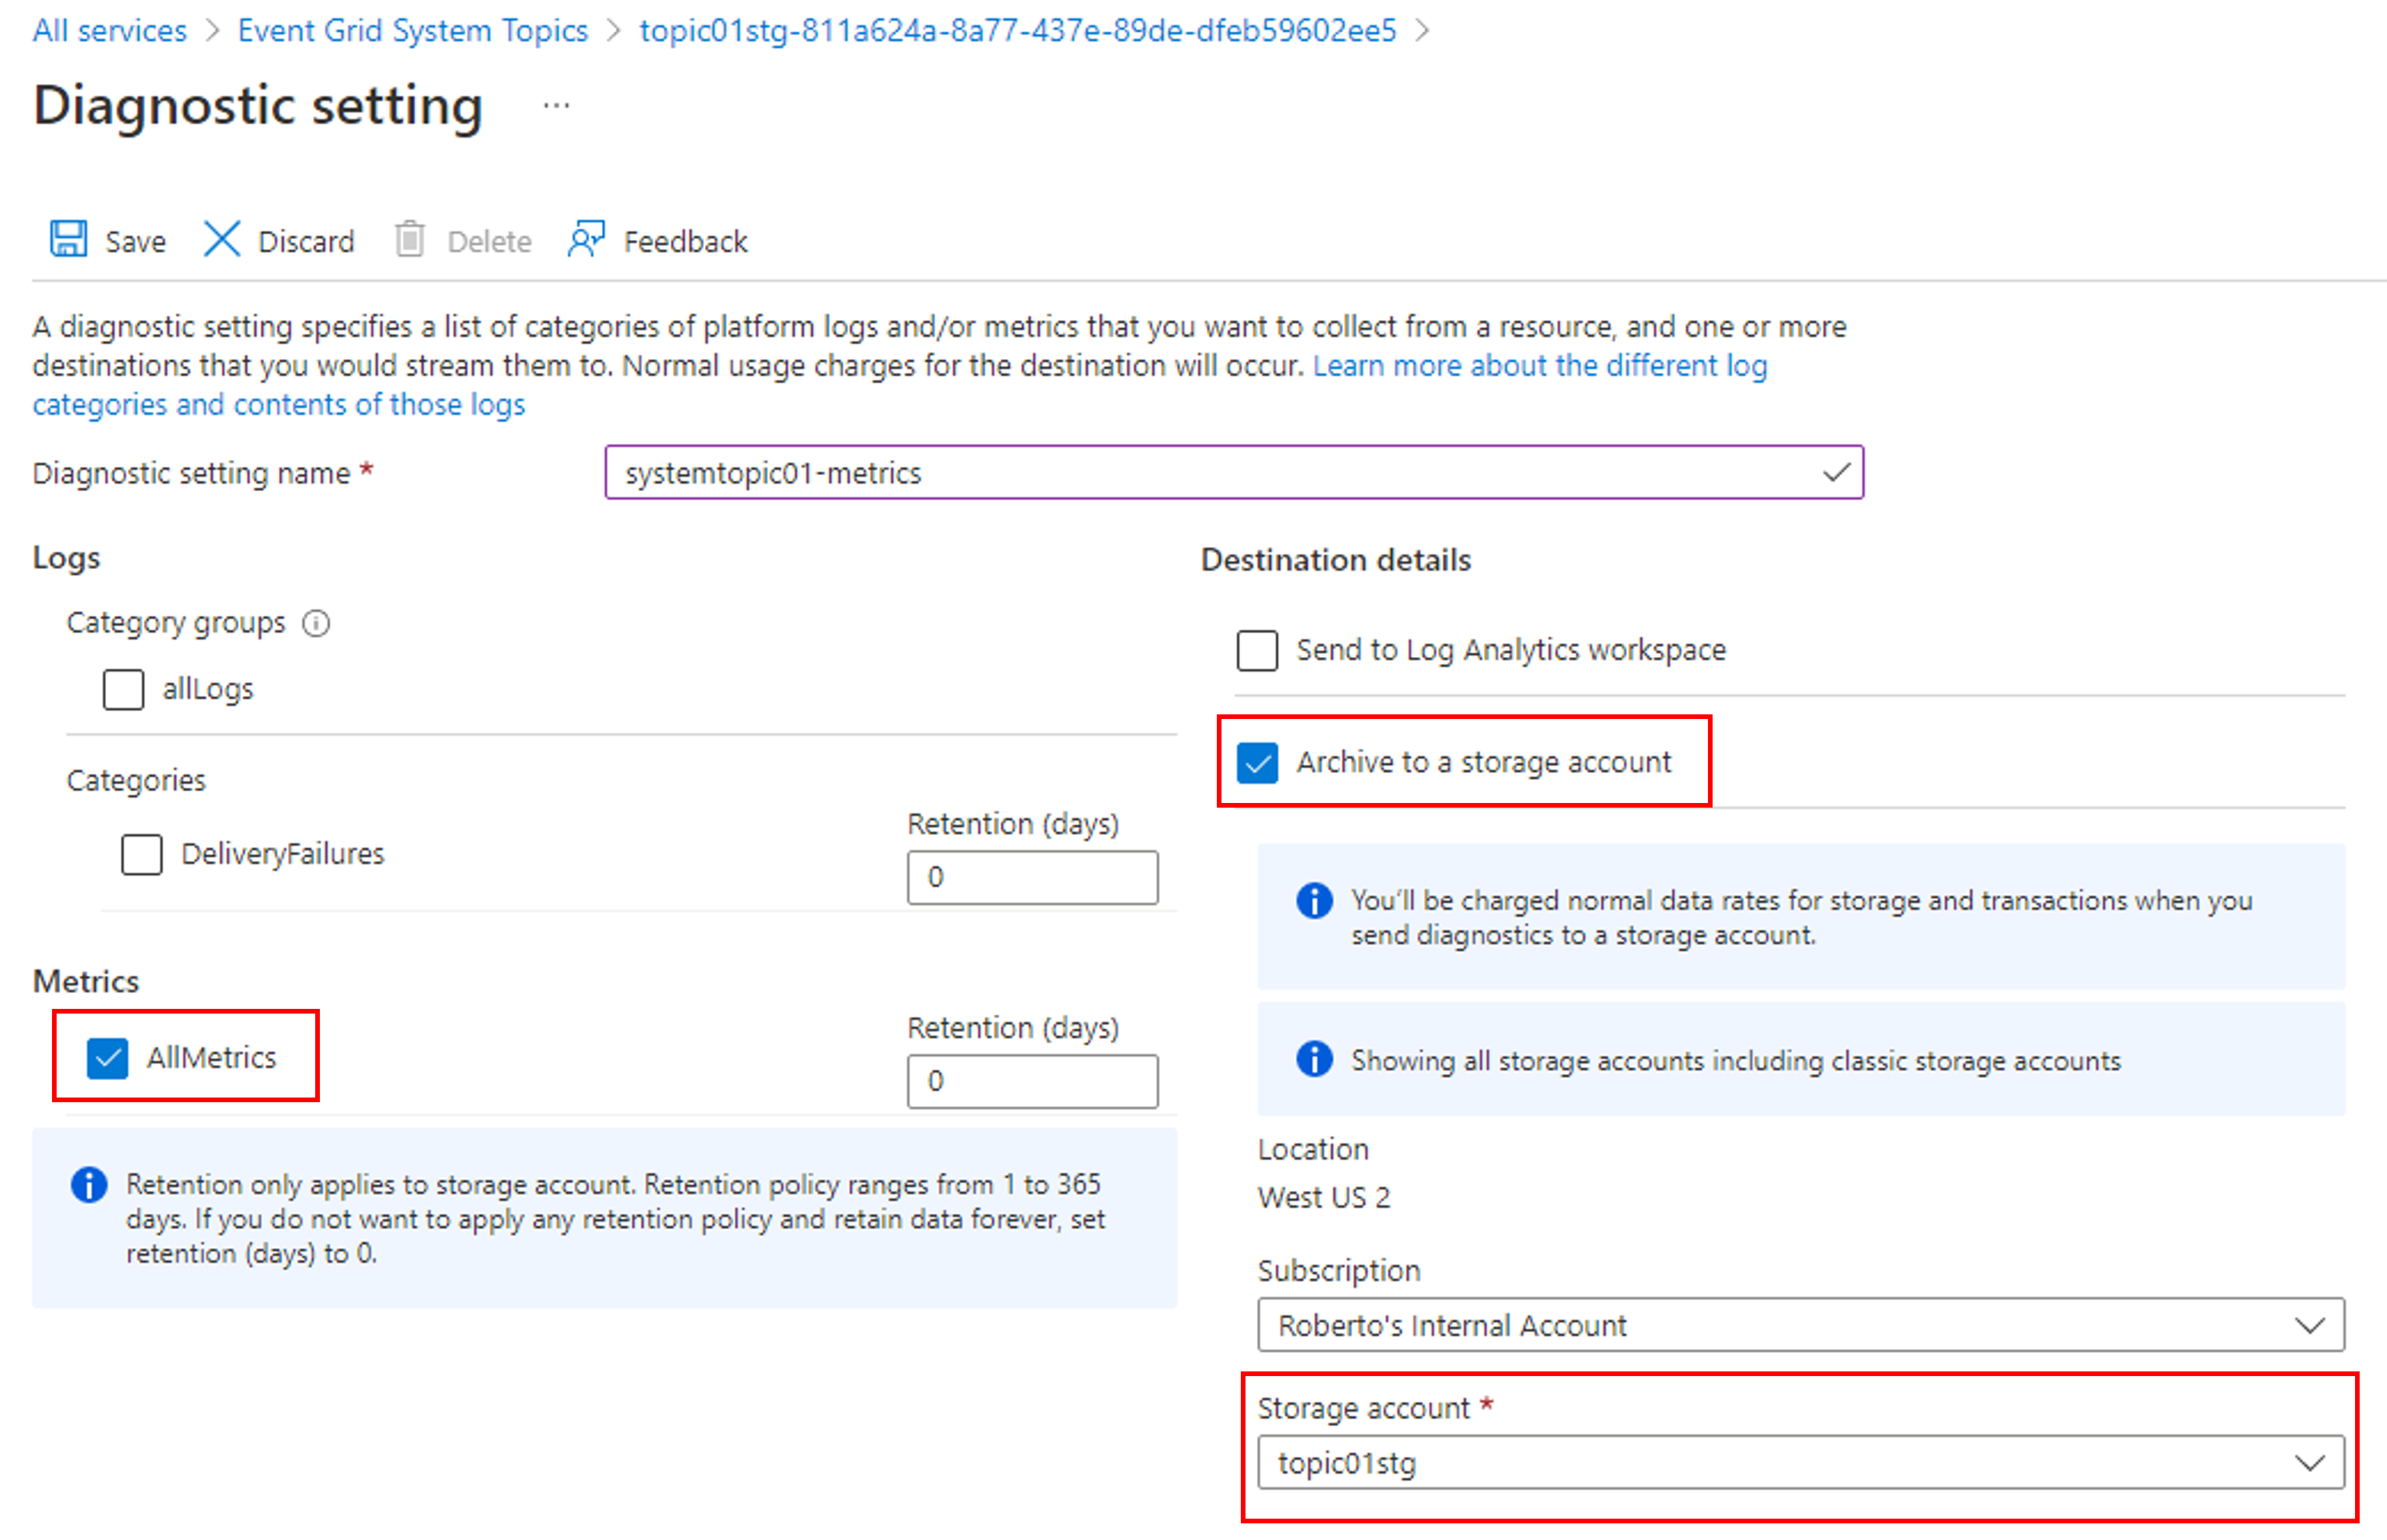
- [ストレージ アカウントへのアーカイブ] を選択した場合は、 [ストレージ アカウント - 構成] を選択してから、Azure サブスクリプションのストレージ アカウントを選択します。
- [イベント ハブへのストリーム] を選択した場合は、 [イベント ハブ - 構成] を選択してから、Event Hubs 名前空間、イベント ハブ、アクセス ポリシーを選択します。
- [Log Analytics への送信] を選択した場合は、Log Analytics ワークスペースを選択します。
- [保存] を選択します。 次に、右上隅にある [X] を選択して、ページを閉じます。
- 次に [診断設定] ページに戻り、 [診断設定] テーブルに新しいエントリが表示されていることを確認します。
また、システム トピックのすべてのメトリックの収集を有効にすることもできます。
Azure Storage アカウントの診断ログの表示
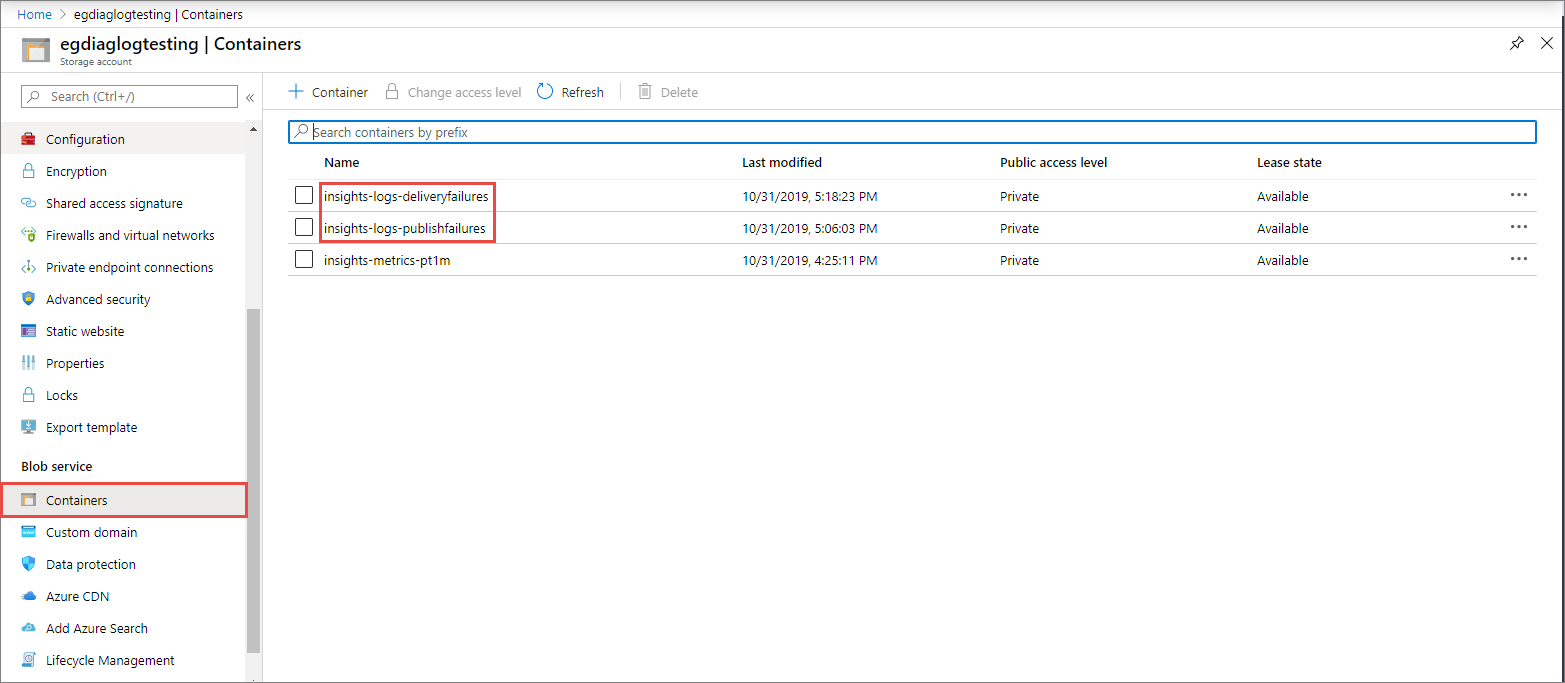
キャプチャ先としてストレージ アカウントを有効にすると、Event Grid が診断ログの出力を開始します。 ストレージ アカウントで、insights-logs-deliveryfailures および insights-logs-publishfailures という名前の新しいコンテナーが表示されます。
いずれかのコンテナー内を移動すると、JSON 形式の BLOB が見つかります。 このファイルには、配信エラーまたは発行エラーのログ エントリが含まれています。 ナビゲーション パスは、Event Grid トピックの ResourceId と、ログ エントリが生成されたときのタイムスタンプ (分単位) を表します。 ダウンロード可能な BloB/JSON ファイルは、最終的に次のセクションで説明するスキーマに準拠しています。
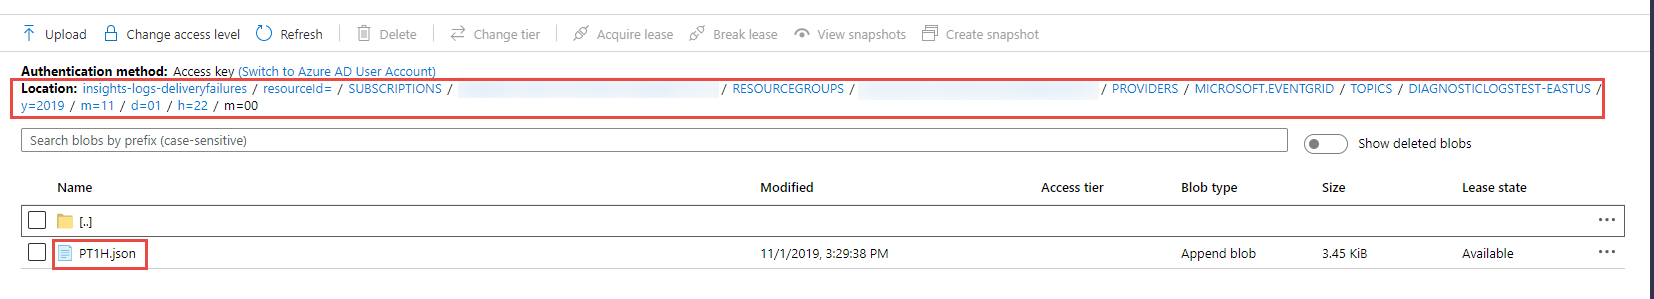
次の例のようなコンテンツが JSON ファイルで確認できます。
{
    "time": "2019-11-01T00:17:13.4389048Z",
    "resourceId": "/SUBSCRIPTIONS/SAMPLE-SUBSCTIPTION-ID /RESOURCEGROUPS/SAMPLE-RESOURCEGROUP-NAME/PROVIDERS/MICROSOFT.EVENTGRID/TOPICS/SAMPLE-TOPIC-NAME ",
    "eventSubscriptionName": "SAMPLEDESTINATION",
    "category": "DeliveryFailures",
    "operationName": "Deliver",
    "message": "Message:outcome=NotFound, latencyInMs=2635, id=xxxxxxxx-xxxx-xxxx-xxxx-xxxxxxxxxxxxx, systemId=xxxxxxx-xxxx-xxxx-xxxx-xxxxxxxxxxxx, state=FilteredFailingDelivery, deliveryTime=11/1/2019 12:17:10 AM, deliveryCount=0, probationCount=0, deliverySchema=EventGridEvent, eventSubscriptionDeliverySchema=EventGridEvent, fields=InputEvent, EventSubscriptionId, DeliveryTime, State, Id, DeliverySchema, LastDeliveryAttemptTime, SystemId, fieldCount=, requestExpiration=1/1/0001 12:00:00 AM, delivered=False publishTime=11/1/2019 12:17:10 AM, eventTime=11/1/2019 12:17:09 AM, eventType=Type, deliveryTime=11/1/2019 12:17:10 AM, filteringState=FilteredWithRpc, inputSchema=EventGridEvent, publisher=DIAGNOSTICLOGSTEST-EASTUS.EASTUS-1.EVENTGRID.AZURE.NET, size=363, fields=Id, PublishTime, SerializedBody, EventType, Topic, Subject, FilteringHashCode, SystemId, Publisher, FilteringTopic, TopicCategory, DataVersion, MetadataVersion, InputSchema, EventTime, fieldCount=15, url=sb://diagnosticlogstesting-eastus.servicebus.windows.net/, deliveryResponse=NotFound: The messaging entity 'sb://diagnosticlogstesting-eastus.servicebus.windows.net/eh-diagnosticlogstest' could not be found. TrackingId:c98c5af6-11f0-400b-8f56-c605662fb849_G14, SystemTracker:diagnosticlogstesting-eastus.servicebus.windows.net:eh-diagnosticlogstest, Timestamp:2019-11-01T00:17:13, referenceId: ac141738a9a54451b12b4cc31a10dedc_G14:"
}
Azure Resource Manager テンプレートの使用
Event Grid トピックの診断設定を有効にする Azure Resource Manager テンプレートの例を次に示します。 このサンプル テンプレートをデプロイすると、次のリソースが作成されます。
- Event Grid トピック
- Log Analytics ワークスペース
次に、診断設定がトピック上に作成され、診断情報が Log Analytics ワークスペースに送信されます。
{
    "$schema": "https://schema.management.azure.com/schemas/2019-04-01/deploymentTemplate.json#",
    "contentVersion": "1.0.0.0",
    "parameters": {
        "topic_name": {
            "defaultValue": "spegrid0917topic",
            "type": "String"
        },
        "log_analytics_workspace_name": {
            "defaultValue": "splogaw0625",
            "type": "String"
        },
        "location": {
            "defaultValue": "eastus",
            "type": "String"
        },
        "sku": {
            "defaultValue": "Free",
            "type": "String"
        }
    },
    "variables": {},
    "resources": [
        {
            "type": "Microsoft.EventGrid/topics",
            "apiVersion": "2020-10-15-preview",
            "name": "[parameters('topic_name')]",
            "location": "[parameters('location')]",
            "sku": {
                "name": "Basic"
            },
            "kind": "Azure",
            "identity": {
                "type": "None"
            },
            "properties": {
                "inputSchema": "EventGridSchema",
                "publicNetworkAccess": "Enabled"
            }
        },
        {
            "apiVersion": "2017-03-15-preview",
            "name": "[parameters('log_analytics_workspace_name')]",
            "location": "[parameters('location')]",
            "type": "Microsoft.OperationalInsights/workspaces",
            "properties": {
                "sku": {
                    "name": "[parameters('sku')]"
                }
            }
        },
        {
            "type": "Microsoft.EventGrid/topics/providers/diagnosticSettings",
            "apiVersion": "2017-05-01-preview",
            "name": "[concat(parameters('topic_name'), '/', 'Microsoft.Insights/', parameters('log_analytics_workspace_name'))]",
            "location": "[parameters('location')]",
            "dependsOn": [
                "[resourceId('Microsoft.EventGrid/topics', parameters('topic_name'))]",
                "[resourceId('Microsoft.OperationalInsights/workspaces', parameters('log_analytics_workspace_name'))]"
            ],
            "properties": {
                "workspaceId": "[resourceId('Microsoft.OperationalInsights/workspaces', parameters('log_analytics_workspace_name'))]",
                "metrics": [
                    {
                        "category": "AllMetrics",
                        "enabled": true
                    }
                ],
                "logs": [
                    {
                        "category": "DeliveryFailures",
                        "enabled": true
                    },
                    {
                        "category": "PublishFailures",
                        "enabled": true
                    }
                ]
            }
        }
    ]
}
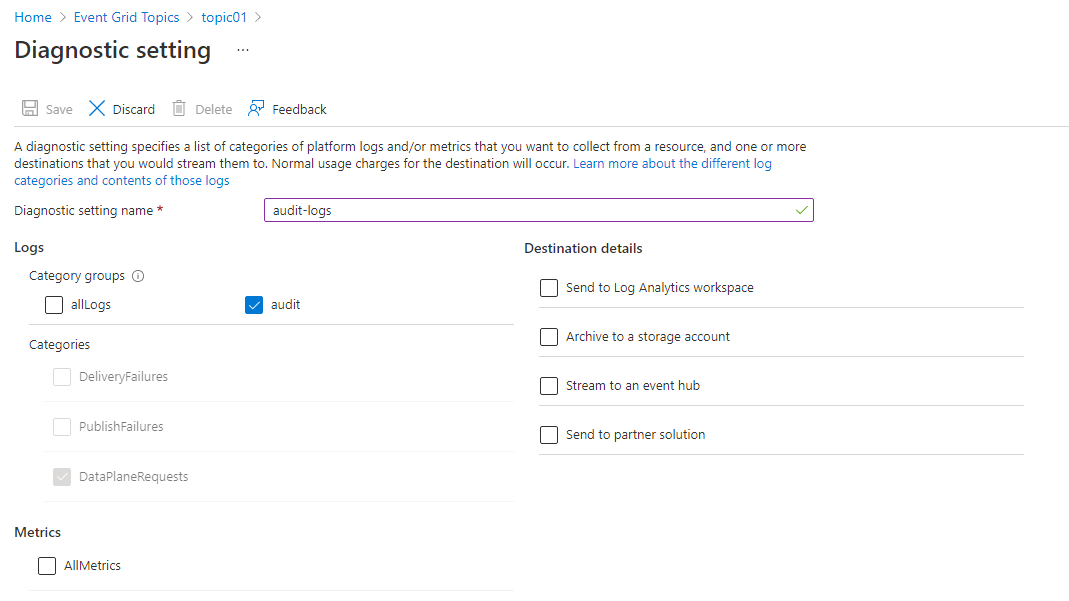
監査トレースについての診断ログを有効にする
Event Grid により、データ プレーン操作のための監査トレースを公開できます。 この機能を有効にするには、[カテゴリ グループ] セクションで [監査] を選択するか、[カテゴリ] セクションで [DataPlaneRequests] を選択します。
監査トレースを使用すると確実に、承認された目的でのみデータ アクセスを許可できます。 これによりリソース名、操作の種類、ネットワーク アクセス、レベル、リージョンなど、セキュリティ制御に関する情報が収集されます。 診断設定を有効にする方法の詳細については、Event Grid トピックと Event ドメインにおける診断ログに関するページを参照してください。
重要
DataPlaneRequests スキーマの詳細については、診断ログに関するページを参照してください。
次のステップ
ログ スキーマと、トピックまたはドメインの診断ログに関するその他の概念情報については、「診断ログ」を参照してください。
フィードバック
以下は間もなく提供いたします。2024 年を通じて、コンテンツのフィードバック メカニズムとして GitHub の issue を段階的に廃止し、新しいフィードバック システムに置き換えます。 詳細については、「https://aka.ms/ContentUserFeedback」を参照してください。
フィードバックの送信と表示