このチュートリアルでは、Microsoft Fabric の Synapse Data Science ワークフローのエンド ツー エンドの例を示します。 このシナリオでは、機械学習を使用して、障害診断に対するより体系的なアプローチを行い、問題を事前に特定し、実際のマシン障害の前にアクションを実行します。 目標は、機械がプロセス温度や回転数などに基づいて故障を経験するかどうかを予測することです。
このチュートリアルでは、次の手順について説明します。
- カスタム ライブラリをインストールする
- データを読み込んで処理する
- 探索的データ分析を通じてデータを理解する
- scikit-learn、LightGBM、MLflow を使用して機械学習モデルをトレーニングし、Fabric 自動ログ機能を使用して実験を追跡する
- Fabric
PREDICT機能を使用してトレーニング済みのモデルをスコア付けし、最適なモデルを保存し、予測のためにそのモデルを読み込みます - Power BI の視覚エフェクトを使用して読み込まれたモデルのパフォーマンスを表示する
前提 条件
Microsoft Fabric サブスクリプションを取得します。 または、無料で Microsoft Fabric 試用版にサインアップします。
Microsoft Fabric にサインインします。
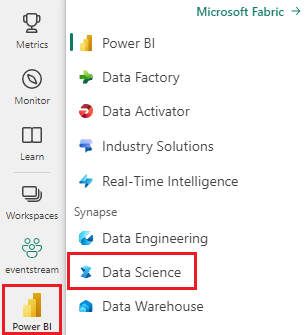
ホーム ページの左下にあるエクスペリエンス スイッチャーを使用して、Fabric に切り替えます。
- 必要な場合には、「Microsoft Fabric でのレイクハウスの作成」の説明に従って、Microsoft Fabric レイクハウスを作成します。
ノートブックで作業を進める
次のいずれかのオプションを選択してノートブックで作業を進めます。
- 組み込みのノートブックを開いて実行します。
- GitHub からノートブックをアップロードします。
組み込みのノートブックを開く
このチュートリアルには、機械故障サンプル ノートブックが付属しています。
このチュートリアルのサンプル ノートブックを開くには、「データ サイエンス用にシステムを準備する」チュートリアルの手順に従います。
コードの実行を開始する前に、必ずレイクハウスをノートブックにアタッチしてください。
GitHub からノートブックをインポートする
AISample - 予測メンテナンス ノートブックには、このチュートリアルが付属しています。
このチュートリアルの付属のノートブックを開くには、「データ サイエンス用にシステムを準備する」の手順に従って、ノートブックをワークスペースにインポート します。
もしこのページからコードをコピーして貼り付けたい場合は、新しいノートブック を作成できます。
コードの実行を開始する前に、必ずレイクハウスをノートブックにアタッチしてください。
手順 1: カスタム ライブラリをインストールする
機械学習モデルの開発やアドホック データ分析の場合は、Apache Spark セッション用のカスタム ライブラリをすばやくインストールすることが必要になる場合があります。 ライブラリをインストールするには、2 つのオプションがあります。
- ノートブックのインライン インストール機能 (
%pipまたは%conda) を使用して、現在のノートブックにのみライブラリをインストールします。 - または、ファブリック環境を作成したり、パブリック ソースからライブラリをインストールしたり、カスタム ライブラリをアップロードしたりして、ワークスペース管理者がワークスペースの既定として環境をアタッチすることもできます。 その後、環境内のすべてのライブラリが、ワークスペース内のすべてのノートブックと Spark ジョブ定義で使用できるようになります。 環境の詳細については、「Microsoft Fabric で環境作成、構成、および使用する」を参照してください。
このチュートリアルでは、%pip install を使用して imblearn ライブラリをノートブックにインストールします。
手記
PySpark カーネルは、%pip install の実行後に再起動します。 他のセルを実行する前に、必要なライブラリをインストールします。
# Use pip to install imblearn
%pip install imblearn
手順 2: データを読み込む
データセットは、製造業の設定で一般的な時間関数として、製造機械のパラメーターのログ記録をシミュレートします。 これは、行として格納された 10,000 個のデータ ポイントで構成され、特徴は列として格納されます。 次のような機能があります。
1 から 10000 までの範囲の一意識別子 (UID)
製品 ID。L (低)、M (中)、または H (高) で構成され、製品品質バリアント、およびバリアント固有のシリアル番号を示します。 低、中、高品質のバリアントは、それぞれ 60%、30%、およびすべての製品の 10% を構成します
気温(ケルビン(K)単位)
プロセス温度(ケルビン単位)
回転数、1 分あたりの回転数 (RPM)
トルク、ニュートンメートル (Nm) 単位
工具の摩耗(分単位)。 品質バリアント H、M、L は、プロセスで使用されるツールにそれぞれ 5、3、2 分の工具摩耗を追加します。
特定のデータ ポイントでマシンが失敗したかどうかを示すマシン障害ラベル。 この特定のデータ ポイントには、次の 5 つの独立した障害モードのいずれかを指定できます。
- ツールの摩耗の失敗 (TWF): ランダムに選択されたツールの摩耗時間 (200 ~ 240 分) でツールが交換または失敗する
- 放熱不良 (HDF): 放熱は、空気温度とプロセス温度の差が 8.6 K 未満で、ツールの回転数が 1380 RPM 未満の場合にプロセスエラーを引き起こします
- 停電 (PWF): トルクと回転数 (rad/秒) の積は、プロセスに必要な電力と等しくなります。 この電力が 3,500 W を下回るか、9,000 W を超えると、プロセスは失敗します
- 過負荷故障 (OSF): ツールの摩耗とトルクの積がL製品バリアントで11,000 Nm、Mで12,000 Nm、Hで13,000 Nmを超えると、過負荷によりプロセスが失敗します。
- ランダム エラー (RNF): プロセス パラメーターに関係なく、各プロセスに 0.1%のエラーが発生する可能性があります
手記
上記の障害モードの少なくとも 1 つが true の場合、プロセスは失敗し、"machine failure" ラベルは 1 に設定されます。 機械学習方法では、プロセスエラーの原因となったエラー モードを特定できません。
データセットをダウンロードして lakehouse にアップロードする
Azure Open Datasets コンテナーに接続し、予測メンテナンス データセットを読み込みます。 このコードは、公開されているバージョンのデータセットをダウンロードし、Fabric Lakehouse に格納します。
重要
ノートブックを実行する前に、レイクハウスを追加してください。 それ以外の場合は、エラーが発生します。 レイクハウスの追加の詳細については、「レイクハウスとノートブックを接続する」を参照してください。
# Download demo data files into the lakehouse if they don't exist
import os, requests
DATA_FOLDER = "Files/predictive_maintenance/"  # Folder that contains the dataset
DATA_FILE = "predictive_maintenance.csv"  # Data file name
remote_url = "https://synapseaisolutionsa.z13.web.core.windows.net/data/MachineFaultDetection"
file_list = ["predictive_maintenance.csv"]
download_path = f"/lakehouse/default/{DATA_FOLDER}/raw"

if not os.path.exists("/lakehouse/default"):
    raise FileNotFoundError(
        "Default lakehouse not found, please add a lakehouse and restart the session."
    )
os.makedirs(download_path, exist_ok=True)
for fname in file_list:
    if not os.path.exists(f"{download_path}/{fname}"):
        r = requests.get(f"{remote_url}/{fname}", timeout=30)
        with open(f"{download_path}/{fname}", "wb") as f:
            f.write(r.content)
print("Downloaded demo data files into lakehouse.")
データセットを lakehouse にダウンロードした後、Spark DataFrame として読み込むことができます。
df = (
    spark.read.option("header", True)
    .option("inferSchema", True)
    .csv(f"{DATA_FOLDER}raw/{DATA_FILE}")
    .cache()
)
df.show(5)
次の表に、データのプレビューを示します。
| ウディー | 製品 ID | 種類 | 気温 [K] | プロセス温度 [K] | 回転数 [rpm] | トルク [Nm] | 工具摩耗 [min] | ターゲット | エラーの種類 |
|---|---|---|---|---|---|---|---|---|---|
| 1 | M14860 | M | 298.1 | 308.6 | 1551 | 42.8 | 0 | 0 | エラーなし |
| 2 | L47181 | L | 298.2 | 308.7 | 1408 | 46.3 | 3 | 0 | エラーなし |
| 3 | L47182 | L | 298.1 | 308.5 | 1498 | 49.4 | 5 | 0 | エラーなし |
| 4 | L47183 | L | 298.2 | 308.6 | 1433 | 39.5 | 7 | 0 | エラーなし |
| 5 | L47184 | L | 298.2 | 308.7 | 1408 | 40.0 | 9 | 0 | エラーなし |
Spark DataFrame を Lakehouse デルタ テーブルに書き込む
以降の手順で Spark 操作を容易にするために、データの書式を設定します (スペースをアンダースコアに置き換えるなど)。
# Replace the space in the column name with an underscore to avoid an invalid character while saving
df = df.toDF(*(c.replace(' ', '_') for c in df.columns))
table_name = "predictive_maintenance_data"
df.show(5)
次の表は、再フォーマットされた列名を持つデータのプレビューを示しています。
| ウディー | プロダクト_ID | 種類 | 空気温度 [K] | プロセス温度 [K] | 回転速度(rpm) | Torque_[Nm] | Tool_wear_[min] | ターゲット | 障害タイプ |
|---|---|---|---|---|---|---|---|---|---|
| 1 | M14860 | M | 298.1 | 308.6 | 1551 | 42.8 | 0 | 0 | エラーなし |
| 2 | L47181 | L | 298.2 | 308.7 | 1408 | 46.3 | 3 | 0 | エラーなし |
| 3 | L47182 | L | 298.1 | 308.5 | 1498 | 49.4 | 5 | 0 | エラーなし |
| 4 | L47183 | L | 298.2 | 308.6 | 1433 | 39.5 | 7 | 0 | エラーなし |
| 5 | L47184 | L | 298.2 | 308.7 | 1408 | 40.0 | 9 | 0 | エラーなし |
# Save data with processed columns to the lakehouse
df.write.mode("overwrite").format("delta").save(f"Tables/{table_name}")
print(f"Spark DataFrame saved to delta table: {table_name}")
手順 3: データの前処理と探索的データ分析の実行
Pandas 互換の一般的なプロット ライブラリを使用するには、Spark DataFrame を pandas DataFrame に変換します。
ヒント
大規模なデータセットの場合は、そのデータセットの一部を読み込む必要がある場合があります。
data = spark.read.format("delta").load("Tables/predictive_maintenance_data")
SEED = 1234
df = data.toPandas()
df.drop(['UDI', 'Product_ID'],axis=1,inplace=True)
# Rename the Target column to IsFail
df = df.rename(columns = {'Target': "IsFail"})
df.info()
データセットの特定の列を必要に応じて浮動小数点型または整数型に変換し、文字列 ('L'、 'M'、 'H') を数値 (0, 1, 2) にマップします。
# Convert temperature, rotational speed, torque, and tool wear columns to float
df['Air_temperature_[K]'] = df['Air_temperature_[K]'].astype(float)
df['Process_temperature_[K]'] = df['Process_temperature_[K]'].astype(float)
df['Rotational_speed_[rpm]'] = df['Rotational_speed_[rpm]'].astype(float)
df['Torque_[Nm]'] = df['Torque_[Nm]'].astype(float)
df['Tool_wear_[min]'] = df['Tool_wear_[min]'].astype(float)

# Convert the 'Target' column to an integer
df['IsFail'] = df['IsFail'].astype(int)
# Map 'L', 'M', 'H' to numerical values
df['Type'] = df['Type'].map({'L': 0, 'M': 1, 'H': 2})
視覚化を使用してデータを探索する
# Import packages and set plotting style
import seaborn as sns
import matplotlib.pyplot as plt
import pandas as pd
sns.set_style('darkgrid')

# Create the correlation matrix
corr_matrix = df.corr(numeric_only=True)

# Plot a heatmap
plt.figure(figsize=(10, 8))
sns.heatmap(corr_matrix, annot=True)
plt.show()
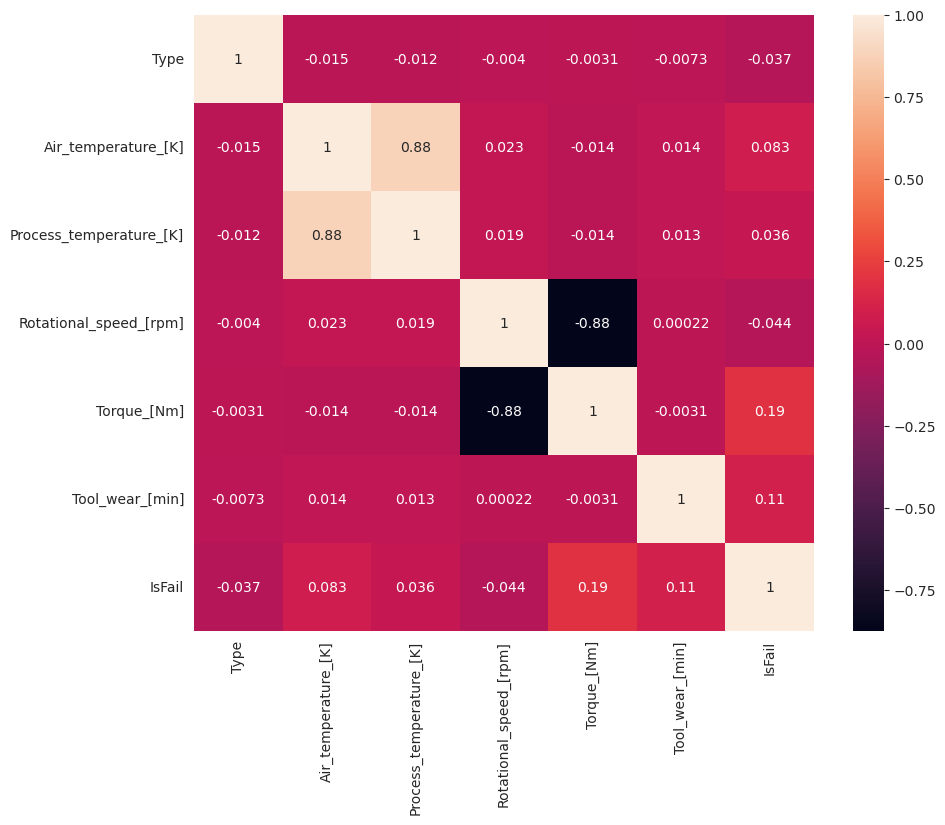
予想どおり、エラー (IsFail) は、選択した特徴 (列) と関連付けられています。 相関行列は、Air_temperature、Process_temperature、Rotational_speed、Torque、および Tool_wear が IsFail 変数と最も高い相関関係を持っていることを示しています。
# Plot histograms of select features
fig, axes = plt.subplots(2, 3, figsize=(18,10))
columns = ['Air_temperature_[K]', 'Process_temperature_[K]', 'Rotational_speed_[rpm]', 'Torque_[Nm]', 'Tool_wear_[min]']
data=df.copy()
for ind, item in enumerate (columns):
    column = columns[ind]
    df_column = data[column]
    df_column.hist(ax = axes[ind%2][ind//2], bins=32).set_title(item)
fig.supylabel('count')
fig.subplots_adjust(hspace=0.2)
fig.delaxes(axes[1,2])
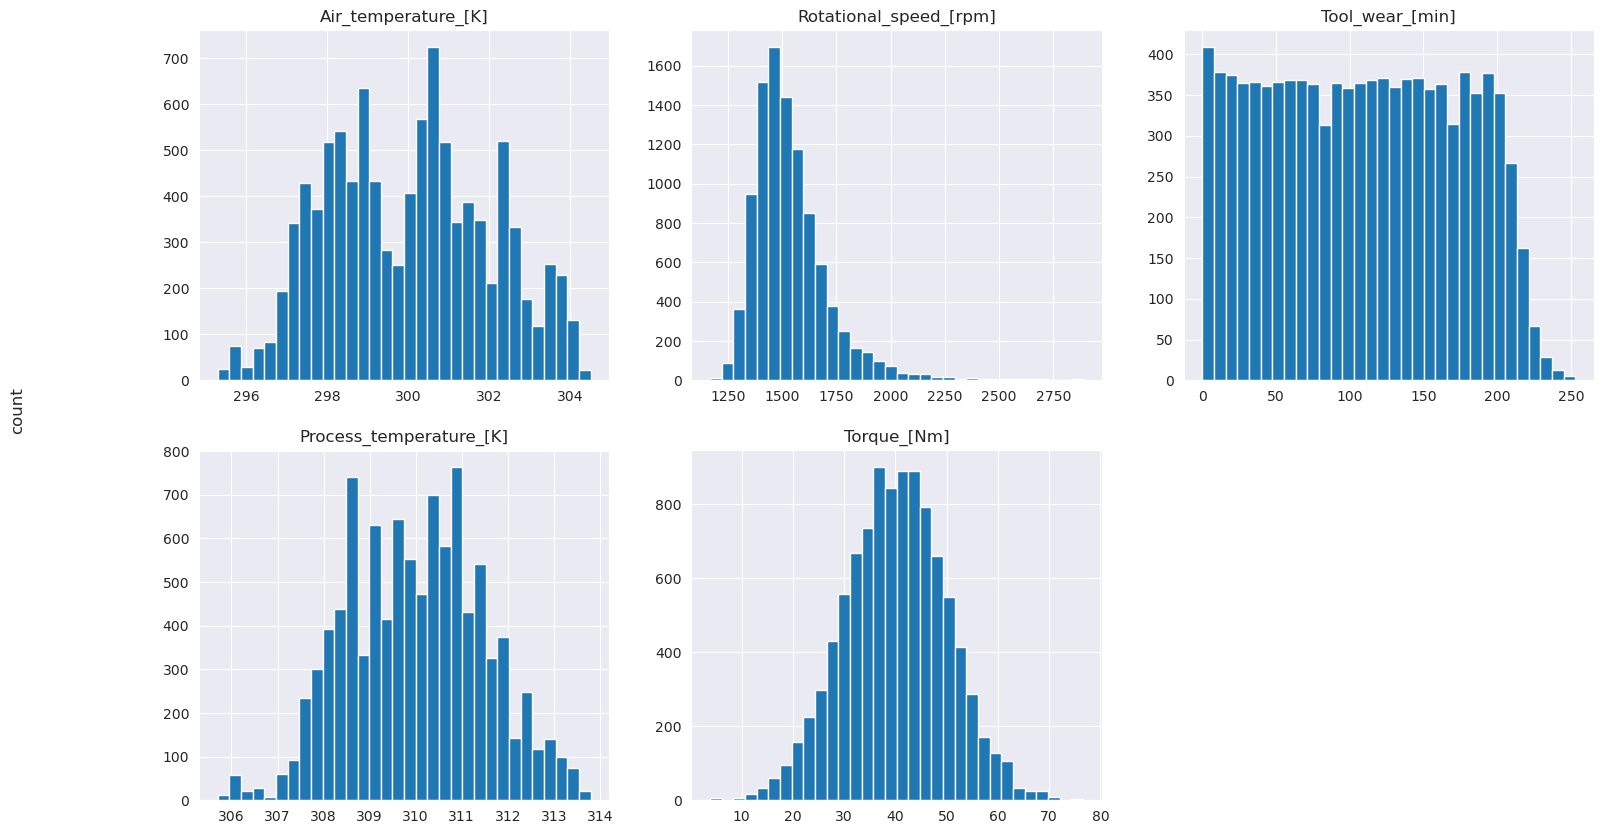
プロットされたグラフが示すように、Air_temperature、Process_temperature、Rotational_speed、Torque、および Tool_wear 変数は疎ではありません。 特徴空間で優れた継続性があるようです。 これらのプロットは、このデータセットで機械学習モデルをトレーニングすると、新しいデータセットに一般化できる信頼性の高い結果が生成される可能性があることを確認します。
ターゲット変数でクラスの不均衡を調べる
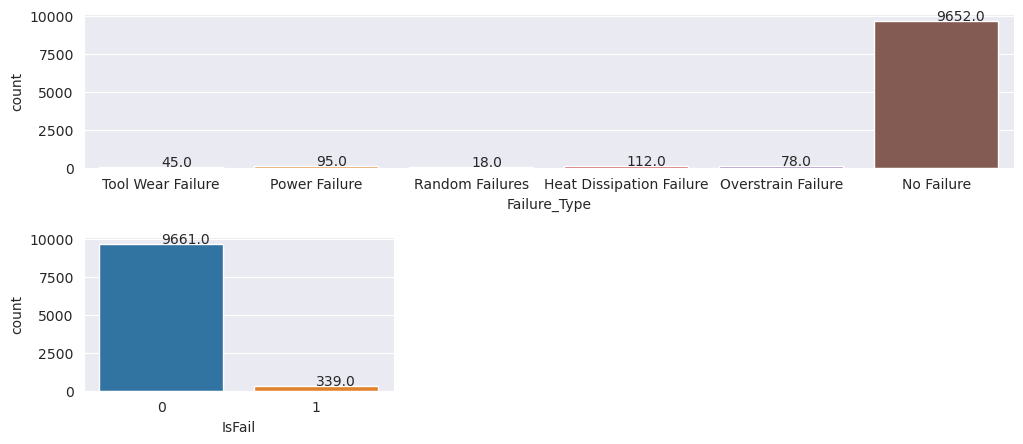
失敗したマシンと失敗したマシンのサンプルの数をカウントし、各クラス (IsFail=0、IsFail=1) のデータバランスを調べます。
# Plot the counts for no failure and each failure type
plt.figure(figsize=(12, 2))
ax = sns.countplot(x='Failure_Type', data=df)
for p in ax.patches:
    ax.annotate(f'{p.get_height()}', (p.get_x()+0.4, p.get_height()+50))

plt.show()

# Plot the counts for no failure versus the sum of all failure types
plt.figure(figsize=(4, 2))
ax = sns.countplot(x='IsFail', data=df)
for p in ax.patches:
    ax.annotate(f'{p.get_height()}', (p.get_x()+0.4, p.get_height()+50))

plt.show()
プロットは、失敗しないクラス (2 番目のプロットの IsFail=0) がほとんどのサンプルを構成することを示しています。 オーバーサンプリング手法を使用して、よりバランスの取れたトレーニング データセットを作成します。
# Separate features and target
features = df[['Type', 'Air_temperature_[K]', 'Process_temperature_[K]', 'Rotational_speed_[rpm]', 'Torque_[Nm]', 'Tool_wear_[min]']]
labels = df['IsFail']

# Split the dataset into the training and testing sets
from sklearn.model_selection import train_test_split
X_train, X_test, y_train, y_test = train_test_split(features, labels, test_size=0.2, random_state=42)

# Ignore warnings
import warnings
warnings.filterwarnings('ignore')
# Save test data to the lakehouse for use in future sections
table_name = "predictive_maintenance_test_data"
df_test_X = spark.createDataFrame(X_test)
df_test_X.write.mode("overwrite").format("delta").save(f"Tables/{table_name}")
print(f"Spark DataFrame saved to delta table: {table_name}")
トレーニングデータセット内のクラスをバランスさせるためにオーバーサンプリングを行う。
前の分析では、データセットが非常に不均衡であることが示されました。 少数派クラスには、モデルが意思決定境界を効果的に学習するための例が少なすぎるため、この不均衡が問題になります。
SMOTE が問題を解決できます。 SMOTE は、合成例を生成する、広く使用されているオーバーサンプリング手法です。 これは、データ ポイント間のユークリッド距離に基づいて少数派クラスの例を生成します。 このメソッドはランダムなオーバーサンプリングとは異なります。これは、少数派クラスを複製するだけでなく、新しい例を作成するためです。 このメソッドは、不均衡なデータセットを処理するためのより効果的な手法になります。
# Disable MLflow autologging because you don't want to track SMOTE fitting
import mlflow

mlflow.autolog(disable=True)

from imblearn.combine import SMOTETomek
smt = SMOTETomek(random_state=SEED)
X_train_res, y_train_res = smt.fit_resample(X_train, y_train)

# Plot the counts for both classes
plt.figure(figsize=(4, 2))
ax = sns.countplot(x='IsFail', data=pd.DataFrame({'IsFail': y_train_res.values}))
for p in ax.patches:
    ax.annotate(f'{p.get_height()}', (p.get_x()+0.4, p.get_height()+50))

plt.show()
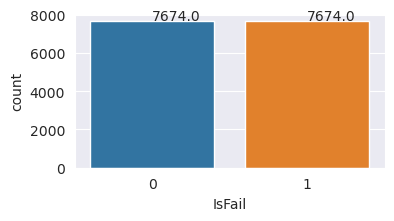
これで、データセットのバランスが正常に調整されました。 モデル トレーニングに移行できるようになりました。
手順 4: モデルをトレーニングして評価する
MLflow では、モデルの登録、さまざまなモデルのトレーニングと比較、予測目的に最適なモデルの選択が行われます。 モデル トレーニングには、次の 3 つのモデルを使用できます。
- ランダム フォレスト分類子
- ロジスティック回帰分類子
- XGBoost 分類子
ランダム フォレスト分類子をトレーニングする
import numpy as np
from sklearn.ensemble import RandomForestClassifier
from mlflow.models.signature import infer_signature
from sklearn.metrics import f1_score, accuracy_score, recall_score

mlflow.set_experiment("Machine_Failure_Classification")
mlflow.autolog(exclusive=False) # This is needed to override the preconfigured autologging behavior

with mlflow.start_run() as run:
    rfc_id = run.info.run_id
    print(f"run_id {rfc_id}, status: {run.info.status}")
    rfc = RandomForestClassifier(max_depth=5, n_estimators=50)
    rfc.fit(X_train_res, y_train_res)
    signature = infer_signature(X_train_res, y_train_res)

    mlflow.sklearn.log_model(
        rfc,
        "machine_failure_model_rf",
        signature=signature,
        registered_model_name="machine_failure_model_rf"
    )

    y_pred_train = rfc.predict(X_train)
    # Calculate the classification metrics for test data
    f1_train = f1_score(y_train, y_pred_train, average='weighted')
    accuracy_train = accuracy_score(y_train, y_pred_train)
    recall_train = recall_score(y_train, y_pred_train, average='weighted')

    # Log the classification metrics to MLflow
    mlflow.log_metric("f1_score_train", f1_train)
    mlflow.log_metric("accuracy_train", accuracy_train)
    mlflow.log_metric("recall_train", recall_train)

    # Print the run ID and the classification metrics
    print("F1 score_train:", f1_train)
    print("Accuracy_train:", accuracy_train)
    print("Recall_train:", recall_train)

    y_pred_test = rfc.predict(X_test)
    # Calculate the classification metrics for test data
    f1_test = f1_score(y_test, y_pred_test, average='weighted')
    accuracy_test = accuracy_score(y_test, y_pred_test)
    recall_test = recall_score(y_test, y_pred_test, average='weighted')

    # Log the classification metrics to MLflow
    mlflow.log_metric("f1_score_test", f1_test)
    mlflow.log_metric("accuracy_test", accuracy_test)
    mlflow.log_metric("recall_test", recall_test)

    # Print the classification metrics
    print("F1 score_test:", f1_test)
    print("Accuracy_test:", accuracy_test)
    print("Recall_test:", recall_test)
この出力から、トレーニング データセットとテスト データセットの両方で、ランダム フォレスト分類子を使用すると、F1 スコア、精度、再現率が約 0.9 になります。
ロジスティック回帰分類子をトレーニングする
from sklearn.linear_model import LogisticRegression

with mlflow.start_run() as run:
    lr_id = run.info.run_id
    print(f"run_id {lr_id}, status: {run.info.status}")
    lr = LogisticRegression(random_state=42)
    lr.fit(X_train_res, y_train_res)
    signature = infer_signature(X_train_res, y_train_res)

    mlflow.sklearn.log_model(
        lr,
        "machine_failure_model_lr",
        signature=signature,
        registered_model_name="machine_failure_model_lr"
    )

    y_pred_train = lr.predict(X_train)
    # Calculate the classification metrics for training data
    f1_train = f1_score(y_train, y_pred_train, average='weighted')
    accuracy_train = accuracy_score(y_train, y_pred_train)
    recall_train = recall_score(y_train, y_pred_train, average='weighted')

    # Log the classification metrics to MLflow
    mlflow.log_metric("f1_score_train", f1_train)
    mlflow.log_metric("accuracy_train", accuracy_train)
    mlflow.log_metric("recall_train", recall_train)

    # Print the run ID and the classification metrics
    print("F1 score_train:", f1_train)
    print("Accuracy_train:", accuracy_train)
    print("Recall_train:", recall_train)

    y_pred_test = lr.predict(X_test)
    # Calculate the classification metrics for test data
    f1_test = f1_score(y_test, y_pred_test, average='weighted')
    accuracy_test = accuracy_score(y_test, y_pred_test)
    recall_test = recall_score(y_test, y_pred_test, average='weighted')

    # Log the classification metrics to MLflow
    mlflow.log_metric("f1_score_test", f1_test)
    mlflow.log_metric("accuracy_test", accuracy_test)
    mlflow.log_metric("recall_test", recall_test)
XGBoost 分類子をトレーニングする
from xgboost import XGBClassifier

with mlflow.start_run() as run:
    xgb = XGBClassifier()
    xgb_id = run.info.run_id
    print(f"run_id {xgb_id}, status: {run.info.status}")
    xgb.fit(X_train_res.to_numpy(), y_train_res.to_numpy())
    signature = infer_signature(X_train_res, y_train_res)

    mlflow.xgboost.log_model(
        xgb,
        "machine_failure_model_xgb",
        signature=signature,
        registered_model_name="machine_failure_model_xgb"
    )

    y_pred_train = xgb.predict(X_train)
    # Calculate the classification metrics for training data
    f1_train = f1_score(y_train, y_pred_train, average='weighted')
    accuracy_train = accuracy_score(y_train, y_pred_train)
    recall_train = recall_score(y_train, y_pred_train, average='weighted')

    # Log the classification metrics to MLflow
    mlflow.log_metric("f1_score_train", f1_train)
    mlflow.log_metric("accuracy_train", accuracy_train)
    mlflow.log_metric("recall_train", recall_train)

    # Print the run ID and the classification metrics
    print("F1 score_train:", f1_train)
    print("Accuracy_train:", accuracy_train)
    print("Recall_train:", recall_train)

    y_pred_test = xgb.predict(X_test)
    # Calculate the classification metrics for test data
    f1_test = f1_score(y_test, y_pred_test, average='weighted')
    accuracy_test = accuracy_score(y_test, y_pred_test)
    recall_test = recall_score(y_test, y_pred_test, average='weighted')

    # Log the classification metrics to MLflow
    mlflow.log_metric("f1_score_test", f1_test)
    mlflow.log_metric("accuracy_test", accuracy_test)
    mlflow.log_metric("recall_test", recall_test)
手順 5: 最適なモデルを選択し、出力を予測する
前のセクションでは、ランダム フォレスト、ロジスティック回帰、XGBoost の 3 つの異なる分類子をトレーニングしました。 これで、プログラムによって結果にアクセスするか、ユーザー インターフェイス (UI) を使用するかを選択できるようになりました。
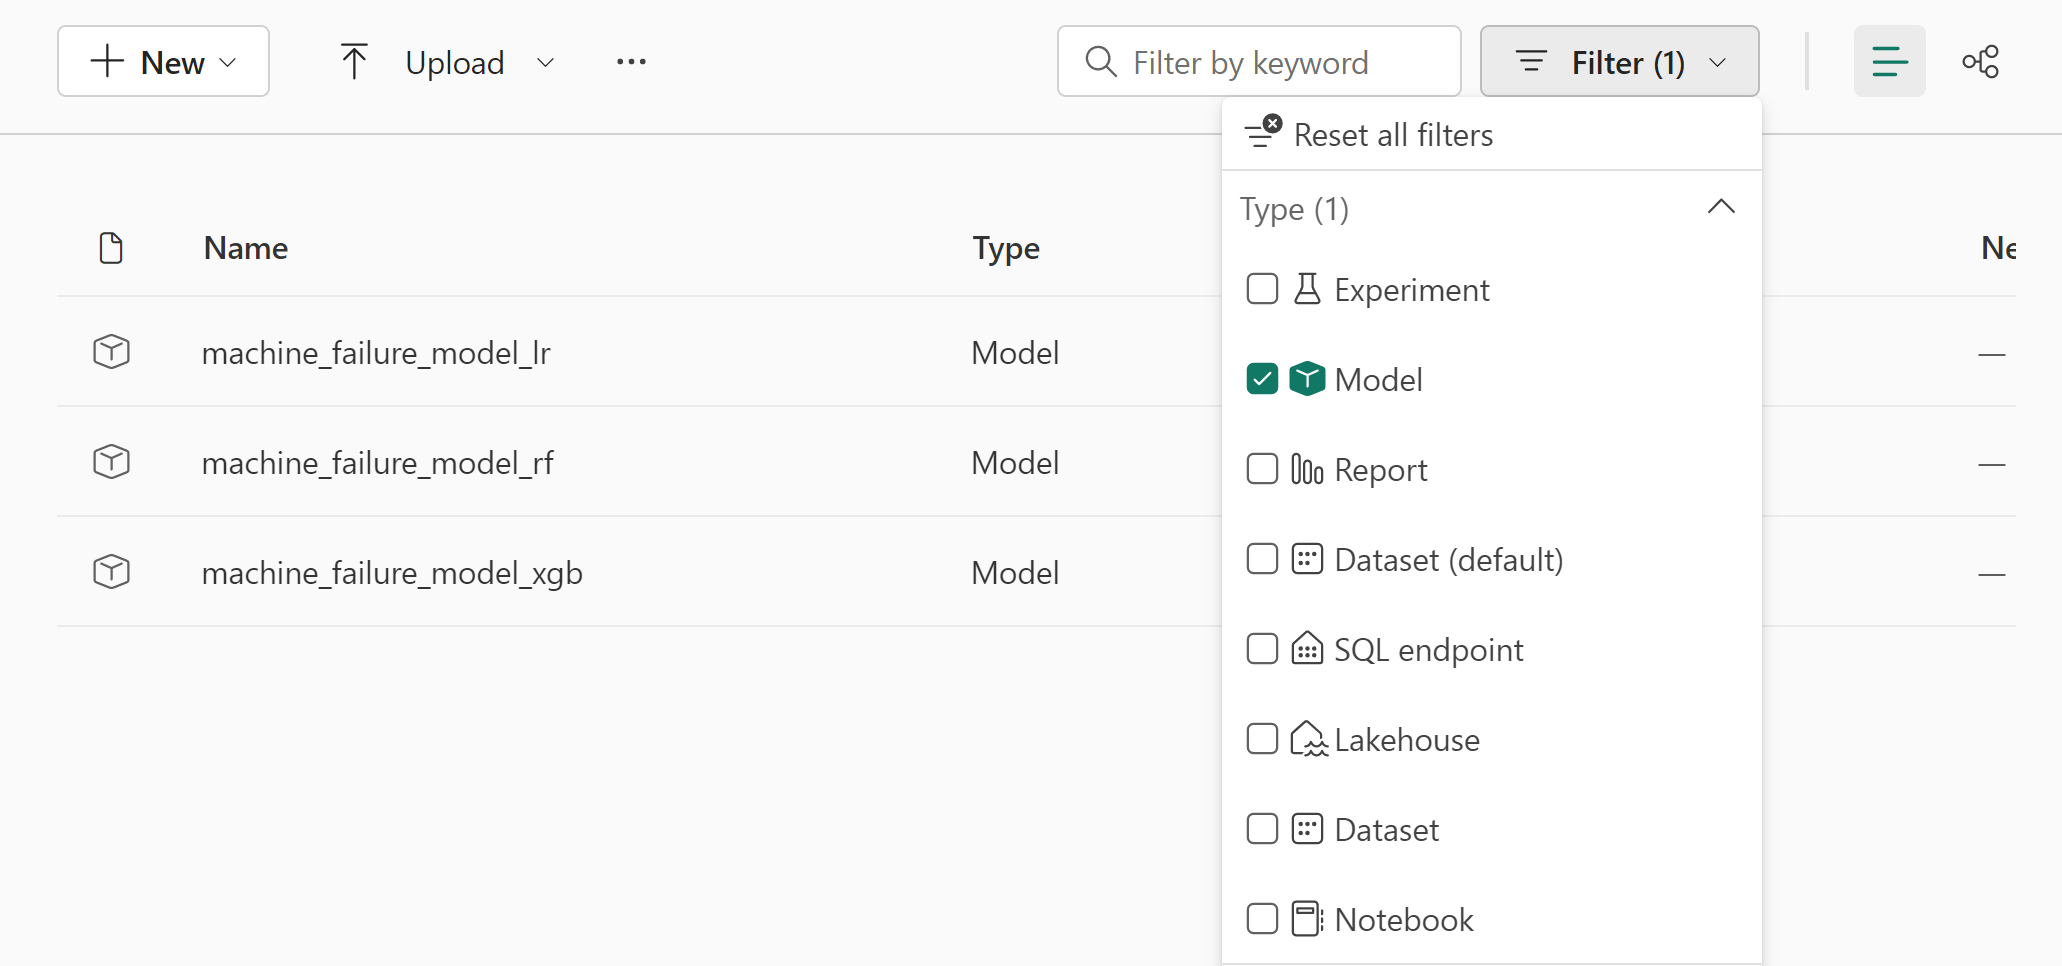
UI パス オプションの場合は、ワークスペースに移動し、モデルをフィルター処理します。
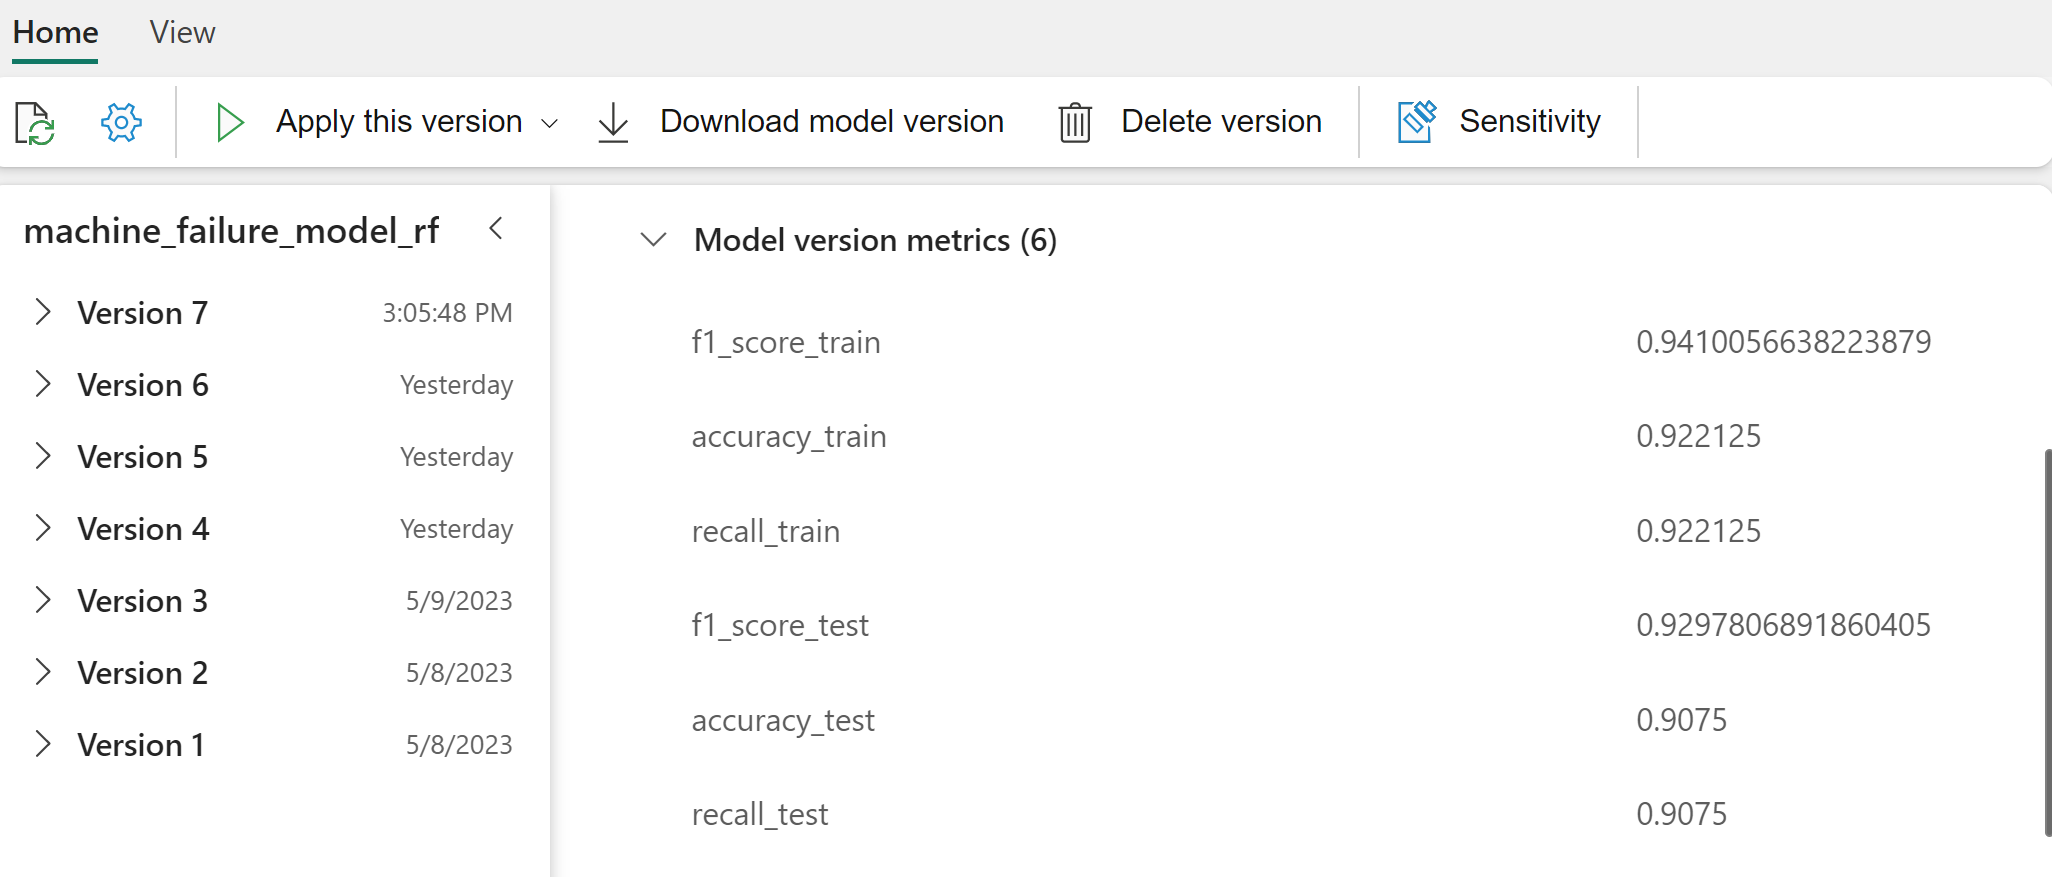
モデルのパフォーマンスの詳細については、個々のモデルを選択してください。
この例では、MLflow を使用してプログラムでモデルにアクセスする方法を示します。
runs = {'random forest classifier':   rfc_id,
        'logistic regression classifier': lr_id,
        'xgboost classifier': xgb_id}

# Create an empty DataFrame to hold the metrics
df_metrics = pd.DataFrame()

# Loop through the run IDs and retrieve the metrics for each run
for run_name, run_id in runs.items():
    metrics = mlflow.get_run(run_id).data.metrics
    metrics["run_name"] = run_name
    df_metrics = df_metrics.append(metrics, ignore_index=True)

# Print the DataFrame
print(df_metrics)
XGBoost はトレーニング セットで最適な結果を生成しますが、テスト データ セットではパフォーマンスが低くなります。 そのパフォーマンスの低下は、オーバーフィットを示しています。 ロジスティック回帰分類子は、トレーニング データセットとテスト データセットの両方でパフォーマンスが低下します。 全体的に、ランダム フォレストはトレーニングのパフォーマンスとオーバーフィットの回避のバランスを取ります。
次のセクションでは、登録済みのランダム フォレスト モデルを選択し、PREDICT 機能を使用して予測を実行します。
from synapse.ml.predict import MLFlowTransformer

model = MLFlowTransformer(
    inputCols=list(X_test.columns),
    outputCol='predictions',
    modelName='machine_failure_model_rf',
    modelVersion=1
)
推論のためにモデルを読み込むように作成した MLFlowTransformer オブジェクトを使用して、Transformer API を使用してテスト データセットのモデルにスコアを付けます。
predictions = model.transform(spark.createDataFrame(X_test))
predictions.show()
次の表に出力を示します。
| 種類 | 空気温度_[K] | プロセス温度 [K] | 回転速度_[rpm] | Torque_[Nm] | Tool_wear_[min] | 予測 |
|---|---|---|---|---|---|---|
| 0 | 300.6 | 309.7 | 1639.0 | 30.4 | 121.0 | 0 |
| 0 | 303.9 | 313.0 | 1551.0 | 36.8 | 140.0 | 0 |
| 1 | 299.1 | 308.6 | 1491.0 | 38.5 | 166.0 | 0 |
| 0 | 300.9 | 312.1 | 1359.0 | 51.7 | 146.0 | 1 |
| 0 | 303.7 | 312.6 | 1621.0 | 38.8 | 182.0 | 0 |
| 0 | 299.0 | 310.3 | 1868.0 | 24.0 | 221.0 | 1 |
| 2 | 297.8 | 307.5 | 1631.0 | 31.3 | 124.0 | 0 |
| 0 | 297.5 | 308.2 | 1327.0 | 56.5 | 189.0 | 1 |
| 0 | 301.3 | 310.3 | 1460.0 | 41.5 | 197.0 | 0 |
| 2 | 297.6 | 309.0 | 1413.0 | 40.2 | 51.0 | 0 |
| 1 | 300.9 | 309.4 | 1724.0 | 25.6 | 119.0 | 0 |
| 0 | 303.3 | 311.3 | 1389.0 | 53.9 | 39.0 | 0 |
| 0 | 298.4 | 307.9 | 1981.0 | 23.2 | 16.0 | 0 |
| 0 | 299.3 | 308.8 | 1636.0 | 29.9 | 201.0 | 0 |
| 1 | 298.1 | 309.2 | 1460.0 | 45.8 | 80.0 | 0 |
| 0 | 300.0 | 309.5 | 1728.0 | 26.0 | 37.0 | 0 |
| 2 | 299.0 | 308.7 | 1940.0 | 19.9 | 98.0 | 0 |
| 0 | 302.2 | 310.8 | 1383.0 | 46.9 | 45.0 | 0 |
| 0 | 300.2 | 309.2 | 1431.0 | 51.3 | 57.0 | 0 |
| 0 | 299.6 | 310.2 | 1468.0 | 48.0 | 9.0 | 0 |
データをレイクハウスに保存します。 その後、データは、Power BI ダッシュボードなど、後で使用できるようになります。
# Save test data to the lakehouse for use in the next section.
table_name = "predictive_maintenance_test_with_predictions"
predictions.write.mode("overwrite").format("delta").save(f"Tables/{table_name}")
print(f"Spark DataFrame saved to delta table: {table_name}")
手順 6: Power BI で視覚化を使用してビジネス インテリジェンスを表示する
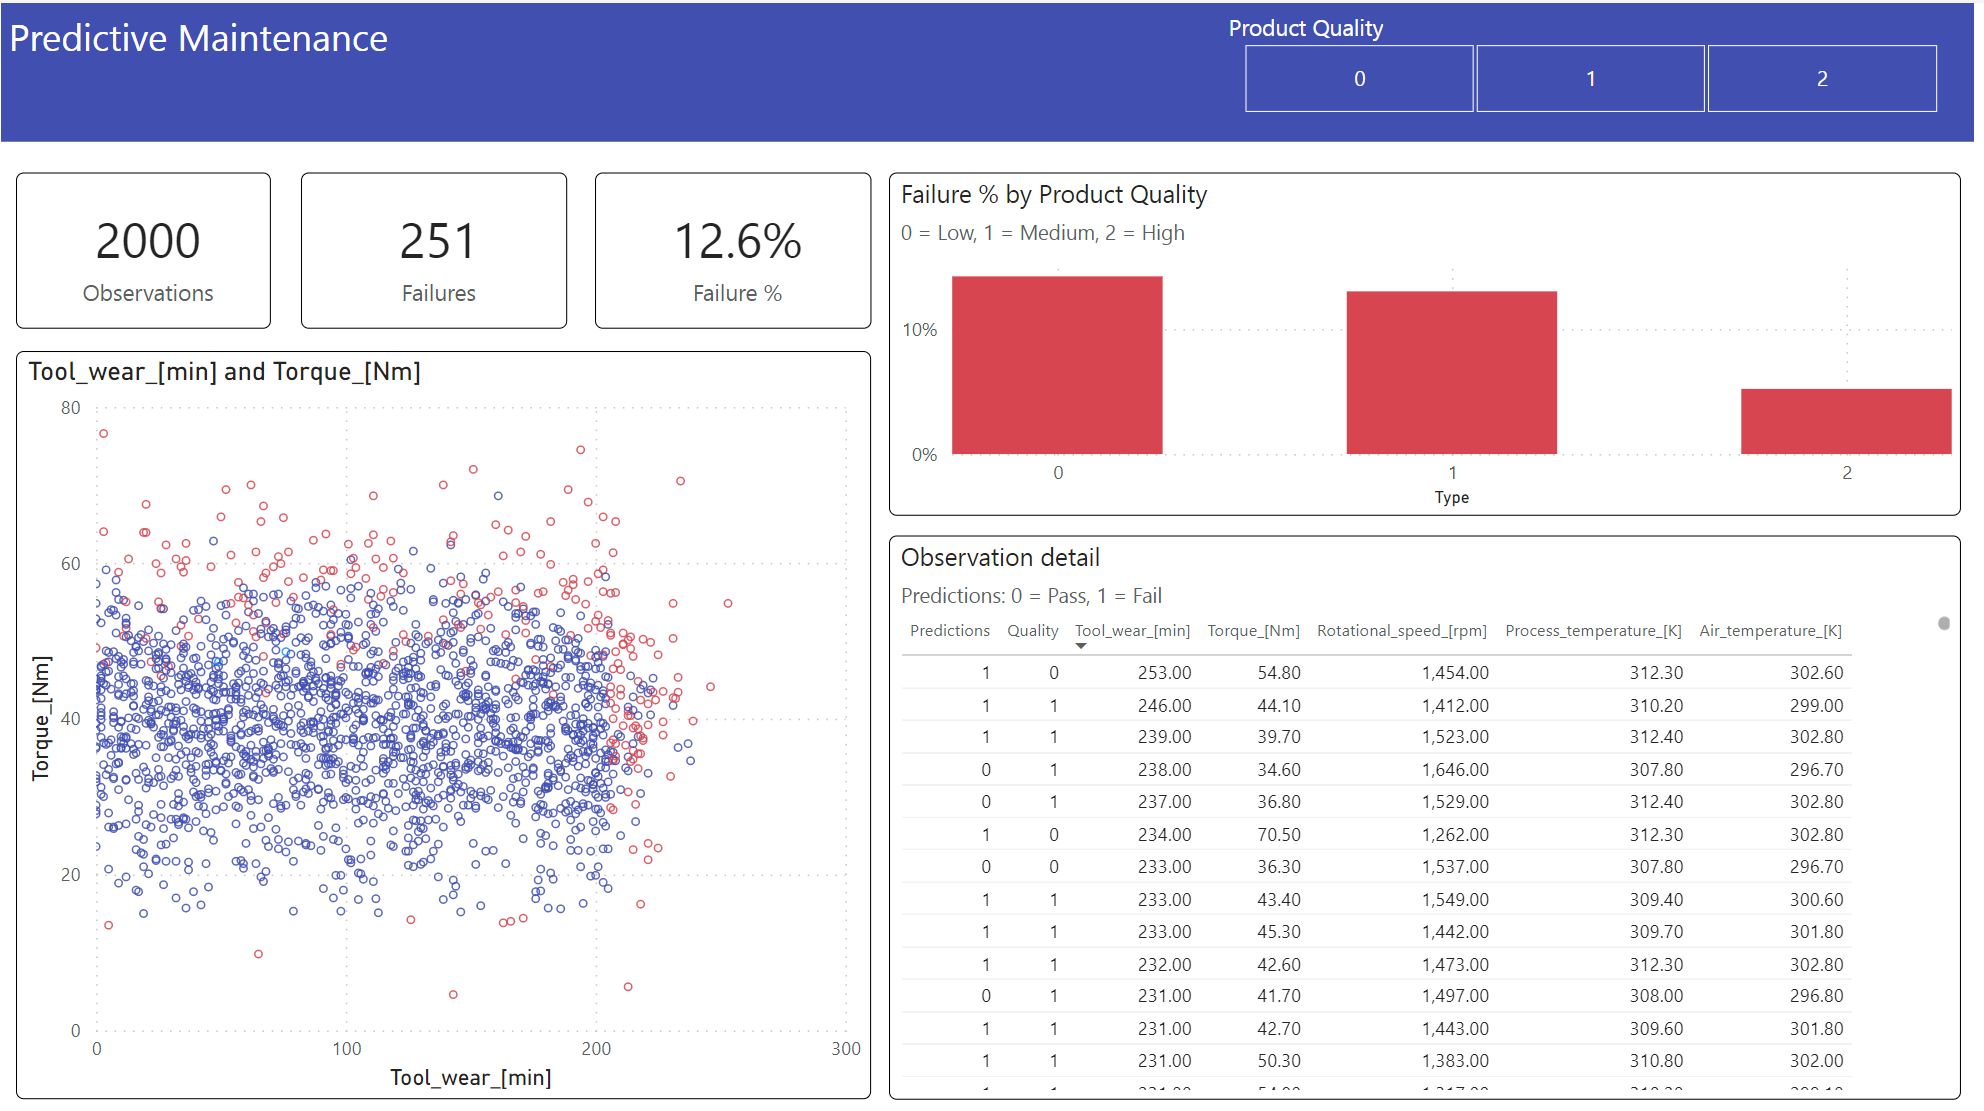
Power BI ダッシュボードを使用して、結果をオフライン形式で表示します。
ダッシュボードには、Tool_wear と Torque は、手順 2 の前の相関関係分析で予想されているように、失敗したケースと失敗していないケースの間に顕著な境界が作成されていることを示しています。
関連コンテンツ
- テキスト分類モデルのトレーニングと評価
- Microsoft Fabric での 機械学習モデル
- 機械学習モデルのトレーニング
- Microsoft Fabric での機械学習実験
