適用対象: ✅Microsoft Fabric✅Azure データ エクスプローラー✅Azure Monitor✅Microsoft Sentinel
地理空間データは、マップ上のポイント、円、バブルとして レンダー演算子 を使用して、クエリの一部として視覚化できます。
地理空間クラスタリングの詳細については、「 地理空間クラスタリング」を参照してください。
例示
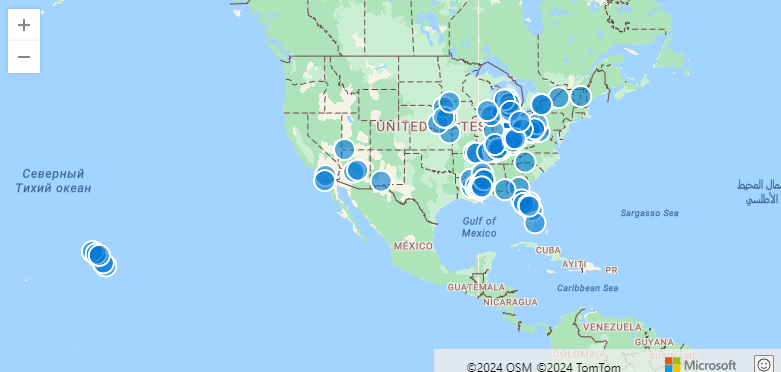
次の例では、Storm イベントを検索し、マップ上で 100 を視覚化します。
StormEvents
| take 100
| project BeginLon, BeginLat
| render scatterchart with (kind = map)
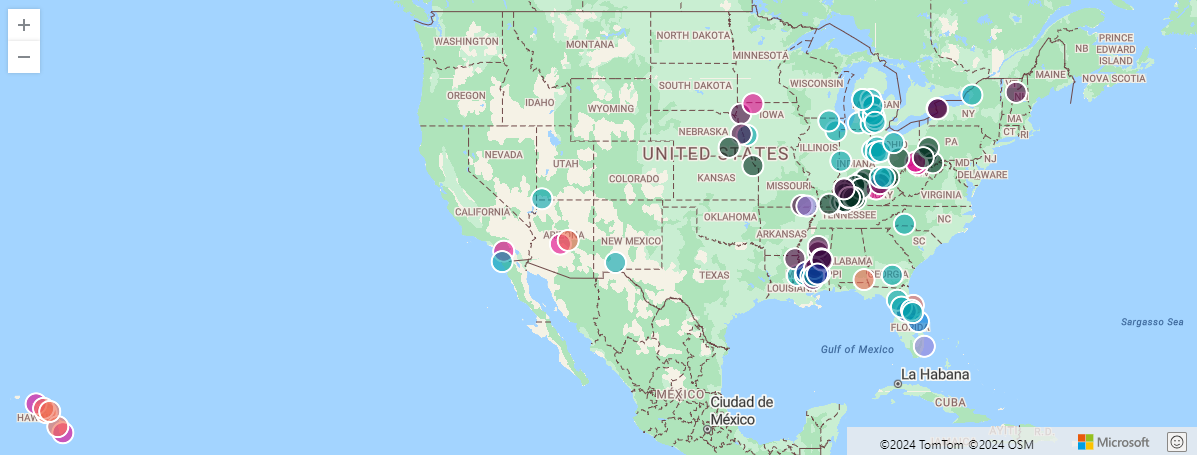
次の例では、複数の一連のポイントを視覚化します。ここで、[経度、緯度] ペアは各ポイントを定義し、3 番目の列は系列を定義します。 この例では、系列は EventType。
StormEvents
| take 100
| project BeginLon, BeginLat, EventType
| render scatterchart with (kind = map)
次の例では、マップ上の一連のポイントを視覚化します。 結果に複数の列がある場合は、xcolumn (経度)、ycolumn (緯度)、系列に使用する列を指定する必要があります。
注
複数の列の視覚化は、 Kusto.Explorer でのみサポートされています。
StormEvents
| take 100
| render scatterchart with (kind = map, xcolumn = BeginLon, ycolumns = BeginLat, series = EventType)
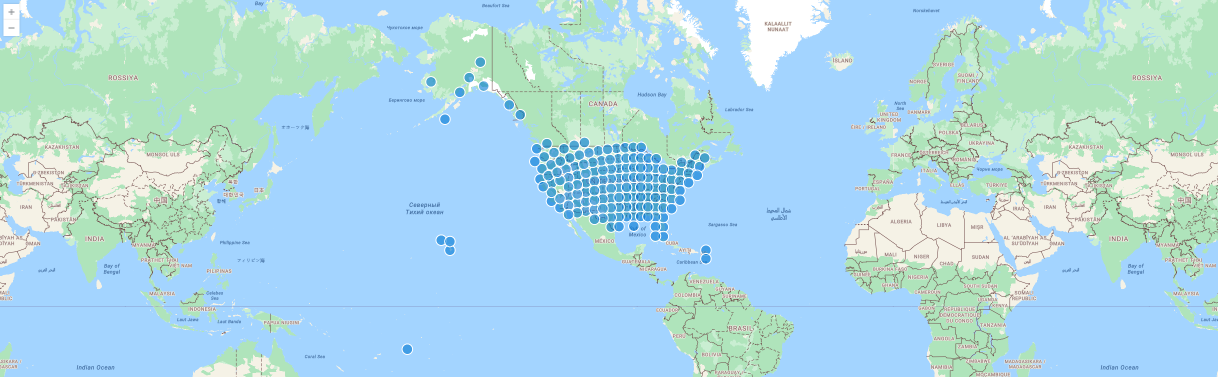
次の例では、GeoJSON 動的値を使用してマップ上のポイントを視覚化し、ポイントを定義します。
StormEvents
| project BeginLon, BeginLat
| summarize by hash=geo_point_to_s2cell(BeginLon, BeginLat, 5)
| project geo_s2cell_to_central_point(hash)
| render scatterchart with (kind = map)
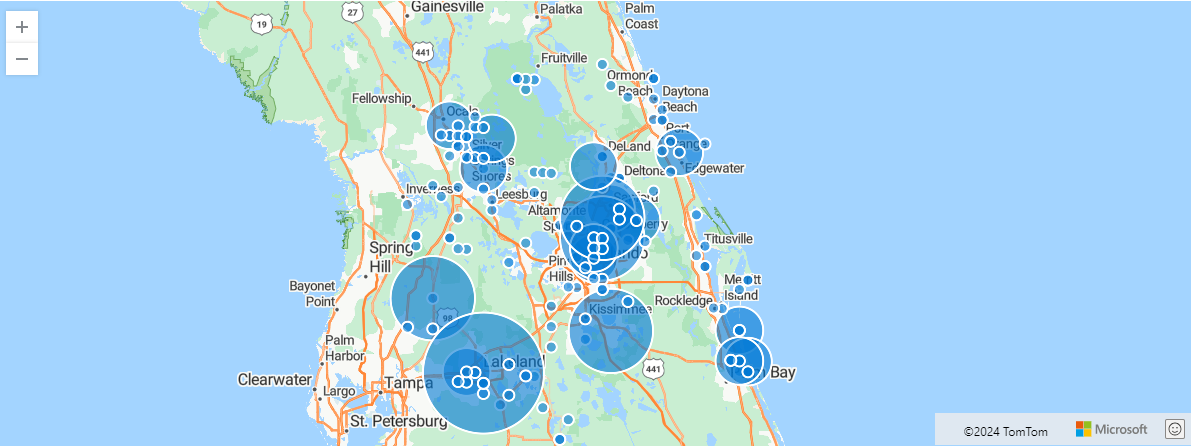
次の例は、S2 セルによって集計された Storm イベントを示しています。 このグラフは、バブル単位のイベントを 1 つの色で位置別に集計します。
StormEvents
| project BeginLon, BeginLat, EventType
| where geo_point_in_circle(BeginLon, BeginLat, real(-81.3891), 28.5346, 1000 * 100)
| summarize count() by EventType, hash = geo_point_to_s2cell(BeginLon, BeginLat)
| project geo_s2cell_to_central_point(hash), count_
| extend Events = "count"
| render piechart with (kind = map)
次の例は、S2 セルによって集計された Storm イベントを示しています。 グラフは、円グラフのイベントの種類別にイベントを場所別に集計します。
注
色軸の視覚化は、 Kusto.Explorer でのみサポートされています。
StormEvents
| project BeginLon, BeginLat, EventType
| where geo_point_in_circle(BeginLon, BeginLat, real(-81.3891), 28.5346, 1000 * 100)
| summarize count() by EventType, hash = geo_point_to_s2cell(BeginLon, BeginLat)
| project geo_s2cell_to_central_point(hash), EventType, count_
| render piechart with (kind = map)

関連するコンテンツ
- 地理空間クラスタリング
- Render 演算子
- 自動車テストフリートのデータ分析 (地理空間クラスタリングのユース ケース)
- 地理空間データの処理と分析のための Azure アーキテクチャについて説明します