このチュートリアルでは、Office JavaScript ライブラリ (Office.js) の API を使用する Excel 用の Copilot スキルを作成します。 スキルは、少なくとも 12 個の列を持ち、数値の本文データのみを含む最初のワークシートの最初のテーブルを見つけ、そのテーブル内のデータが加速する増加傾向を体現する行を見つけます。 一致する行ごとに、ワークシートに行データのグラフが追加されます。
注:
- このチュートリアルでは、Excel 用 Copilot スキルの概要 (プレビュー) と Copilot Cowork 用プラグインのビルドに関する知識があることを前提としています。 後者の記事はCoworkのコンテキストにありますが、その記事の一般的なパッケージ化、マニフェスト、アイコン、インストール、および発行のガイダンスは、Excel のスキルにも適用されます。 このチュートリアルでは、Excel 固有の部分に焦点を当て、その記事で説明されているのと同じプラグイン パッケージ モデルを使用します。
- Excel のカスタム スキルはプレビュー段階です。 運用環境の Copilot 拡張機能では使用しないでください。
ビルドする内容
1 つのスキルを使用して Microsoft 365 アプリ パッケージをビルドします。
my-copilot-plugin-skills/
|-- manifest.json
|-- color.png
|-- outline.png
|-- skills/
    |-- accelerating-growth-trend-finder/
        |-- SKILL.md
        |-- resources/
        |   |-- workbook-data-guardrails.md
        |   |-- excel-vs-agent-execution.md
        |-- scripts/
            |-- find-accelerating-growth-trend-rows.js
Office.js スクリプトは、ブックの分析と編集を実装します。
SKILL.md ファイルは、スクリプトを使用するタイミングと、結果をユーザーに説明する方法を Copilot に指示します。
成長傾向の定義の加速
このスキルでは、次の両方が当てはまる場合、行は加速する成長傾向を具体化します。
- 2 番目の列から始まる各セル値は、その左の値よりもすぐに大きくなります。
- 各増加は、2 番目のセルから 3 番目のセルへの増加から始まり、前の増加よりも大きくなります。
たとえば、次の行は修飾されます。
2, 4, 8, 15, 27, 46, 78, 130, 215, 351, 570, 921
値は厳密に増加しており、増加のサイズも厳密に大きくなります。
+2, +4, +7, +12, +19, +32, +52, +85, +136, +219, +351
前提条件
開始する前に、Copilot Cowork用のビルド プラグインの「手順 7: テスト」で説明されているように、Microsoft 365 Agents Toolkit CLI があることを確認してください。
タスク 1: プラグイン フォルダーを作成する
次のフォルダーを作成します。
my-copilot-plugin-skills/
| -- skills/
   | -- accelerating-growth-trend-finder/
       | -- resources/
       | -- scripts/
タスク 2: SKILL.md の作成
skills/accelerating-growth-trend-finder/フォルダーに、SKILL.mdという名前のファイルを作成します。次の YAML フロントマッター (2 つの
---行を含む) をファイルの一番上に追加します。metadata.tags値にはexcelが含まれており、スキル検出のためにスキルを Excel 指向として識別するのに役立ちます。--- name: accelerating-growth-trend-finder description: | Use this skill in Excel when the user asks to find rows in a workbook table that show an accelerating growth, increasingly larger increases, or numeric values that rise faster from left to right. metadata: category: Excel analysis version: 1.0.0 tags: excel, office-js, tables, trends, analysis ---重要
nameプロパティの値は、skillsフォルダーのすぐ下にある子フォルダーの名前と完全に一致している必要があります。フロントマッターの下に、次の Markdown を追加して、スキルの目的とリソースに Copilot をフォーカスします。 2 つのリソース ファイルは、後者の手順で作成します。
# Accelerating growth trend finder

Find rows in the first qualifying Excel table whose numeric values increase from left to right with increasingly larger increases.

## Reference resources

Before running the script, consult:

- `resources/workbook-data-guardrails.md`
- `resources/excel-vs-agent-execution.md`

Use these resources to confirm that the current workbook is the right source of truth, that the skill is running inside Excel, and that the user is asking for workbook analysis rather than general advice.
リソースの下に、次のワークフロー セクションを追加します。 後の手順で Office.js を呼び出す JavaScript ファイルを作成します。
## Workflow

1. Confirm that the current context is Excel.
2. Run `scripts/find-accelerating-growth-trend-rows.js` when the user asks to identify rows with an accelerating growth trend.
ワークフローの下に、出力に関する手順を示す次のセクションを追加します。 Copilot は、JavaScript がエラー状態で終了したことを認識し、"修飾テーブルが見つかりませんでした" などの独自のエラー メッセージを作成して報告できることに注意してください。ただし、コードによって返された正確なエラー メッセージを報告するために Copilot が必要なシナリオでは、それを指示できます。 Copilot チャットの出力セクションでは、両方の戦略を示します。
## Workbook output

Let `scripts/find-accelerating-growth-trend-rows.js` create charts, but do not create new worksheets or formulas.

## Copilot chat output

1. For each chart that is created, report the table name and row that is the chart's source.
2. If there are no rows with an accelerating growth trend, report the problem. Use the exact error message that is returned by `scripts/find-accelerating-growth-trend-rows.js`. Do not reword it.
3. If there are any other problems, such as no qualifying tables, report the problem.
出力手順の下に、Copilot に次のガイダンスを追加します。
## Common pitfalls to avoid

- Do not inspect tables outside the first worksheet.
- Do not analyze a table unless it has at least 12 columns.
- Do not treat the header row as numeric data.
- Do not infer, coerce, or fill missing values.
- Do not run the Office.js script outside Excel.
タスク 3: ブック データ ガードレールを追加する
skills/accelerating-growth-trend-finder/resourcesフォルダーに、workbook-data-guardrails.mdという名前の Markdown ファイルを作成します。 リソース ファイルは、シナリオ固有のブックの想定をSKILL.mdから除外しながら、スクリプトを呼び出すときの Copilot ガードレールを引き続き提供します。ファイルに次の内容を指定します。
# Workbook data guardrails

Use this reference before running the accelerating growth trend script.

## Data requirements

- Use only the first worksheet in the current workbook.
- Use the first table on that worksheet that has at least 12 columns.
- Ignore the table header row when checking whether the data is numeric.
- Require every table body cell to contain a finite number.
- Stop at the first table that satisfies the column-count and numeric-data requirements.

## Search rules

- Do not search other worksheets.
- Do not search loose ranges outside Excel tables.
- Do not rename sheets, tables, or headers.
- Do not create helper columns or formulas before running the script.

## Quality checks

- If no table qualifies, report that no qualifying table was found.
- If a table qualifies but no rows match, report that no rows in the qualifying table embody the trend.
- Treat blank cells, text, errors, booleans, and dates that aren't returned as numbers as nonnumeric data.
- If the user requests exponential trend data, report to the user that you will look for accelerating growth trend data, and that while all exponential trends are accelerating growth trends, the converse is not the case, so some of the trends you find may not be exponential.
タスク 4: Excel の実行ガイダンスを追加する
skills/accelerating-growth-trend-finder/resourcesフォルダーに、excel-vs-agent-execution.mdという名前の Markdown ファイルを作成します。 Excel のコンテキストの外部でスキルにアクセスできる場合があるため、このファイルのルールが必要です。この場合、Office.js API を実行できません。 スキルが Excel の外部で実行されている場合、Copilot はブックを分析したふりをしないでください。次の内容を提供します。
# Excel vs non-Excel execution guidance

## When the skill runs inside Excel

- Use the workbook as the source of truth.
- Follow the instructions in the **Workflow**, **Workbook output**, and **Copilot chat output** sections of the SKILL.md file.

## When the skill runs outside Excel

- Do not claim that workbook rows were analyzed.
- Explain that the skill can only be used in Copilot in Excel.
- Ask the user to open the workbook in Excel and invoke the skill there.

## When to use the scripts folder

- Run `scripts/find-accelerating-growth-trend-rows.js` only when the user asks to find table rows with accelerating, or increasingly larger left-to-right growth.
- Do not run the script for general explanations of accelerating growth growth.
- Do not run the script when the current environment cannot execute Excel Office.js APIs.
タスク 5: Office.js を呼び出すスクリプトを追加する
skills/accelerating-growth-trend-finder/scriptsフォルダーに、find-accelerating-growth-trend-rows.jsという名前の JavaScript ファイルを作成します。ファイルに次の内容を指定します。 このコードについては、次の点に注意してください。
- スクリプトは 1 つの関数の宣言で構成され、関数を 呼び出す コードはありません。 Copilot は、スキルが呼び出されたときに関数を呼び出す必要があることを理解しています。
- スクリプトは
Office.onReadyを呼び出したり、Office.initializeを定義したりしません。 Copilot はランタイムを作成し、Office.js を初期化し、スキル スクリプトを実行します。 - スクリプトは、最初のワークシートのみを検索するように設計されています。 これは、スキルが迅速に処理されるようにするためです。
- スクリプトは、特定の条件を満たすテーブルのみを検査するように設計されています。 これは、エラーを処理するさまざまな方法を示す複数のエラー パスを提供するためです。
- このスクリプトは、後の手順で作成したヘルパー メソッド (
findFirstQualifyingTable、hasAcceleratingGrowthTrend、createAndPositionChart) を呼び出します。 -
findFirstQualifyingTableの呼び出しがnullを返す場合、スクリプトは単純なreturn;ステートメントで終了します。 Copilot は問題を認識し、独自のエラー メッセージを作成します。 - 増加が加速する行が見つからないため、グラフが作成されない場合、スクリプトは明示的なエラー メッセージを返します。
SKILL.mdファイルは、このエラー メッセージを正確に使用するように Copilot に指示します。 - ブック自体がすべての入力を提供するため、関数はパラメーターなしです。
注:
Office.js ベースのスキルのプレビューでは、Office.js を呼び出す関数へのパラメーターの渡しはサポートされていません。 今後、このサポートを提供できるように努力しています。
await Excel.run(async (context) => {
    const firstWorksheet = context.workbook.worksheets.getFirst();

    const tables = firstWorksheet.tables;
    tables.load("items");
    await context.sync();

    const tableInfo = await findFirstQualifyingTable(tables.items);

    if (!tableInfo) {
        return;
    }

    const {
        table: matchingTable,
        tableRange: matchingTableRange,
        dataRange: matchingDataRange
    } = tableInfo;

    let createdCharts = [];

    // Review each row in the qualifying table's data body.
    for (let rowOffset = 0; rowOffset < matchingDataRange.values.length; rowOffset += 1) {
      const row = matchingDataRange.values[rowOffset];

      // If the row doesn't have an accelerating growth trend and there's another row,
      // check the next row. Otherwise, end the row checking loop without creating a chart.
      if (!hasAcceleratingGrowthTrend(row)) {
        continue;
      }

      // The row has an accelerating growth trend, so create a chart for it.
      await createAndPositionChart(firstWorksheet, matchingTable, matchingTableRange, matchingDataRange, rowOffset);

      createdCharts.push({
            tableName: matchingTable.name,
            worksheetRowNumber: matchingDataRange.rowIndex + rowOffset + 1
      });
    }

    await context.sync();

    if (createdCharts.length === 0) {
        return "No rows with an accelerating growth trend were found.";
    }

    return;
});
コールバックの末尾と 内部に、次のヘルパー メソッドを
Excel.runに追加します。 メソッドは、意味のある傾向を持つかどうかを判断するテーブルの指定された配列内の最初のテーブルを見つけることに注意してください。 修飾テーブルには、次の要素があります。- 少なくとも 12 列。
- 少なくとも 1 つのデータ行。
- データ本文のすべての数値。
async function findFirstQualifyingTable(tables) {
    for (const table of tables) {
        const tableRange = table.getRange();
        const rows = table.rows;

        table.load("name");
        tableRange.load(["columnCount", "rowIndex", "columnIndex", "rowCount"]);
        rows.load("count");

        await context.sync();

        if (tableRange.columnCount < 12 || rows.count === 0) {
            continue;
        }

        const dataRange = table.getDataBodyRange();

        dataRange.load([ "values", "rowIndex", "rowCount", "columnCount"]);

        await context.sync();

        const isEntirelyNumeric = dataRange.values.every((row) =>
            row.every(
                (value) =>
                    typeof value === "number" &&
                    Number.isFinite(value)
            )
        );

        if (isEntirelyNumeric) {
            return { table,  tableRange, dataRange };
        }
    }

    return null;
}
コールバックの末尾と 内部に、次のヘルパー メソッドを
Excel.runに追加します。 このメソッドは、行の増加傾向が加速しているかどうかを判断します。function hasAcceleratingGrowthTrend(row) { let previousIncrease = null; for (let columnIndex = 1; columnIndex < row.length; columnIndex += 1) { const increase = row[columnIndex] - row[columnIndex - 1]; if (increase <= 0 || (previousIncrease !== null && increase <= previousIncrease)) { return false; } previousIncrease = increase; } return true; }コールバックの末尾と 内部に、次のヘルパー メソッドを
Excel.runに追加します。 メソッドは、0 から始まる列インデックスを Excel 列の文字に変換します。 次に例を示します。- 0 -> A
- 1 -> B
- 25 -> Z
- 26 -> AA
function columnIndexToLetters(columnIndex) {
    let letters = "";
    let n = columnIndex + 1;

    while (n > 0) {
        const remainder = (n - 1) % 26;
        letters = String.fromCharCode(65 + remainder) + letters;
        n = Math.floor((n - 1) / 26);
    }

    return letters;
}
コールバックの末尾と 内部に、次のヘルパー メソッドを
Excel.runに追加します。 メソッドは、一致する 1 つのテーブル行の折れ線グラフを作成して配置します。 このコードについては、次の点に注意してください。- グラフは、最初は完全なテーブル範囲に基づいています。
- 一致しない行の系列は破棄されます。
- グラフは、テーブルの右側に 1 列配置され、一致するデータ行に垂直に配置され、幅が 7 列、高さが 15 行に設定されます。
async function createAndPositionChart(worksheet, table, tableRange, dataRange, rowOffset) {

    // The worksheet row number, one-based, for the matching data row.
    const worksheetRowNumber = dataRange.rowIndex + rowOffset + 1;

    // ChartSeriesBy.rows means each data row becomes a chart series,
    // while the table headers provide the X-axis category labels.
    const chart = worksheet.charts.add(Excel.ChartType.line, tableRange, Excel.ChartSeriesBy.rows);

    chart.series.load("count");
    await context.sync();

    // Remove every series except the one for the matching row.
    for (let seriesIndex = chart.series.count - 1; seriesIndex >= 0; seriesIndex -= 1) {
        if (seriesIndex !== rowOffset) {
        chart.series.getItemAt(seriesIndex).delete();
        }
    }

    chart.title.text = `${table.name} - Row ${worksheetRowNumber}`;
    chart.title.visible = true;

    // The only chart elements should be axes and gridlines.
    chart.legend.visible = false;

    chart.axes.categoryAxis.visible = true;
    chart.axes.valueAxis.visible = true;

    chart.axes.valueAxis.majorGridlines.visible = true;
    chart.axes.valueAxis.minorGridlines.visible = false;

    chart.dataLabels.showValue = false;
    chart.dataLabels.showCategoryName = false;
    chart.dataLabels.showSeriesName = false;

    // Position the chart one column to the right of the table.
    const chartStartColumn = tableRange.columnIndex + tableRange.columnCount + 1;

    // Align the chart's top edge with the matching data row.
    const chartStartRow = dataRange.rowIndex + rowOffset;

    // Make the chart 7 columns wide and 15 rows tall.
    const chartEndColumn = chartStartColumn + 6;
    const chartEndRow = chartStartRow + 14;

    const startCell = `${columnIndexToLetters(chartStartColumn)}${chartStartRow + 1}`;
    const endCell = `${columnIndexToLetters(chartEndColumn)}${chartEndRow + 1}`;

    chart.setPosition(startCell, endCell);
}
タスク 6: マニフェストを作成する
ルート フォルダー
my-copilot-plugin-skillsにmanifest.jsonファイルを作成します。ファイルに次の内容を指定します。 2 つのアイコン ファイルは、後の手順で追加します。
{
  "$schema": "https://developer.microsoft.com/json-schemas/teams/v1.29/MicrosoftTeams.schema.json",
  "manifestVersion": "1.29",
  "version": "1.0.0",
  "id": "00000000-0000-0000-0000-000000000000",
  "developer": {
    "name": "Contoso",
    "websiteUrl": "https://www.contoso.com",
    "privacyUrl": "https://www.contoso.com/privacy",
    "termsOfUseUrl": "https://www.contoso.com/terms"
  },
  "name": {
    "short": "Accelerating Growth Trends",
    "full": "Accelerating Growth Trend Finder for Excel"
  },
  "description": {
    "short": "Find Excel table rows with accelerating numeric growth.",
    "full": "A Copilot skill for Excel that uses Office.js to find rows in a workbook table where values increase from left to right with increasingly larger increases."
  },
  "icons": {
    "color": "color.png",
    "outline": "outline.png"
  },
  "accentColor": "#217346",
}
最初の 2 行の
1.29文字列を、Microsoft 365 統合マニフェスト スキーマの最新バージョンの番号に置き換えます。プレースホルダー "id" の値をランダムに生成された GUID に置き換えます。
開発者 URL をアプリの値に置き換えます。
ルート オブジェクトに次の
"agentSkills"を追加します。"agentSkills": [ { "folder": "./skills/accelerating-growth-trend-finder" } ]
注:
スキルは Office.js を呼び出しますが、ランタイムを構成するためにマニフェストに "extensions" セクションは必要ありません。 Excel の Copilot はランタイムを作成し、その中に Office.js を読み込みます。
タスク 7: アイコンを追加する
ルート フォルダー my-copilot-plugin-skillsに必要なパッケージ アイコンを追加します。 アイコンのサイズ要件の詳細については、「 アイコン」を参照してください。
ヒント
必要なファイルをすばやく取得するには、Microsoft 365 Agent Toolkit を使用して、あらゆる種類の Microsoft 365 用アプリを作成します。 作成されるプロジェクトには、必要なcolor.pngが含まれており、通常は assets という名前のフォルダーにoutline.pngされます。 スキル プロジェクトのルートにコピーします。
タスク 8: スキルをパッケージ化する
my-copilot-plugin-skillsルートから、任意の ZIP ユーティリティを使用して、ZIP のルートにあるマニフェスト、アイコン、skills フォルダーを含む ZIP ファイルを作成します。 ZIP ファイルの構造は次のとおりです。
|-- manifest.json
|-- color.png
|-- outline.png
|-- skills/
    |-- accelerating-growth-trend-finder/
        |-- SKILL.md
        |-- resources/
            |-- workbook-data-guardrails.md
            |-- excel-vs-agent-execution.md
        |-- scripts/
            |-- find-accelerating-growth-trend-rows.js
タスク 9: Excel でテストする
パッケージをインストールするには、Copilot Cowork用のビルド プラグインの 「手順 7: テスト」のテスト ガイダンスに従います。
次の条件を満たす最初のワークシートに少なくとも 1 つのテーブルを含むブックを作成または開きます。
ヘッダー行が含まれます。
少なくとも 12 列を含む。
テーブル本文には数値のみが含まれます。 (ヘッダー行にはテキストを含めることができます)。
少なくとも次の行があります。
- 「加速成長傾向の定義」で前述したように、加速する 成長傾向の両方の条件を満たす行。
- 最初の条件を満たすが、2 番目の条件を満たしていない行。
- どちらの条件も満たしていない行。
テストに適したテーブル内のデータの例を次に示します。
Q1 Q2 Q3 Q4 Q5 Q6 Q7 Q8 Q9 Q10 Q11 Q12 2 4 8 15 27 46 78 130 215 351 570 921 10 20 30 40 50 60 70 80 90 100 110 120 1 97 4018 22 98 506 83 0 5.7 -7 11 5 値と増加の両方が厳密に増加するため、最初の行が条件を満たしています。 2 番目の行は、増加が一定であるために行われません。 3 つ目は、値が厳密に大きくなるわけではないためです。
Excel で Copilot を開きます。
スキルが次の手順でインストールされていることを確認します。
チャット領域の + アイコンを選択します。
開いたドロップダウンの [ すべてのスキル ] オプションは、最初は無効になります。 有効になるまで待ってから選択します。
チャット テキスト ボックスに「 @accelerating-growth-trend-finder」と入力します。 スキルはスキルの一覧に表示されます。
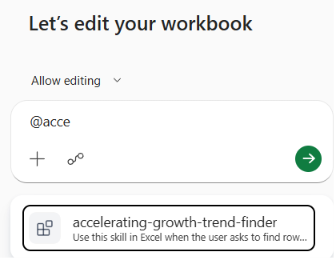
名前の上のバックスペースを使用してチャットをクリアします。
チャットで、スキルに、増加傾向が加速しているテーブル行を見つけましょう。 プロンプトのどこかで、フォーム
@skill-nameでスキルの完全な名前をメンションする必要があります。 この場合は、@accelerating-growth-trend-finderを使用します。 次に例を示します。@accelerating-growth-trend-finder, find rows in this workbook that show an accelerating growth trend.Find rows in this workbook that show an accelerating growth trend using @accelerating-growth-trend-finder.Copilot は、スキルを呼び出し、
find-accelerating-growth-trend-rows.js実行し、一致する行のグラフを作成し、次の 2 つの画像と同様に、一致するワークシートの行番号をチャットに報告する必要があります。 チャット内の Copilot 応答は決定的ではありません。そのため、下のスクリーンショットとツールの実行間の違いが表示される場合があります。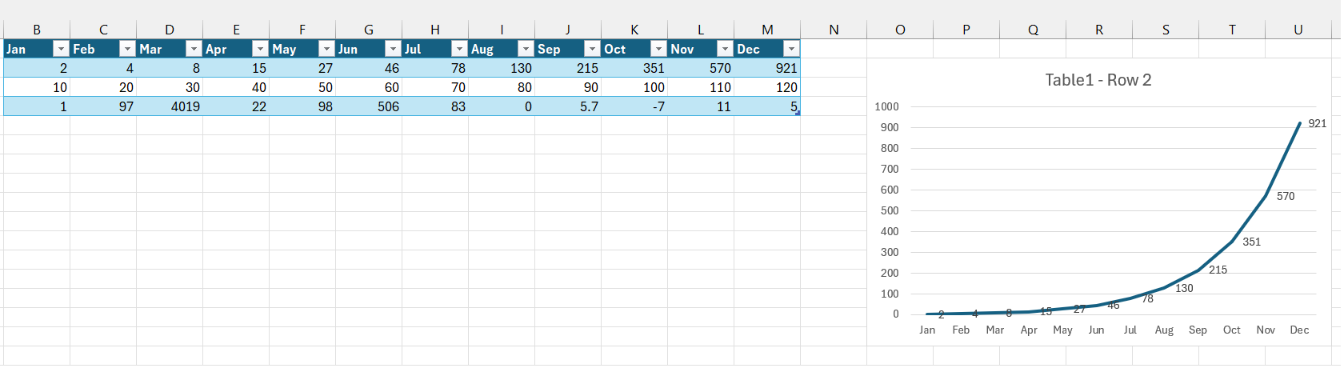
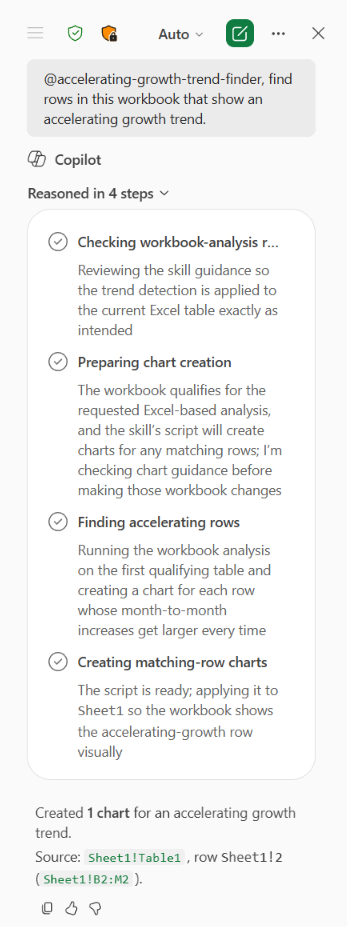
上部には、"@accelerating-growth-trend-finder" と読み取るユーザーのプロンプトが表示され、このブック内の加速する成長傾向を示す行を見つけます。 この Copilot の下には、それぞれの説明を含む 4 つの主要な手順が記載されています。 順序は '1 です。 ブック分析ルールを確認する。 傾向検出が意図したとおりに現在の Excel テーブルに適用されるようにスキル ガイダンスを確認します。 2. グラフ作成の準備。 ブックは要求された Excel ベースの分析に適格であり、スキルのスクリプトは一致する行のグラフを作成します。これらのブックを変更する前に、グラフのガイダンスを確認しています。 3。 高速化する行の検索。 1 つ目の対象テーブルでブック分析を実行し、毎月増加する各行のグラフを作成すると、毎回大きくなります。 4. 一致する行グラフの作成。 スクリプトの準備ができました。シート 1 に適用すると、ブックに加速成長行が視覚的に表示されます。 この手順の説明の下に、Copilot は「作成された 1 グラフ」というテキストを使用して作成した内容をまとめ、成長傾向を加速します。ソース: Sheet1!Table1、行 Sheet1!2 (Sheet1!B2:M2)。'
テーブルが修飾されないように変更します。たとえば、列の数を 12 未満に減らすか、テーブル本体のセルのいずれかに数値以外のデータを配置します。
プロンプトを Copilot に繰り返します。 Copilot は独自のエラー メッセージを作成し、チャットで報告する必要があります。
テーブルが再び修飾されるように変更を元に戻します。
増加傾向が加速している行を削除します。
プロンプトを Copilot に繰り返します。 Copilot は、コード内の正確なエラー メッセージを報告する必要があります。"増加傾向が加速している行が見つかりませんでした"。
各テスト セッションの後、次の手順でスキルをアンインストールします。
Teams を開き、スキルのインストールに使用した資格情報と同じ資格情報でサインインしていることを確認します。
Teams アプリ バーで、[アプリ] ボタンを選択します。
[ アプリ ] ウィンドウで、[ アプリの管理] を選択します。
アプリの一覧で [ 加速する成長傾向 ] アドインを見つけます。
アドインを選択して、その行を展開します。

ごみ箱のアイコンを選択し、プロンプトで [削除 ] を選択します。
トラブルシューティング
| 問題 | 考えられる原因 | 修正プログラム |
|---|---|---|
| スキルがトリガーされない。 | ユーザー要求がスキルの説明と一致しないか、スキル パッケージがインストールされていません。 | アンインストール手順を実行し、パッケージを再インストールします。 |
| Copilot は、スクリプトを実行できないと言います。 | スキルは Excel の外部で実行されています。 | Excel でブックを開き、そこでスキルを呼び出します。 |
| 間違ったテーブルが分析されます。 | 最初のワークシートの以前のテーブルも修飾されます。 | 目的のテーブルが最初に修飾されたテーブルになるように、テーブルの移動、名前の変更、または調整を行います。 |
GitHub で Microsoft と共同作業する
このコンテンツのソースは GitHub にあります。そこで、issue や pull request を作成および確認することもできます。 詳細については、共同作成者ガイドを参照してください。
Office Add-ins