演習 - CPU 使用率が高いマシンを特定する
ここでは、合計コンピューティング容量に達したか、近づいているマシンと、使用率の低いマシンを把握するために、Perf テーブルからデータを取得して変換する KQL クエリを作成します。
1. 目標を設定する
パフォーマンス問題に対処し、潜在的な問題を軽減し、運用効率を向上できる可能性を特定するために、IT 環境内にある仮想マシンの中央処理装置 (CPU) 使用率を分析する必要があります。
CPU 関連のパフォーマンス問題を特定し、効率を向上できる可能性を見極めるには、次の情報が必要です。
- アクティブな各マシンの CPU 使用率の傾向。
- ピーク時と平常時のマシンの CPU 使用率。
2. ログを評価する
Windows および Linux エージェントでは、監視対象のマシンで実行されているハードウェア コンポーネント、オペレーティング システム、アプリケーションのパフォーマンス カウンターを Azure Monitor の Perf テーブルに送信します。
Perf テーブルに対して簡単なクエリを実行して、過去 24 時間のログを取得し、テーブル スキーマとテーブルに保持されているデータを把握することにしましょう。
ここをクリックして Log Analytics のデモ環境でクエリを実行する
Perf  // The table you’re querying
| where TimeGenerated > ago(1d) // Filters for entries generated in the past day

TimeGenerated、Computer、ObjectName、CounterName、InstanceName、CounterValue の各列に、分析に関連があるデータが保持されていることがわかります。
ObjectName 列には、Azure Monitor で監視対象マシンからデータを収集するすべてのオブジェクトの名前が一覧表示されています。 CounterName 列には、Azure Monitor によって収集されるさまざまなパフォーマンス カウンターの名前が保持されています。 これらのどちらの列にも、多数の値が保持されており、その多くは複数回出現しています。 これらの列の値を明確に区別し、現在の分析に関連するカウンターを決定するために、次のクエリを実行してみましょう。
ここをクリックして Log Analytics のデモ環境でクエリを実行する
Perf // The table you’re querying
| distinct ObjectName,CounterName // Lists distinct combinations of ObjectName and CounterName values
次のスクリーンショットは、過去 24 時間の CounterName 列内にある ObjectName と CounterName の値の個別の組み合わせを示しています。

% Processor Time カウンターにより、プロセッサ、つまり中央処理装置 (CPU) の使用率を把握できます。 これこそが、必要としている情報です。
このデータをどのように使用できるか、またどの KQL 演算がデータの抽出と変換に役立つかを評価してみましょう。
| Column | 説明 | 分析の目標 | 関連する KQL 演算 |
|---|---|---|---|
TimeGenerated |
仮想マシンによって各ログが生成された時期を示します。 | 分析の時間範囲を定義する。 | where TimeGenerated > ago(1d) 詳細については、「ago()」、「where 演算子」、「数値演算子」を参照してください。 |
Computer |
イベントの収集元のコンピューター。 | CPU 使用率を特定のコンピューターに関連付ける。 | summarize... by Computer 詳細については、「summarize 演算子」を参照してください。 |
ObjectName |
テーブルにパフォーマンス データが保持されているすべてのオブジェクトの名前が保持されています。 | プロセッサのパフォーマンスを監視する。 | where ObjectName == "Processor" 詳細については、「== (等号) 演算子」を参照してください。 |
CounterName |
テーブル内のすべてのパフォーマンス カウンターの名前が保持されています。 | % Processor Time パフォーマンス カウンターを監視します。 |
where CounterName == "% Processor Time" 詳細については、「where 演算子」および「== (等号) 演算子」を参照してください。 |
InstanceName |
監視対象オブジェクトの監視対象インスタンスを一覧表示します。 | すべてのプロセッサ コアを監視する。 | where InstanceName == "_Total" 詳細については、「where 演算子」および「== (等号) 演算子」を参照してください。 |
CounterValue |
カウンターの収集された測定値。 | % Processor Time パフォーマンス カウンターのパフォーマンス測定値を取得する。 |
summarize min(CounterValue), avg(CounterValue), max(CounterValue), percentiles(CounterValue, 90,99) 詳細については、「summarize 演算子」と、集計関数「min()」、「max()」、「avg()」、「percentiles()」を参照してください。 |
3. クエリを作成する
過去 1 日間のすべてのマシンの平均、最小、最大 CPU 使用率をまとめるクエリを作成します。
過去 1 日間に生成され、
% Processor Timeパフォーマンス カウンターが報告されたすべてのログを取得します。ここをクリックして Log Analytics のデモ環境でクエリを実行する。
Perf  // The table you’re querying
| where TimeGenerated > ago(1d) and ObjectName == "Processor" and CounterName == "% Processor Time" and InstanceName == "_Total" // Filters for entries generated in the past day related to total processor time measurements
次のクエリでは、過去 1 日間の合計プロセッサ時間の測定値に関連するすべてのログを取得します。

最小、最大、平均カウンター値を検出し、各コンピューターの 90 番目と 99 番目のパーセンタイル カウンター値を計算します。
ここをクリックして Log Analytics のデモ環境でクエリを実行する
Perf  // The table you’re querying
| where TimeGenerated > ago(1d) and ObjectName == "Processor" and CounterName == "% Processor Time" and InstanceName == "_Total" // Filters for entries generated in the past day related to total processor time measurements
| summarize min(CounterValue), avg(CounterValue), max(CounterValue), percentiles(CounterValue, 90,99) by Computer // Presents the minimum, maximum, average, 90th and 99th percentile counter values for each computer
次のクエリ結果セットは、Log Analytics ワークスペース内にデータがある各コンピューターの最小、最大、平均、90 番目、99 番目の
% Processor Timeカウンターのパーセンタイル値を示します。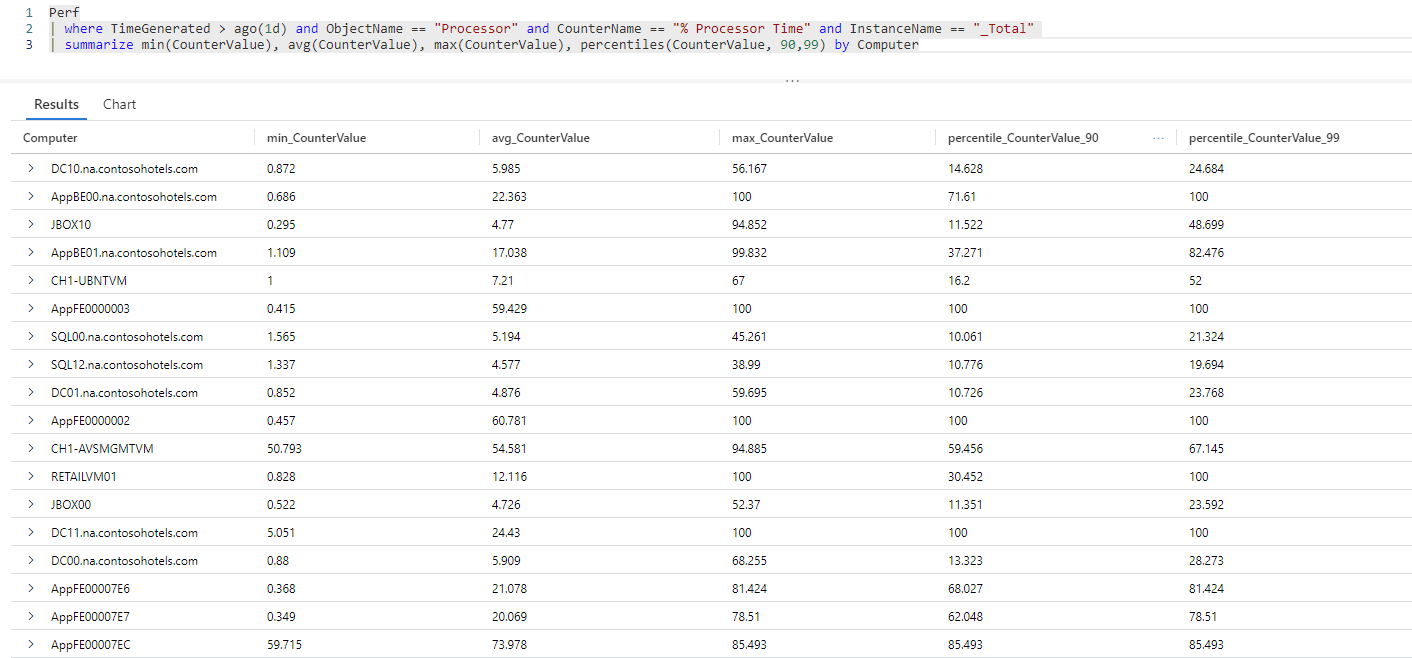
90 番目と 99 番目のパーセンタイルの範囲内で
% Processor Timeカウンター値が 80 を超えるエントリでクエリ結果をフィルター処理します。ここをクリックして Log Analytics のデモ環境でクエリを実行する
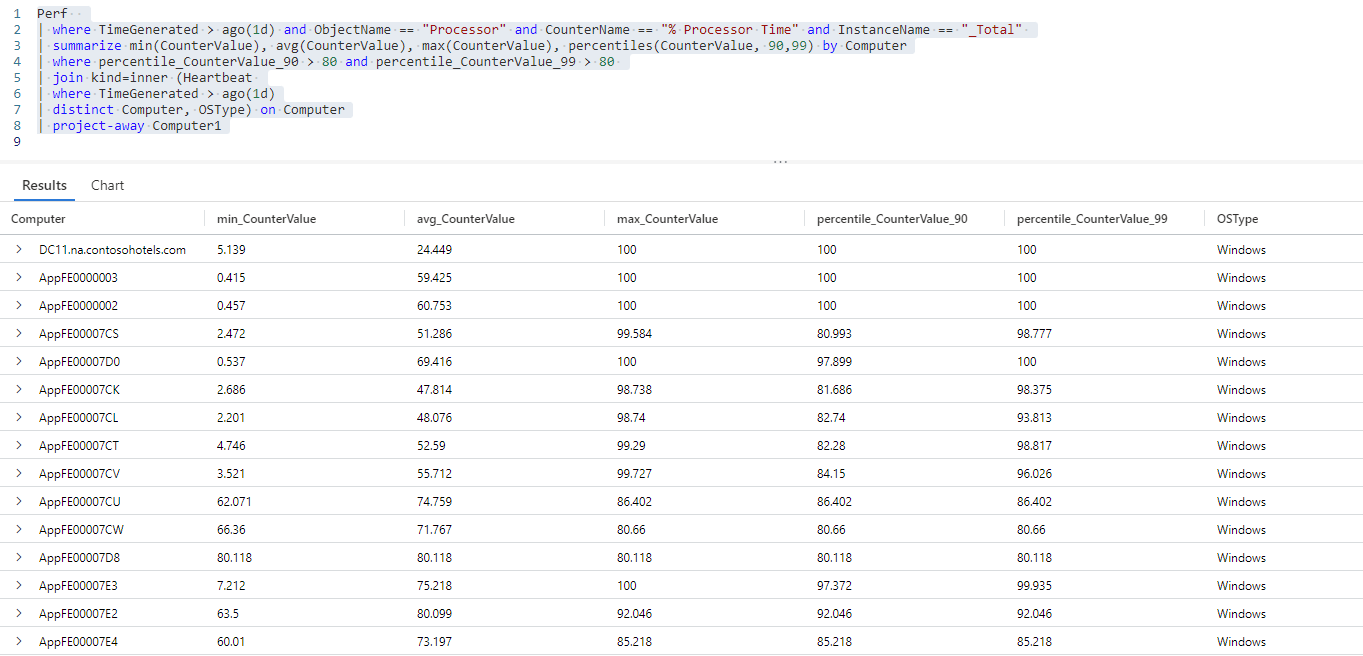
Perf  // The table you’re querying
| where TimeGenerated > ago(1d) and ObjectName == "Processor" and CounterName == "% Processor Time" and InstanceName == "_Total" // Filters for entries generated in the past day related to total processor time measurements
| summarize min(CounterValue), avg(CounterValue), max(CounterValue), percentiles(CounterValue, 90,99) by Computer // Presents the minimum, maximum, average, 90th and 99th percentile counter values for each computer
| where percentile_CounterValue_90 > 80 and percentile_CounterValue_99 > 80 // Filters previous query results for instances where the 90th and 99th percentile counters are higher than 80
次のクエリ結果セットは、上位 10% と 15% の
% Processor Time値が 80 を超えるすべてのコンピューターで構成されます。


課題: Heartbeat テーブルからクエリ結果にオペレーティング システム情報を追加する
多くの場合、join 演算子を使用して別のテーブルの情報をクエリ結果に関連付けることで、クエリ結果について理解を深めることができます。 詳細については、「join 演算子」を参照してください。
最初の演習で説明したように、join オペレーターを使用して、各コンピューターで実行されているオペレーティング システムに関する情報 (Heartbeat テーブルで使用できる情報) を追加できますか?
解決方法:
各コンピューターで実行されているオペレーティング システムに関する情報を
Heartbeatテーブルからクエリ結果に追加します。ここをクリックして Log Analytics のデモ環境でクエリを実行する
Perf  // The table you’re querying
| where TimeGenerated > ago(1d) and ObjectName == "Processor" and CounterName == "% Processor Time" and InstanceName == "_Total" // Filters for entries generated in the past day related to total processor time measurements
| summarize min(CounterValue), avg(CounterValue), max(CounterValue), percentiles(CounterValue, 90,99) by Computer // Presents the minimum, maximum, average, 90th and 99th percentile counter values for each computer
| where percentile_CounterValue_90 > 80 and percentile_CounterValue_99 > 80 // Filters previous query results for instances where the 90th and 99th percentile counters are higher than 50
| join kind=inner (Heartbeat // Introduces data from the "Heartbeat" table to the previous query results
| where TimeGenerated > ago(1d) // Time range for the data added from the "Heartbeat" table
| distinct Computer, OSType) on Computer // Adds distinct combinations of computer and operating system
このクエリを反復することにより、
ComputerおよびOSType列がHeartbeatテーブルから前述のクエリ結果に追加されます。
Computer列に、クエリ結果が 2 回 (Perfテーブルに対するクエリから 1 回、Heartbeatテーブルに対するクエリから 1 回) 表示されるようになりました。HeartbeatテーブルのComputer列は、Computer1という名前に変更されますが、2 つのテーブルに含まれるデータは同じです。 両方の列を有効にすると、2 つのテーブルの結果を関連付けることができますが、重複する列をフィルター処理できるようになりました。クエリ結果から
Computer1列を削除します。ここをクリックして Log Analytics のデモ環境でクエリを実行する
Perf  // The table you’re querying
| where TimeGenerated > ago(1d) and ObjectName == "Processor" and CounterName == "% Processor Time" and InstanceName == "_Total" // Filters for entries generated in the past day related to total processor time measurements
| summarize min(CounterValue), avg(CounterValue), max(CounterValue), percentiles(CounterValue, 90,99) by Computer // Presents the minimum, maximum, average, 90th and 99th percentile counter values for each computer
| where percentile_CounterValue_90 > 80 and percentile_CounterValue_99 > 80 // Filters previous query results for instances where the 90th and 99th percentile counters are higher than 50
| join kind=inner (Heartbeat // Introduces data from the "Heartbeat" table to the previous query results
| where TimeGenerated > ago(1d) // Time range for the data added from the "Heartbeat" table
| distinct Computer, OSType) on Computer // Adds distinct combinations of computer and operating system
| project-away Computer1 // Removes the "Computer1" column from the query results
次のクエリ結果セットは、全 CPU 容量に達したすべてのコンピューターと各コンピューターで実行されているオペレーティング システムを一覧表示します。これは、さらに分析するために役立ちます。