Note
ამ გვერდზე წვდომა ავტორიზაციას მოითხოვს. შეგიძლიათ სცადოთ შესვლა ან დირექტორიების შეცვლა.
ამ გვერდზე წვდომა ავტორიზაციას მოითხოვს. შეგიძლიათ სცადოთ დირექტორიების შეცვლა.
You have several options for diagnosing issues with Durable Functions. Some of these options are the same for regular functions and some are unique to Durable Functions. This article describes the diagnostic tools and techniques available for troubleshooting orchestrations.
Application Insights
Application Insights is the recommended way to do diagnostics and monitoring in Azure Functions. The same applies to Durable Functions. The Azure Functions Durable Extension emits tracking events that let you trace the end-to-end execution of an orchestration. You can find and query these tracking events using the Application Insights Analytics tool in the Azure portal.
Tracking data
Every orchestration instance generates tracking events as it progresses through its lifecycle. Each lifecycle event contains a customDimensions payload with several fields. Field names are all prepended with prop__.
| Field name | Description |
|---|---|
hubName |
The name of the task hub in which your orchestrations are running. |
appName |
The name of the function app. This field is useful when you have multiple function apps sharing the same Application Insights instance. |
slotName |
The deployment slot in which the current function app is running. This field is useful when you use deployment slots to version your orchestrations. |
functionName |
The name of the orchestrator or activity function. |
functionType |
The type of the function, such as Orchestrator or Activity. |
instanceId |
The unique ID of the orchestration instance. |
state |
The lifecycle execution state of the instance. |
state.Scheduled |
The function was scheduled for execution but hasn't started running yet. |
state.Started |
The function started running but hasn't yet awaited or completed. |
state.Awaited |
The orchestrator scheduled some work and is waiting for it to complete. |
state.Listening |
The orchestrator is listening for an external event notification. |
state.Completed |
The function completed successfully. |
state.Failed |
The function failed with an error. |
reason |
Additional data associated with the tracking event. For example, if an instance is waiting for an external event notification, this field indicates the name of the event it's waiting for. If a function fails, this field contains the error details. |
isReplay |
Boolean value indicating whether the tracking event is for replayed execution. |
extensionVersion |
The version of the Durable Task extension. The version information is especially important data when reporting possible bugs in the extension. Long-running instances may report multiple versions if an update occurs while the instance is running. |
sequenceNumber |
Execution sequence number for an event. Combined with the timestamp, this helps order the events by execution time. Note that this number resets to zero if the host restarts while the instance is running, so it's important to always sort by timestamp first, then sequenceNumber. |
You can configure the verbosity of tracking data emitted to Application Insights using your platform's logging configuration.
{
    "logging": {
        "logLevel": {
            "Host.Triggers.DurableTask": "Information",
        },
    }
}
By default, all non-replay tracking events are emitted. You can reduce the volume of data by setting Host.Triggers.DurableTask to "Warning" or "Error", which means tracking events are only emitted for exceptional situations. To enable emitting the verbose orchestration replay events, set the logReplayEvents to true in the host.json configuration file.
Note
By default, the Azure Functions runtime samples Application Insights telemetry to avoid emitting data too frequently. Sampling can cause tracking information to be lost when many lifecycle events occur in a short period of time. The Azure Functions Monitoring article explains how to configure this behavior.
By default, orchestrator, activity, and entity function inputs and outputs aren't logged. This approach is recommended because logging inputs and outputs could increase Application Insights costs. Function input and output payloads may also contain sensitive information. Instead, the number of bytes for function inputs and outputs are logged. If you want the Durable Functions extension to log the full input and output payloads, set the traceInputsAndOutputs property to true in the host.json configuration file.
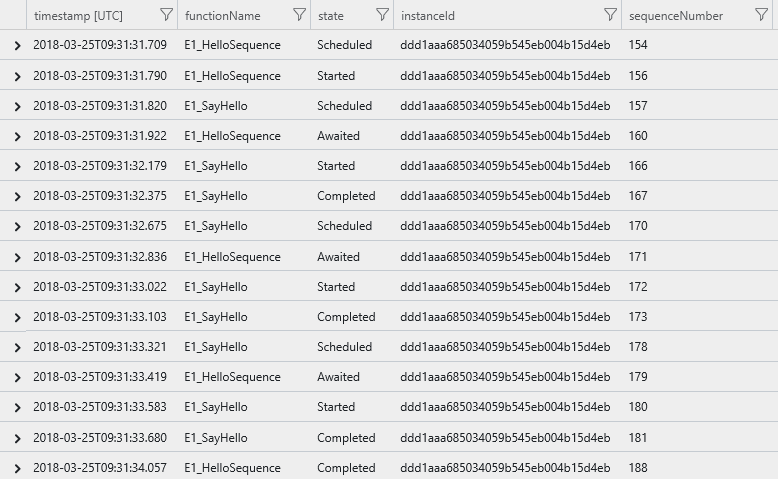
Single instance query
The following query shows historical tracking data for a single instance of the Hello Sequence function orchestration. It's written using the Kusto Query Language. It filters out replay execution so that only the logical execution path is shown. You can order events by sorting by timestamp and sequenceNumber as shown in the following query:
let targetInstanceId = "ddd1aaa685034059b545eb004b15d4eb";
let start = datetime(2018-03-25T09:20:00);
traces
| where timestamp > start and timestamp < start + 30m
| where customDimensions.Category == "Host.Triggers.DurableTask"
| extend functionName = customDimensions["prop__functionName"]
| extend instanceId = customDimensions["prop__instanceId"]
| extend state = customDimensions["prop__state"]
| extend isReplay = tobool(tolower(customDimensions["prop__isReplay"]))
| extend sequenceNumber = tolong(customDimensions["prop__sequenceNumber"])
| where isReplay != true
| where instanceId == targetInstanceId
| sort by timestamp asc, sequenceNumber asc
| project timestamp, functionName, state, instanceId, sequenceNumber, appName = cloud_RoleName
The result is a list of tracking events that shows the execution path of the orchestration, including any activity functions ordered by the execution time in ascending order.
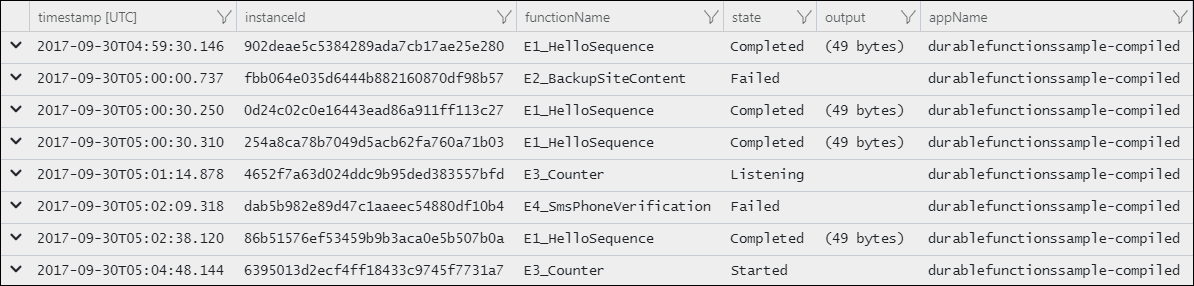
Instance summary query
The following query displays the status of all orchestration instances that were run in a specified time range.
let start = datetime(2017-09-30T04:30:00);
traces
| where timestamp > start and timestamp < start + 1h
| where customDimensions.Category == "Host.Triggers.DurableTask"
| extend functionName = tostring(customDimensions["prop__functionName"])
| extend instanceId = tostring(customDimensions["prop__instanceId"])
| extend state = tostring(customDimensions["prop__state"])
| extend isReplay = tobool(tolower(customDimensions["prop__isReplay"]))
| extend output = tostring(customDimensions["prop__output"])
| where isReplay != true
| summarize arg_max(timestamp, *) by instanceId
| project timestamp, instanceId, functionName, state, output, appName = cloud_RoleName
| order by timestamp asc
The result is a list of instance IDs and their current runtime status.
Durable Task Framework logging
The Durable extension logs are useful for understanding the behavior of your orchestration logic. However, these logs don't always contain enough information to debug framework-level performance and reliability issues. Starting in v2.3.0 of the Durable extension, logs emitted by the underlying Durable Task Framework (DTFx) are also available for collection.
When looking at logs emitted by the DTFx, it's important to understand that the DTFx engine has two components: the core dispatch engine (DurableTask.Core) and one of many supported storage providers.
| Component | Description |
|---|---|
DurableTask.Core |
Core orchestration execution and low-level scheduling logs and telemetry. |
DurableTask.DurableTaskScheduler |
Backend logs specific to the Durable Task Scheduler. |
DurableTask.AzureStorage |
Backend logs specific to the Azure Storage state provider. These logs include detailed interactions with the internal queues, blobs, and storage tables used to store and fetch internal orchestration state. |
DurableTask.Netherite |
Backend logs specific to the Netherite storage provider, if enabled. |
DurableTask.SqlServer |
Backend logs specific to the Microsoft SQL (MSSQL) storage provider, if enabled. |
You can enable these logs by updating the logging/logLevel section of your function app's host.json file. The following example shows how to enable warning and error logs from both DurableTask.Core and DurableTask.AzureStorage:
{
  "version": "2.0",
  "logging": {
    "logLevel": {
      "DurableTask.AzureStorage": "Warning",
      "DurableTask.Core": "Warning"
    }
  }
}
If you have Application Insights enabled, these logs are automatically added to the trace collection. You can search them the same way you search for other trace logs using Kusto queries.
Note
For production applications, we recommend enabling DurableTask.Core and the appropriate storage provider (for example, DurableTask.AzureStorage) logs using the "Warning" filter. Higher verbosity filters such as "Information" are useful for debugging performance issues. However, these log events can be high-volume and can significantly increase Application Insights data storage costs.
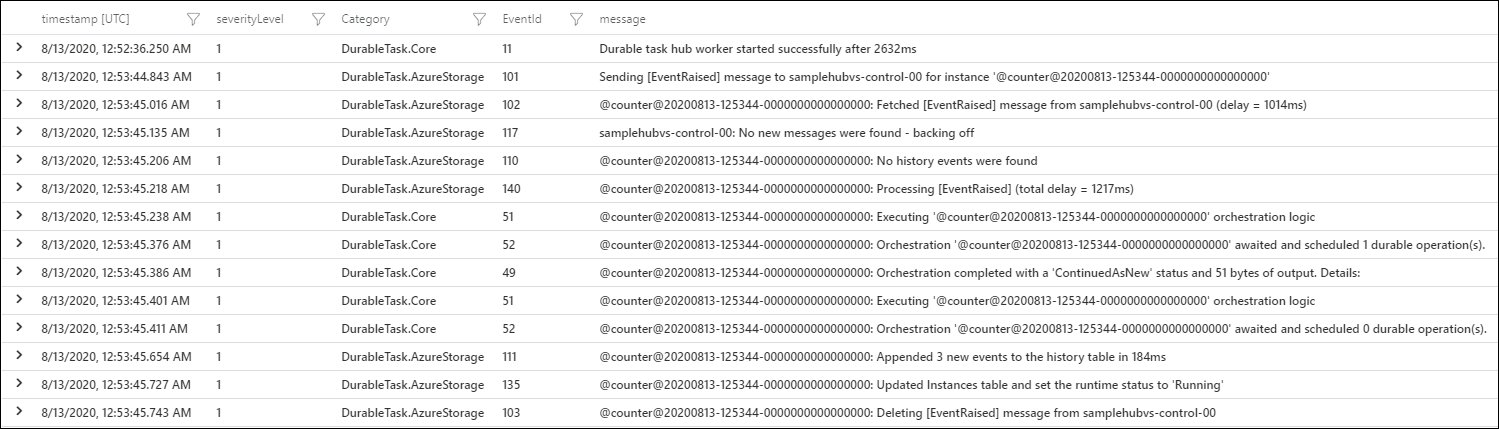
The following Kusto query shows how to query for DTFx logs. The most important part of the query is where customerDimensions.Category startswith "DurableTask" since it filters the results to logs in the DurableTask.Core and DurableTask.AzureStorage categories.
traces
| where customDimensions.Category startswith "DurableTask"
| project
    timestamp,
    severityLevel,
    Category = customDimensions.Category,
    EventId = customDimensions.EventId,
    message,
    customDimensions
| order by timestamp asc
The result is a set of logs written by the Durable Task Framework log providers.
For more information about what log events are available, see the Durable Task Framework structured logging documentation on GitHub.
App logging
Keep the orchestrator replay behavior in mind when writing logs directly from an orchestrator function. For example, consider the following orchestrator function:
[FunctionName("FunctionChain")]
public static async Task Run(
    [OrchestrationTrigger] IDurableOrchestrationContext context,
    ILogger log)
{
    log.LogInformation("Calling F1.");
    await context.CallActivityAsync("F1");
    log.LogInformation("Calling F2.");
    await context.CallActivityAsync("F2");
    log.LogInformation("Calling F3");
    await context.CallActivityAsync("F3");
    log.LogInformation("Done!");
}
The resulting log data looks something like the following example output:
Calling F1.
Calling F1.
Calling F2.
Calling F1.
Calling F2.
Calling F3.
Calling F1.
Calling F2.
Calling F3.
Done!
Note
Remember that while the logs claim to be calling F1, F2, and F3, the code only calls those functions the first time they're encountered. Subsequent calls that happen during replay are skipped and the outputs are replayed to the orchestrator logic.
If you want to only write logs on non-replay executions, you can write a conditional expression to log only if the "is replaying" flag is false. Consider the example above, but this time with replay checks.
[FunctionName("FunctionChain")]
public static async Task Run(
    [OrchestrationTrigger] IDurableOrchestrationContext context,
    ILogger log)
{
    if (!context.IsReplaying) log.LogInformation("Calling F1.");
    await context.CallActivityAsync("F1");
    if (!context.IsReplaying) log.LogInformation("Calling F2.");
    await context.CallActivityAsync("F2");
    if (!context.IsReplaying) log.LogInformation("Calling F3");
    await context.CallActivityAsync("F3");
    log.LogInformation("Done!");
}
Starting in Durable Functions 2.0, .NET orchestrator functions can create an ILogger that automatically filters out log statements during replay. Use the IDurableOrchestrationContext.CreateReplaySafeLogger(ILogger) API to create this logger.
[FunctionName("FunctionChain")]
public static async Task Run(
    [OrchestrationTrigger] IDurableOrchestrationContext context,
    ILogger log)
{
    log = context.CreateReplaySafeLogger(log);
    log.LogInformation("Calling F1.");
    await context.CallActivityAsync("F1");
    log.LogInformation("Calling F2.");
    await context.CallActivityAsync("F2");
    log.LogInformation("Calling F3");
    await context.CallActivityAsync("F3");
    log.LogInformation("Done!");
}
Note
The previous C# examples are for Durable Functions 2.x. For Durable Functions 1.x, you must use DurableOrchestrationContext instead of IDurableOrchestrationContext. For more information about the differences between versions, see the Durable Functions versions article.
With these changes, the log output is as follows:
Calling F1.
Calling F2.
Calling F3.
Done!
Custom status
Custom orchestration status lets you set a custom status value for your orchestrator function. External clients can view the custom status via the HTTP status query API or language-specific API calls. Custom orchestration status enables richer monitoring for orchestrator functions. For example, the orchestrator function code can invoke the "set custom status" API to update the progress for a long-running operation. A client, such as a web page or external system, can then periodically query the HTTP status query APIs for progress information. The following code shows how to set a custom status value in an orchestrator function:
[FunctionName("SetStatusTest")]
public static async Task SetStatusTest([OrchestrationTrigger] IDurableOrchestrationContext context)
{
    // ...do work...

    // update the status of the orchestration with some arbitrary data
    var customStatus = new { completionPercentage = 90.0, status = "Updating database records" };
    context.SetCustomStatus(customStatus);

    // ...do more work...
}
Note
The previous C# example is for Durable Functions 2.x. For Durable Functions 1.x, you must use DurableOrchestrationContext instead of IDurableOrchestrationContext. For more information about the differences between versions, see the Durable Functions versions article.
While the orchestration is running, external clients can fetch this custom status:
GET /runtime/webhooks/durabletask/instances/instance123?code=XYZ
Clients get the following response:
{
  "runtimeStatus": "Running",
  "input": null,
  "customStatus": { "completionPercentage": 90.0, "status": "Updating database records" },
  "output": null,
  "createdTime": "2017-10-06T18:30:24Z",
  "lastUpdatedTime": "2017-10-06T19:40:30Z"
}
Warning
The custom status payload is limited to 16 KB of UTF-16 JSON text because it needs to fit in an Azure Table Storage column. You can use external storage if you need a larger payload.
Distributed tracing
Distributed tracing tracks requests and shows how different services interact with each other. In Durable Functions, it correlates orchestrations, entities, and activities together. Distributed tracing shows execution time for each orchestration step relative to the entire orchestration and identifies where issues or exceptions occur. This feature is supported in Application Insights for all languages and storage providers.
Note
- For .NET Isolated apps, Distributed Tracing V2 requires Microsoft.Azure.Functions.Worker.Extensions.DurableTask >= v1.4.0.
- For non-.NET apps, follow these instructions to manually install Microsoft.Azure.WebJobs.Extensions.DurableTask >= v3.2.0 for now. Distributed tracing will be available in extension bundles > v4.24.x.
Setting up distributed tracing
To configure distributed tracing, update the host.json and set up an Application Insights resource.
host.json
{
   "extensions": {
     "durableTask": {
       "tracing": {
         "distributedTracingEnabled": true,
         "version": "V2"
       }
     }
   }
 }
Application Insights
Configure your function app with an Application Insights resource.
Inspecting the traces
Once you have distributed tracing set up, you can visualize your orchestration flows. In your Application Insights resource, navigate to Transaction Search. In the results, look for Request and Dependency events that start with Durable-specific prefixes (for example, orchestration:, activity:, etc.). Selecting one of these events opens up a Gantt chart that shows the end-to-end distributed trace.

Note
Not seeing your traces in Application Insights? Wait about five minutes after running your application to ensure that all of the data propagates to the Application Insights resource.
Debugging
Azure Functions supports debugging function code directly, and that same support carries forward to Durable Functions, whether running in Azure or locally. However, there are a few behaviors to know about when debugging:
Replay: Orchestrator functions regularly replay when new inputs are received. A single logical execution of an orchestrator function can result in hitting the same breakpoint multiple times, especially if it's set early in the function code.
Await: Whenever an
awaitis encountered in an orchestrator function, it yields control back to the Durable Task Framework dispatcher. If it's the first time a particularawaitis encountered, the associated task is never resumed. Because the task never resumes, stepping over the await (F10 in Visual Studio) isn't possible. Stepping over only works when a task is being replayed.Messaging timeouts: Durable Functions internally uses queue messages to drive execution of orchestrator, activity, and entity functions. In a multi-VM environment, extended debugging sessions could cause another VM to process the message, resulting in duplicate execution. Although this behavior also exists for regular queue-trigger functions, this context is important to highlight because the queues are an implementation detail.
Stopping and starting: Messages in Durable Functions persist between debug sessions. If you stop debugging and terminate the local host process while a durable function is executing, that function might re-execute automatically in a future debug session. To avoid unexpected re-execution, use a fresh task hub or clear the task hub contents between debug sessions.
Tip
When setting breakpoints in orchestrator functions, if you want to only break on non-replay execution, you can set a conditional breakpoint that breaks only if the "is replaying" value is false.
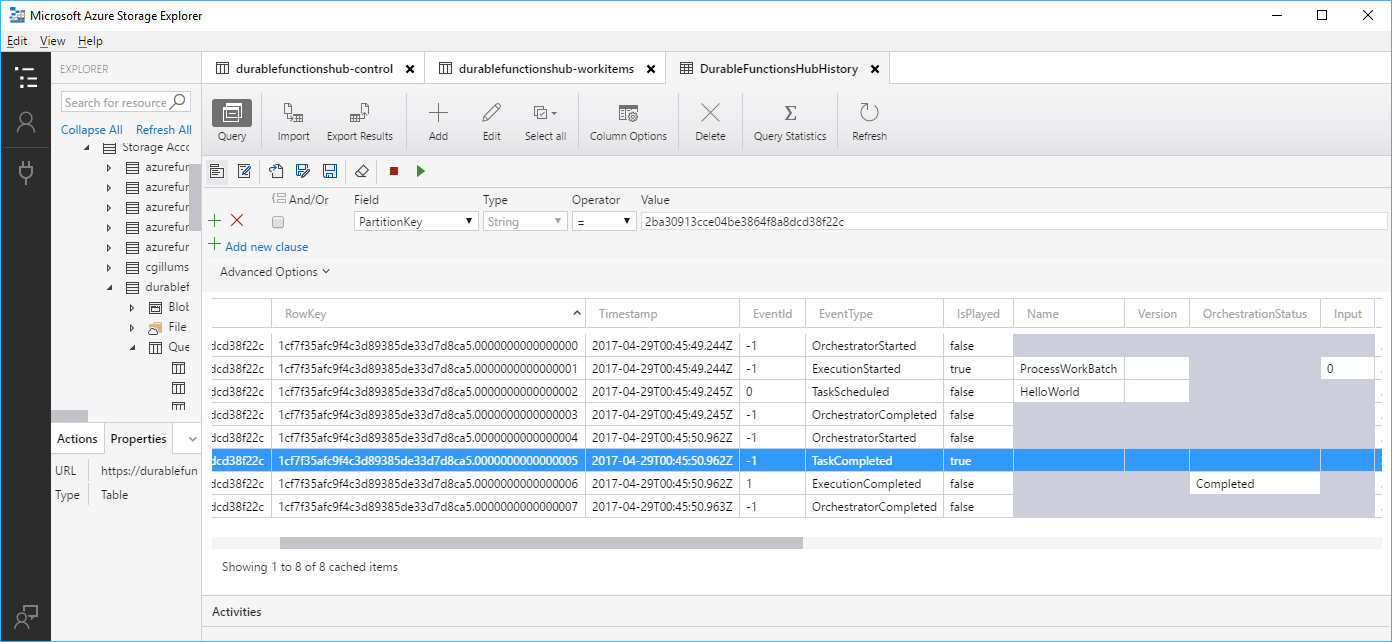
Storage
By default, Durable Functions stores state in Azure Storage. You can inspect orchestration state and messages in the queues using tools such as Microsoft Azure Storage Explorer.
Warning
While it's convenient to see execution history in table storage, avoid taking any dependency on this table. It might change as the Durable Functions extension evolves.
Note
You can configure other storage providers instead of the default Azure Storage provider. Depending on the storage provider configured for your app, you might need to use different tools to inspect the underlying state.
Durable Functions Monitor
Durable Functions Monitor is a graphical tool for monitoring, managing, and debugging orchestration and entity instances. It's available as a Visual Studio Code extension or a standalone app. For setup instructions and a list of features, see the Durable Functions Monitor Wiki.
Azure portal diagnostics
The Azure portal provides built-in diagnostic tools for your function apps.
Diagnose and solve problems
Azure Function App Diagnostics is a useful resource for monitoring and diagnosing potential issues in your application. It also provides suggestions to help resolve problems based on the diagnosis. For more information, see Azure Function App Diagnostics.
Orchestration traces
The Azure portal provides orchestration trace details to help you understand the status of each orchestration instance and trace end-to-end execution. When you view the list of functions inside your Azure Functions app, you see a Monitor column that contains links to the traces. You need to have Application Insights enabled for your app to access this information.
Roslyn Analyzer
The Durable Functions Roslyn Analyzer is a live code analyzer that guides C# developers to follow Durable Functions specific code constraints. For instructions on how to enable it in Visual Studio and Visual Studio Code, see Durable Functions Roslyn Analyzer.
Troubleshooting
To troubleshoot common problems such as orchestrations being stuck, failing to start, or running slowly, see the Durable Functions troubleshooting guide.