Ескертпе
Бұл бетке кіру үшін қатынас шегін айқындау қажет. Жүйеге кіруді немесе каталогтарды өзгертуді байқап көруге болады.
Бұл бетке кіру үшін қатынас шегін айқындау қажет. Каталогтарды өзгертуді байқап көруге болады.
The process of writing, registering, and debugging a plug-in is:
- Create a .NET Framework Class library project in Visual Studio
- Add the
Microsoft.CrmSdk.CoreAssembliesNuGet package to the project - Implement the IPlugin interface on classes that you register as steps.
- Add your code to the Execute method required by the interface
- Get references to services you need
- Add your business logic
- Sign and build the assembly
- Test the assembly
- Register the assembly in a test environment
- Add your registered assembly and steps to an unmanaged solution
- Test the behavior of the assembly
- Verify expected trace logs are written
- Debug the assembly as needed
Content in this article covers the previous steps in bold and supports the following tutorials:
Test your assembly
The simplest way to test your assembly might be to manually perform the operation by using the web app. But you can also initiate events that cause plug-ins to execute in multiple ways, such as creating a table from a workflow or using the web services.
Execution context information might be different depending on how you perform the action. When you write your plug-in, ensure you follow defensive programming practices and don't assume that every value you expect is always present.
You might want to write a program that automates performing the operations that cause your plug-in to fire and includes many possible variations.
If you want to use a test automation framework, you'll find that the community created some tools for automated testing. For more information, see Testing tools for server-side development.
Use tracing
As described in Tracing service, you can write messages to the PluginTraceLog Table within the code of your plug-in by using the ITracingService.Trace method.
Before you can use this service, you must enable tracing in your Microsoft Dataverse environment. The process is described in View trace logs.
Note
Trace logging takes up organization storage space, especially when it generates many traces and exceptions. Only turn on trace logging for debugging and troubleshooting, and turn it off when you're done.
While debugging, you can easily query the trace logs for a given plug-in class by using the Web API in your browser. If your assembly is named BasicPlugin.FollowUpPlugin, you can use this query in your browser address field:
GET <your org uri>/api/data/v9.0/plugintracelogs?$select=messageblock&$filter=startswith(typename,'BasicPlugin.FollowUpPlugin')
The JSON results are returned to your browser like so:
{
    "@odata.context": "<your org uri>/api/data/v9.0/$metadata#plugintracelogs(messageblock)",
    "value": [{
        "messageblock": "FollowupPlugin: Creating the task activity.",
        "plugintracelogid": "f0c221d1-7f84-4f89-acdb-bbf8f7ce9f6c"
    }]
}
Tip
This works best if you install a browser extension that formats the returned JSON. Or you might want to use an API client like Postman or Insomnia, or you might want to use VS Code with PowerShell.
You might prefer to use the XrmToolbox Plugin Trace Viewer. This community tool isn't supported by Microsoft. If you have questions about this tool, contact the publisher.
You can also find tracing messages in the log file that you can download when a synchronous plug-in or custom workflow assembly throws an error that results in an error dialog that is displayed to the user. The user can select the Download Log File button to view the log containing details of the exception and the trace output.
For asynchronously registered plug-ins and workflow assemblies that return an exception, the tracing information is shown in the details area of the System Job form in the web application.
Note
If your custom code executes within a database transaction, and an exception occurs that causes a transaction rollback, all table data changes by your code are undone. However, the PluginTraceLog table records remain after the rollback completes.
Use plug-in profiler
Plug-in profiler is a solution that you can install on your environment that enables you to capture the execution context of a plug-in. Use that data to replay the event within Visual Studio while debugging.
For instructions to install and use plug-in profiler, see Tutorial: Debug a plug-in. See Install plug-in profiler and Debug your plug-in.
View plug-in profile data
After you install the plug-in profiler and capture some profiles, you can view the event context and replay data that is used when you debug. Viewing this data can help you understand the execution context data that your plug-in can use.
Use the Plug-in Registration tool to view this data. Select the View Plug-in Profile command. This command opens the Plugin Profile dialog.
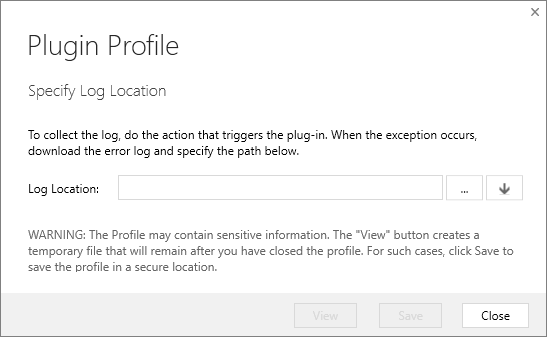
Select the  icon. In the Select Profile from CRM dialog, specify the log item to use.
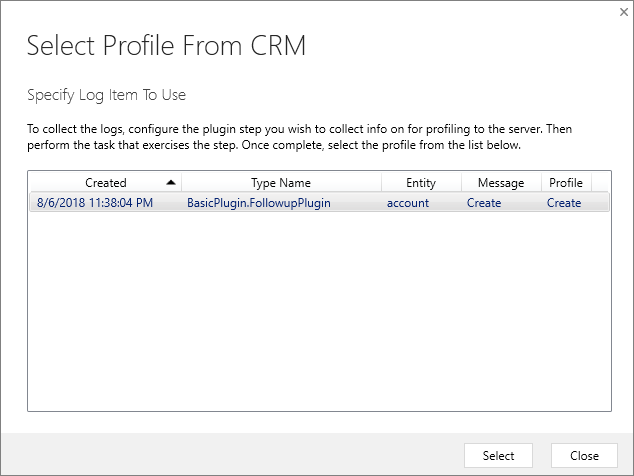
Select View in the Plugin Profile dialog.
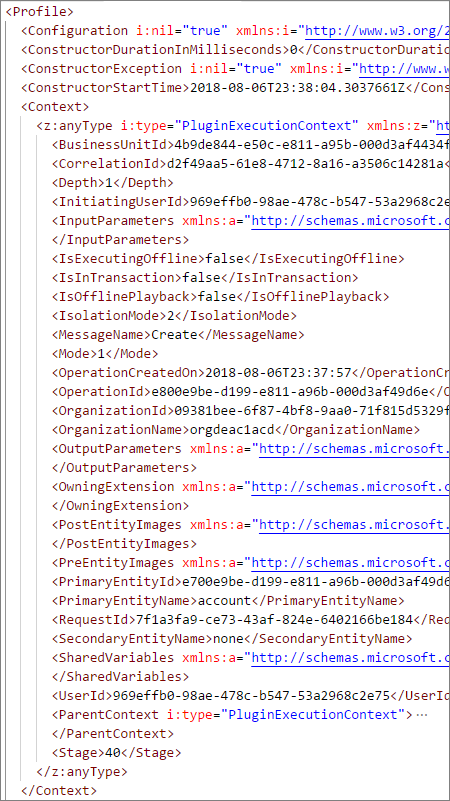
This action downloads and opens an XML file with the profile information. The Context element represents the execution context passed to the plug-in.