통합 문서 시각화
통합 문서는 Azure Monitor 데이터 시각화를 위한 풍부한 기능 세트를 제공합니다. 정확한 기능 세트는 데이터 원본 및 결과 집합에 따라 달라지지만 작성자는 시간이 지남에 따라 수렴할 것으로 예상할 수 있습니다. 이러한 컨트롤을 사용하면 분석을 풍부한 대화형 보고서로 표시할 수 있습니다.
통합 문서는 다음과 같은 종류의 시각적 구성 요소를 지원합니다.
참고 항목
각 시각화 및 데이터 원본에는 고유한 제한이 있을 수 있습니다.
예제
텍스트 매개 변수
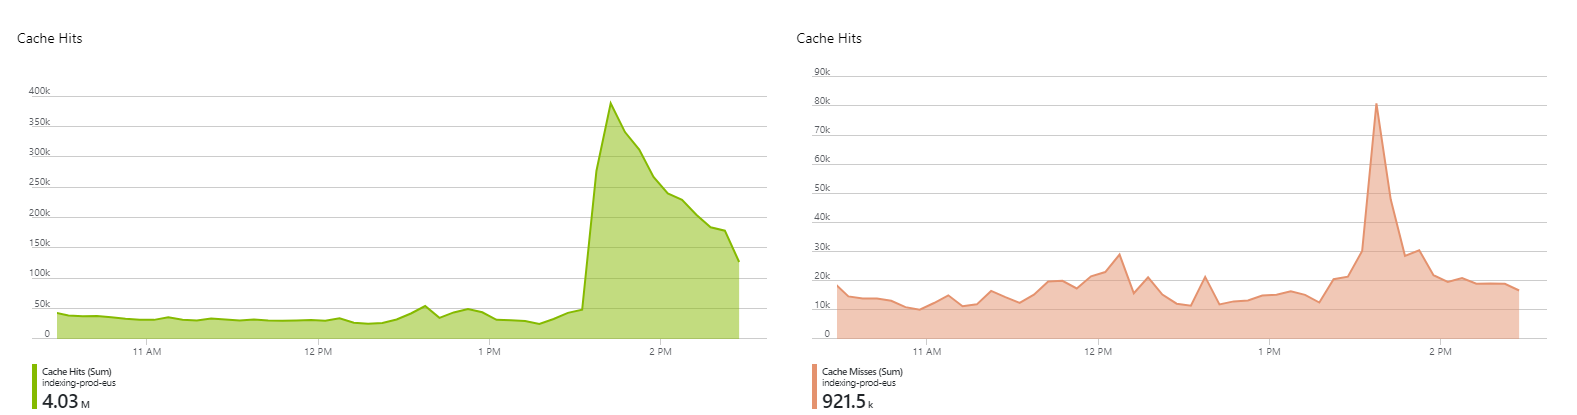
차트
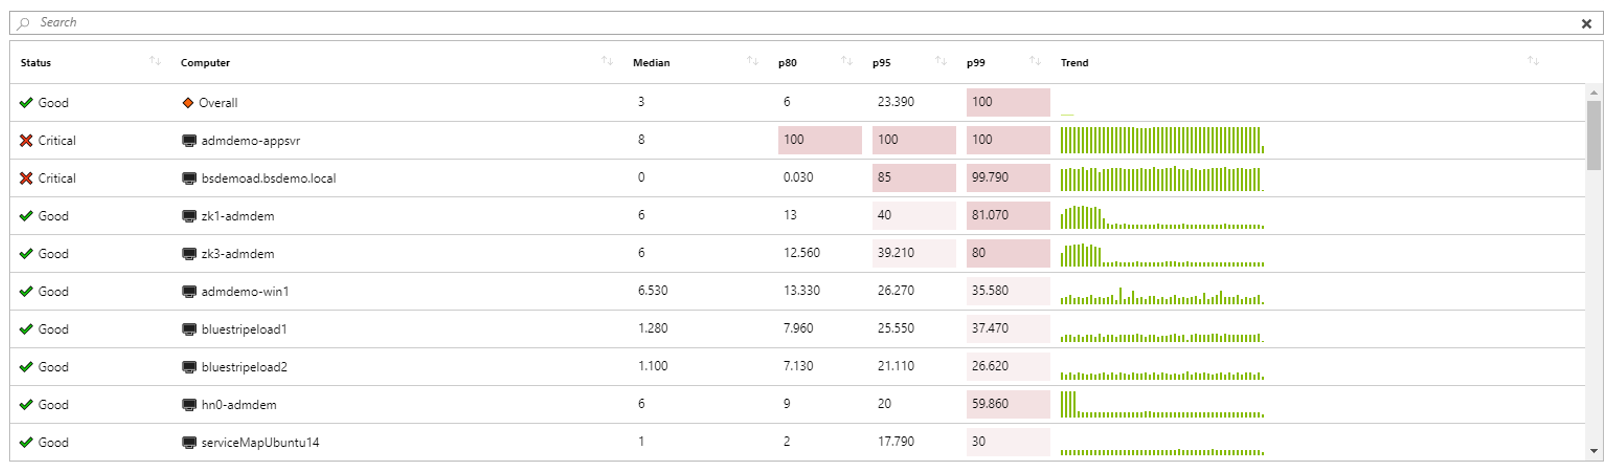
그리드
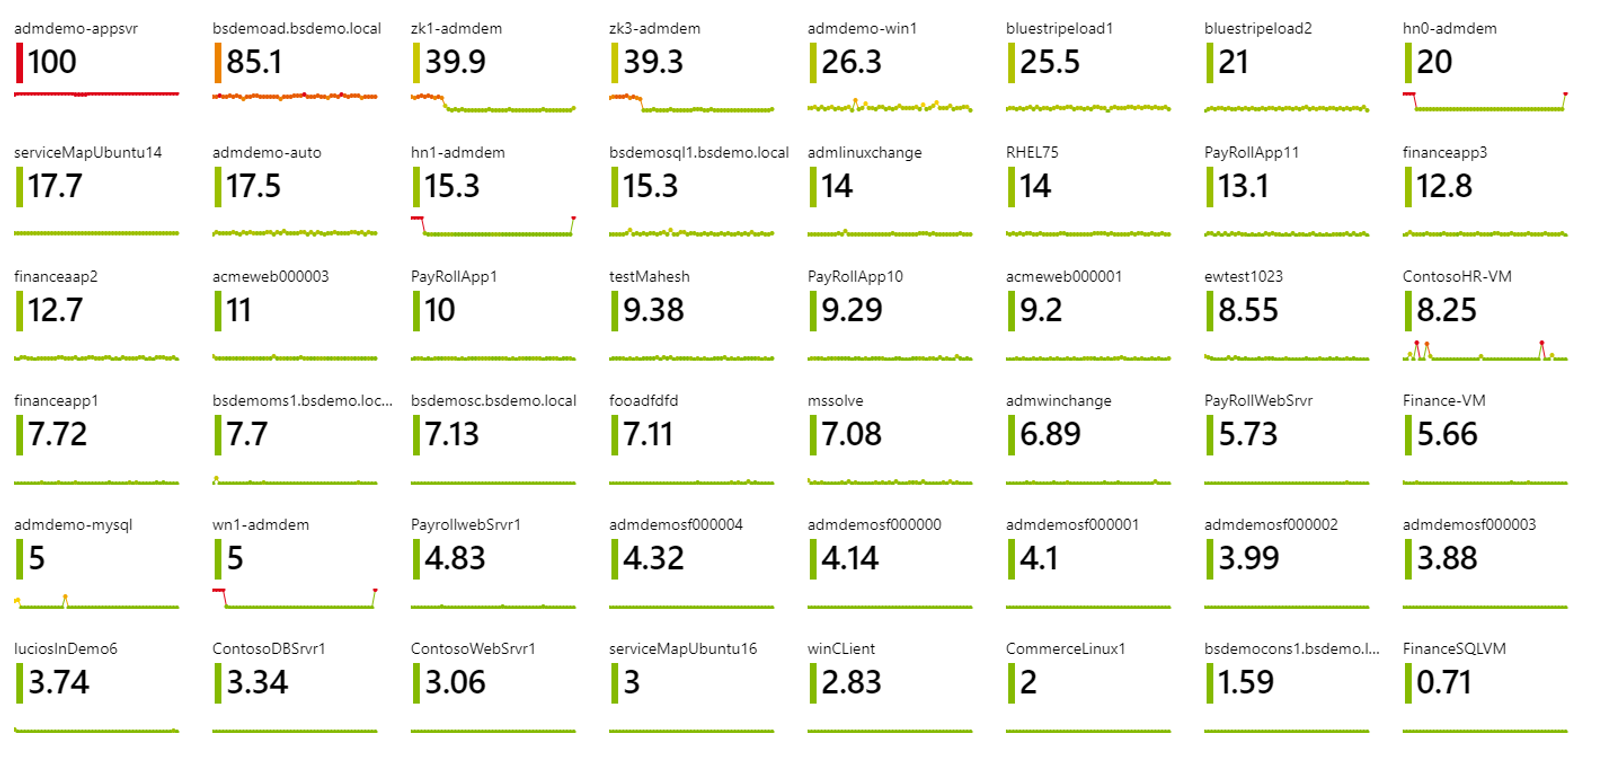
타일
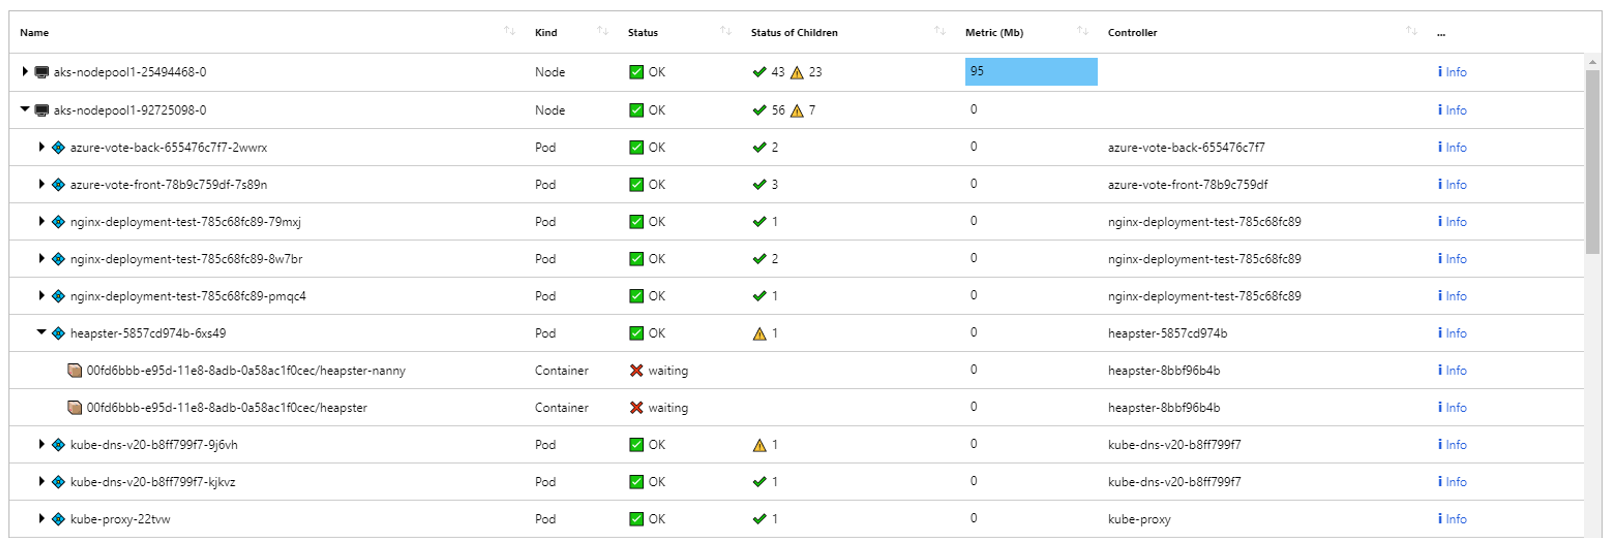
트리
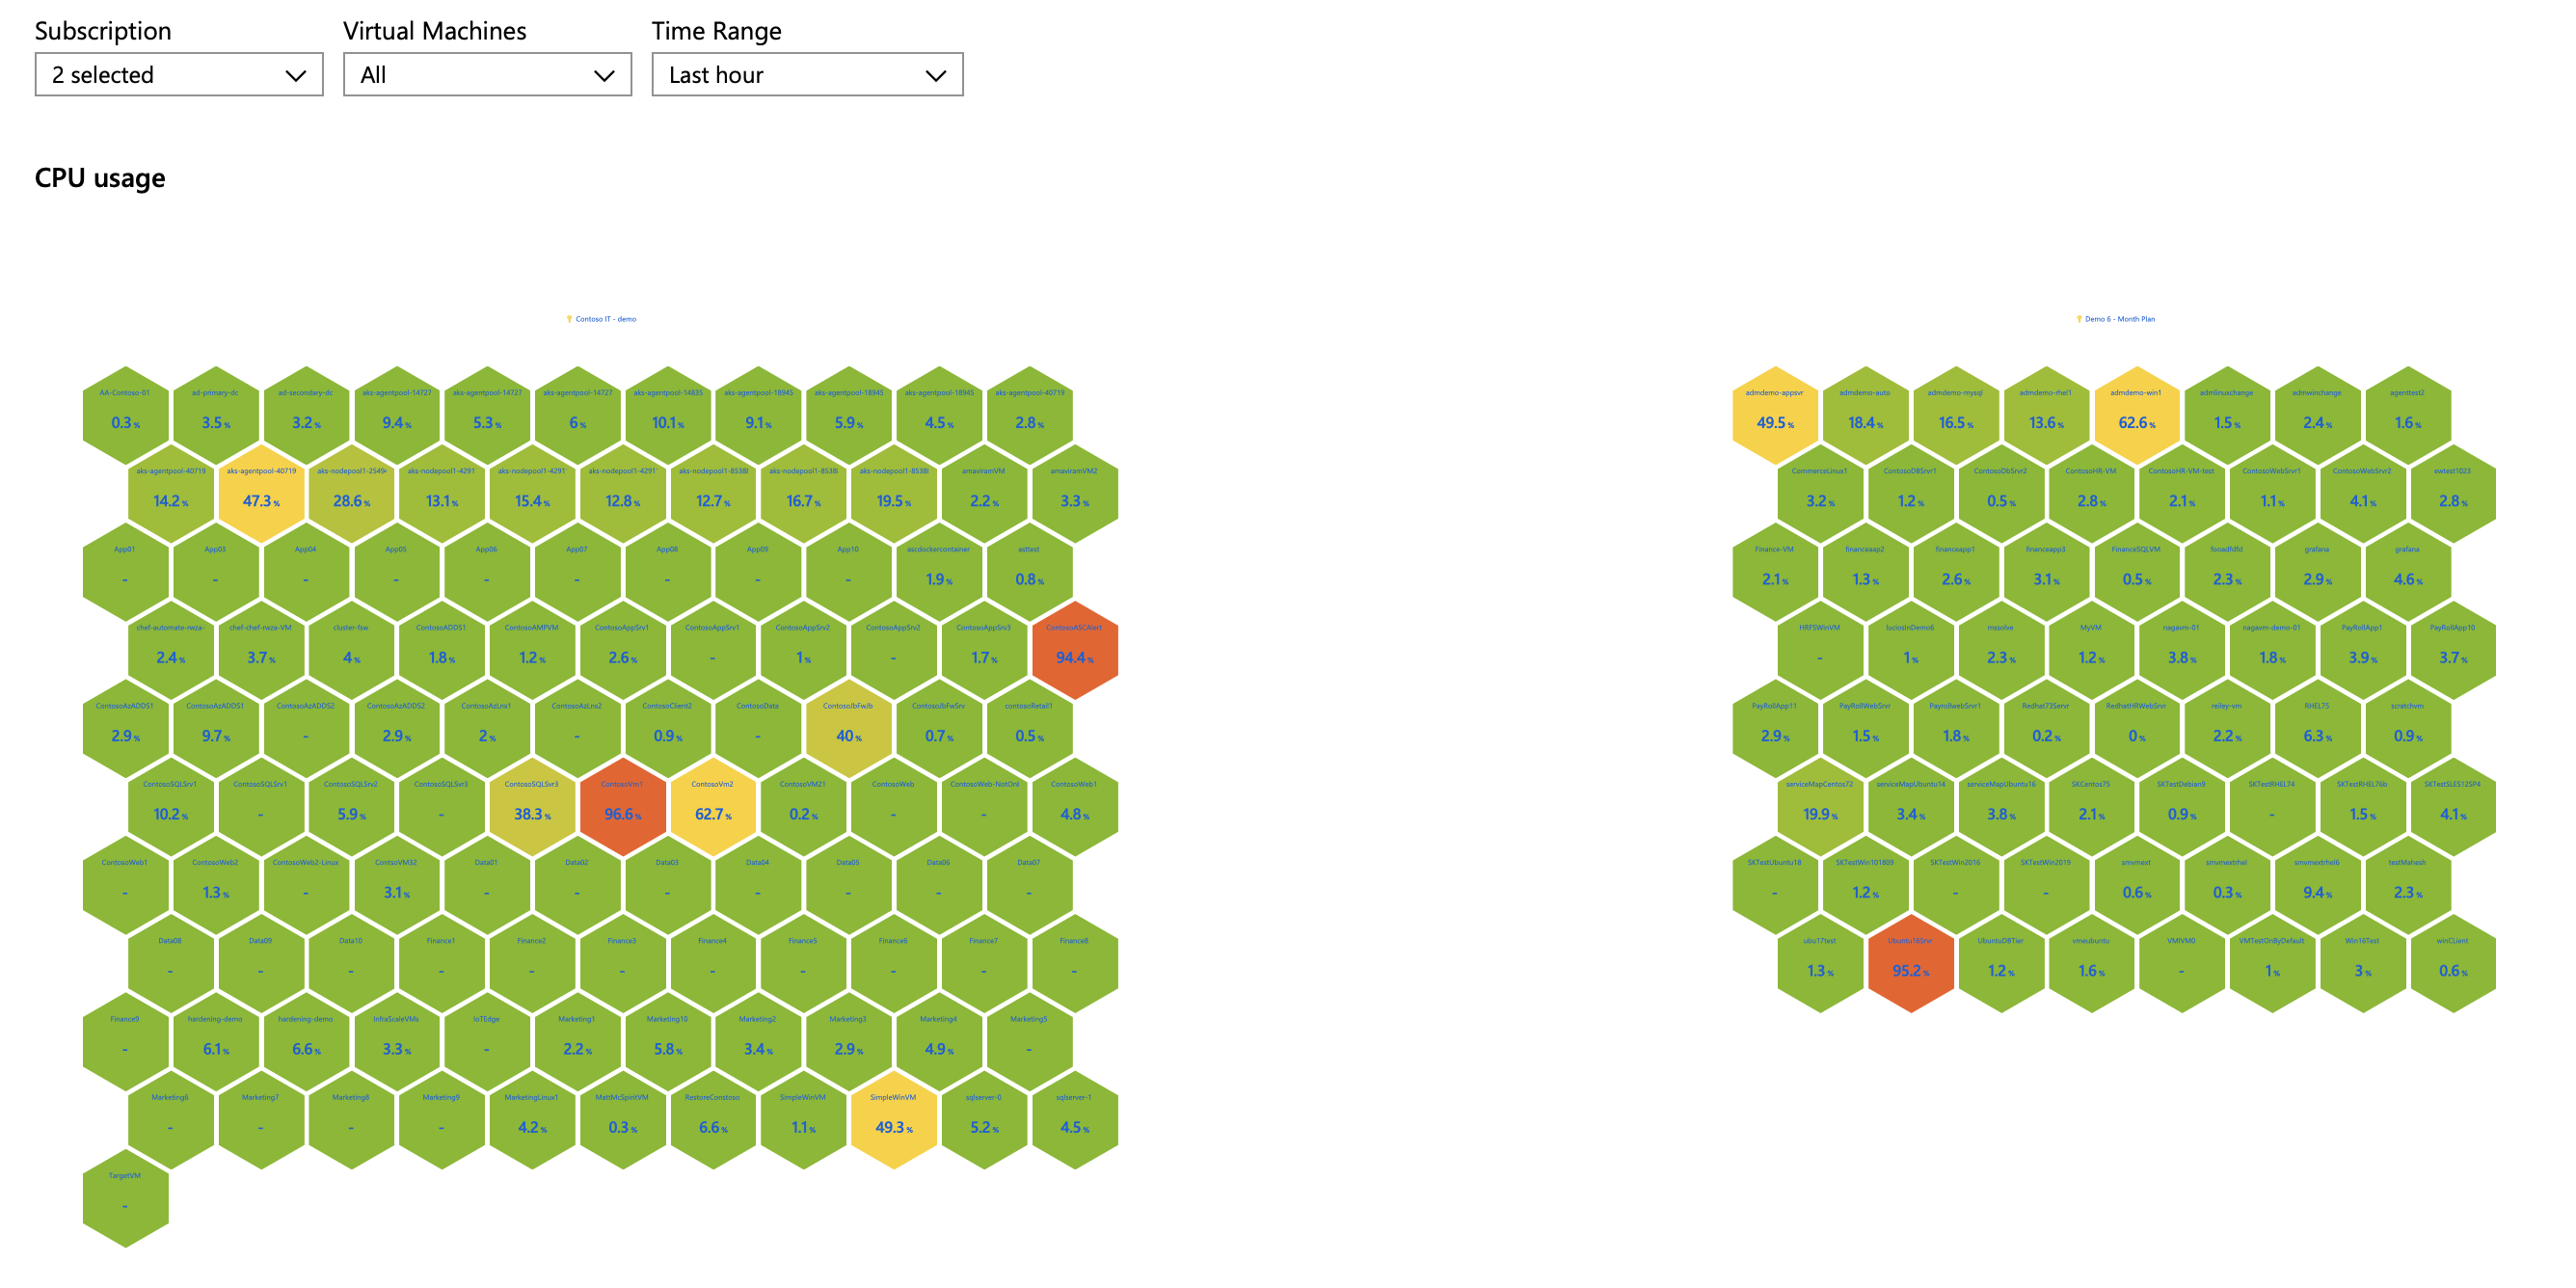
Honeycomb
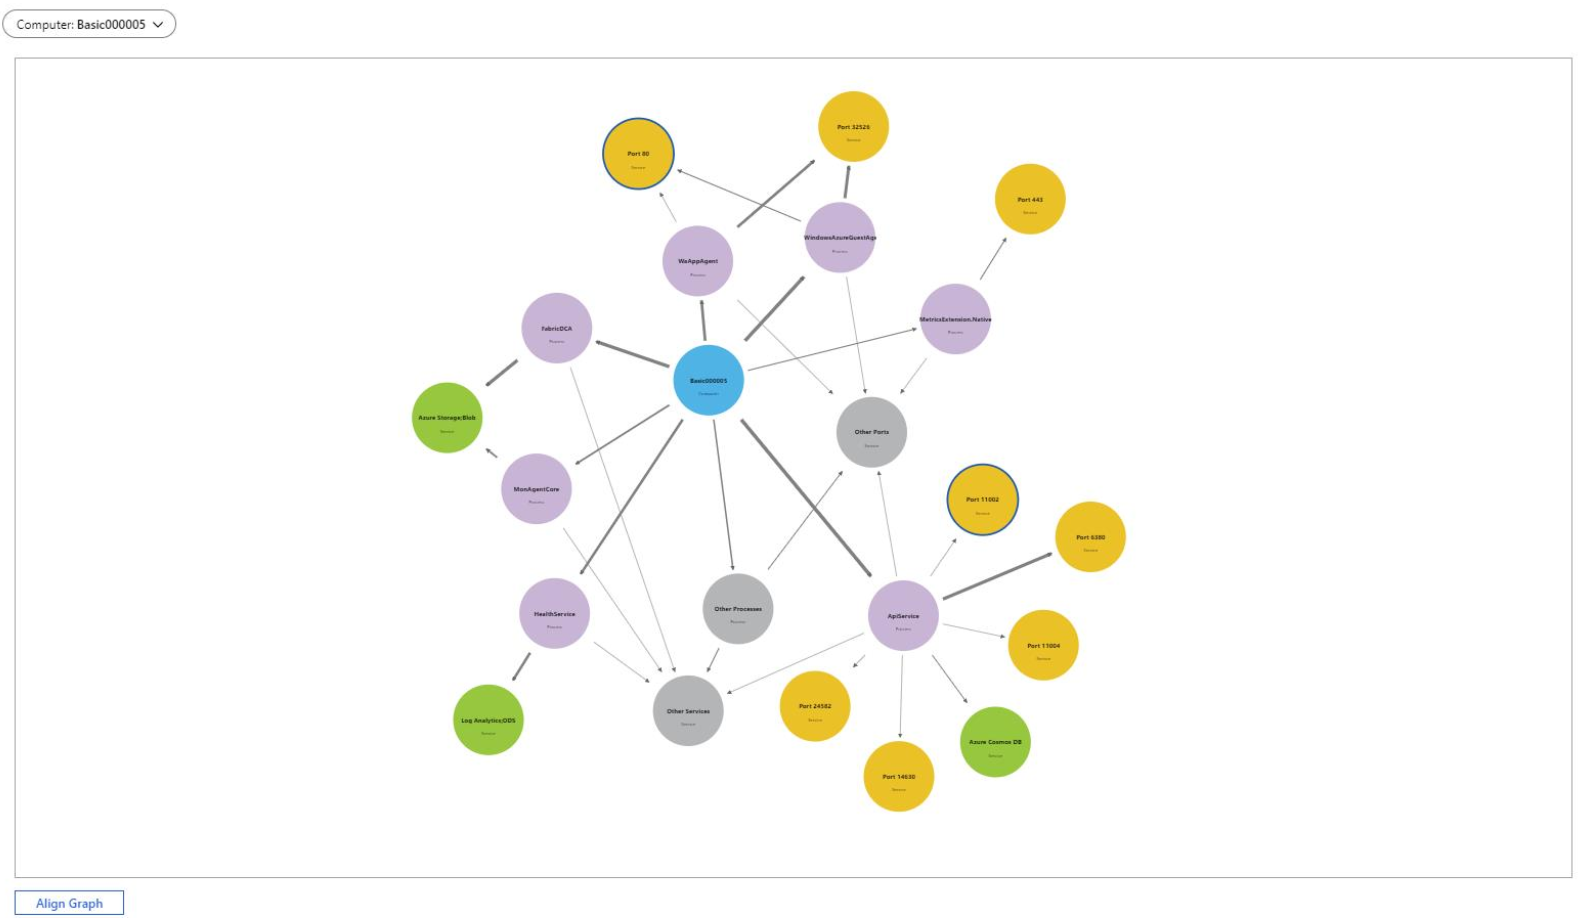
그래프
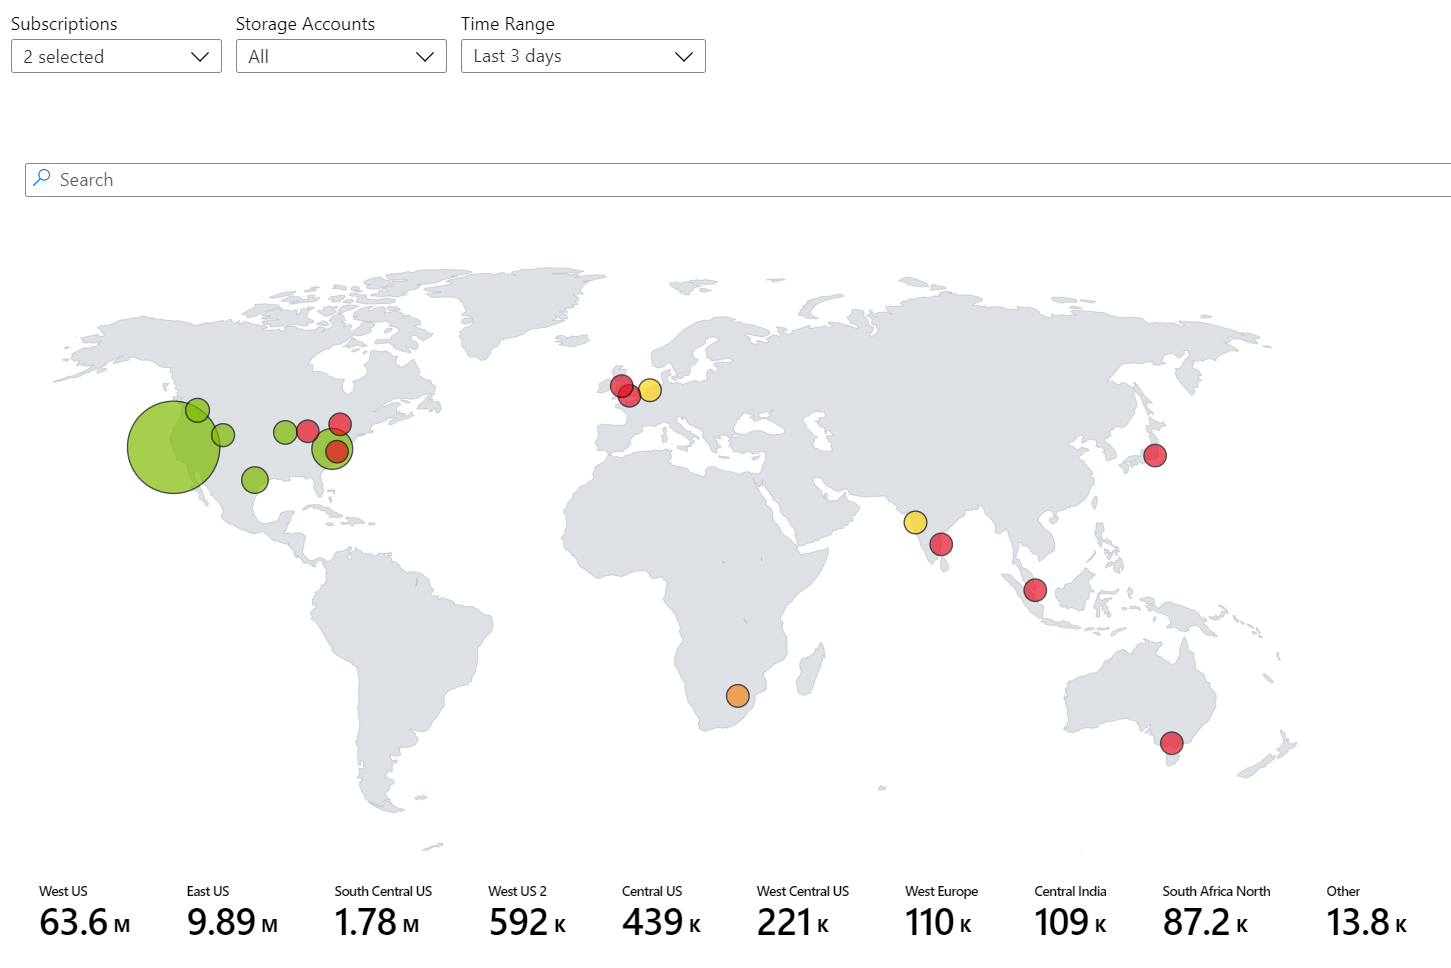
지도
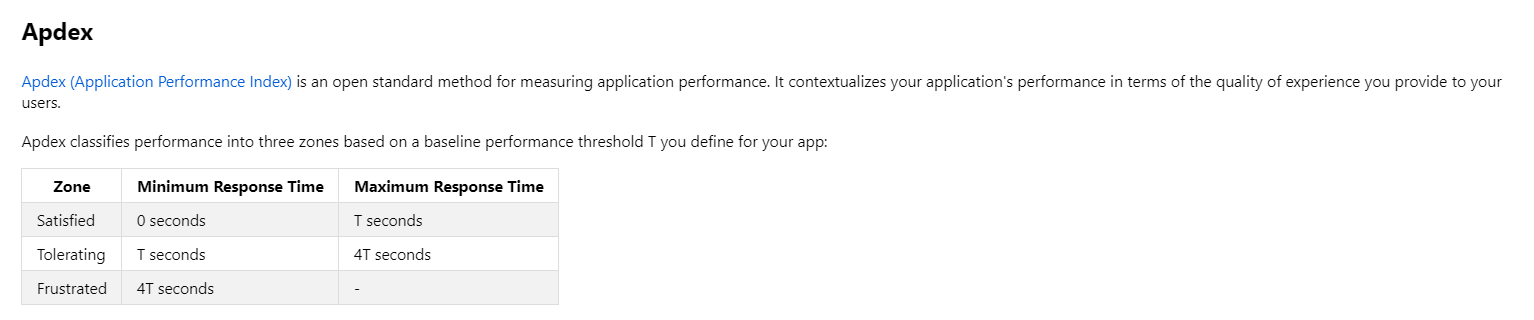
텍스트 시각화
다음 단계
피드백
출시 예정: 2024년 내내 콘텐츠에 대한 피드백 메커니즘으로 GitHub 문제를 단계적으로 폐지하고 이를 새로운 피드백 시스템으로 바꿀 예정입니다. 자세한 내용은 다음을 참조하세요. https://aka.ms/ContentUserFeedback
다음에 대한 사용자 의견 제출 및 보기