탄소 최적화를 통해 자세한 배출 데이터 및 인사이트를 제공하여 클라우드 탄소 발자국을 측정, 이해 및 줄일 수 있습니다. Azure Portal의 탄소 최적화 페이지를 사용하여 배출 추세를 분석하고 클라우드 지속 가능성 및 효율성을 개선하기 위한 조치를 취합니다.
배출 데이터 보기
- Azure Portal에 로그인합니다.
- 검색 상자에 탄소 최적화 를 입력하고 탄소 최적화를 선택합니다.
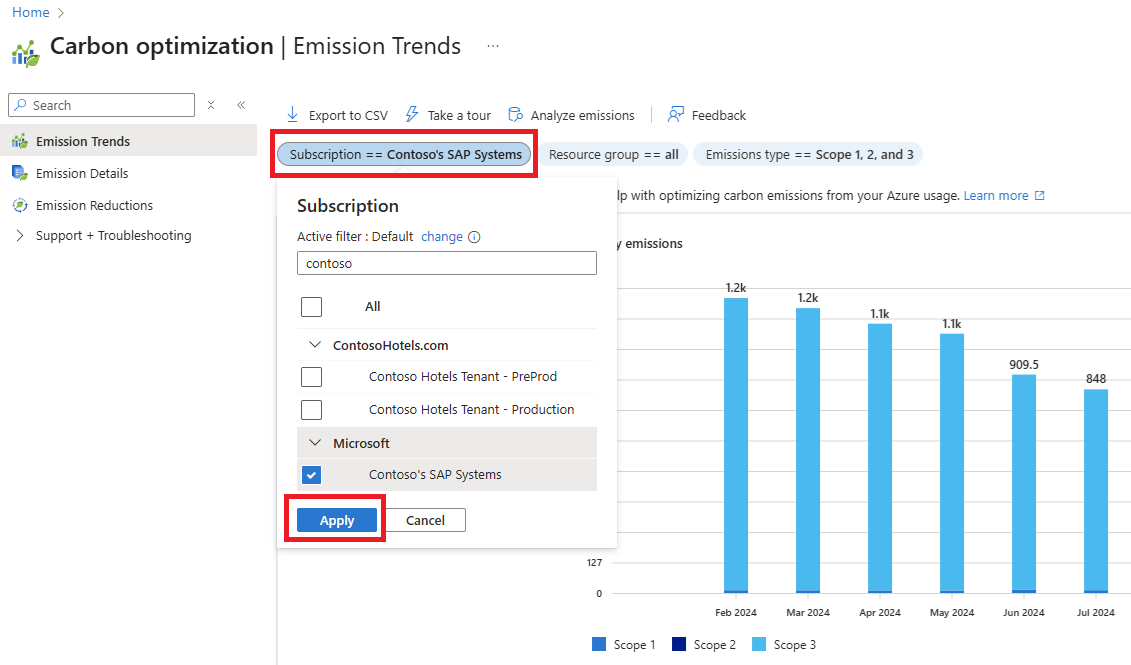
- 탄소 최적화 페이지에서 구독 선택하여 배출 데이터를 필터링합니다.
- 최대 100개의 구독을 선택한 후 적용을 선택하십시오. 제한에 대한 자세한 내용은 문제 해결 페이지를 참조하세요.
- 리소스 그룹 및 배출 유형같은 더 많은 필터를 사용하여 필요에 따라 데이터를 구체화합니다.
메모
Service 차원은 Azure 서비스 또는 제품 수준에서 더 정확한 배출량 보기를 제공하기 위해 리소스 종류 대체되었습니다. 이제 리소스 종류 탭은 개별 구성 요소가 아닌 사용 중인 전체 리소스를 기준으로 배출을 그룹화합니다. 예를 들어 이전에는 Azure Data Explorer 리소스의 가상 머신에서 발생한 배출이 Virtual Machine으로 분류되었습니다. 이제 Azure Data Explorer에서 분류되어 사용 중인 실제 리소스 종류에 맞춰 조정됩니다.
배출 추세
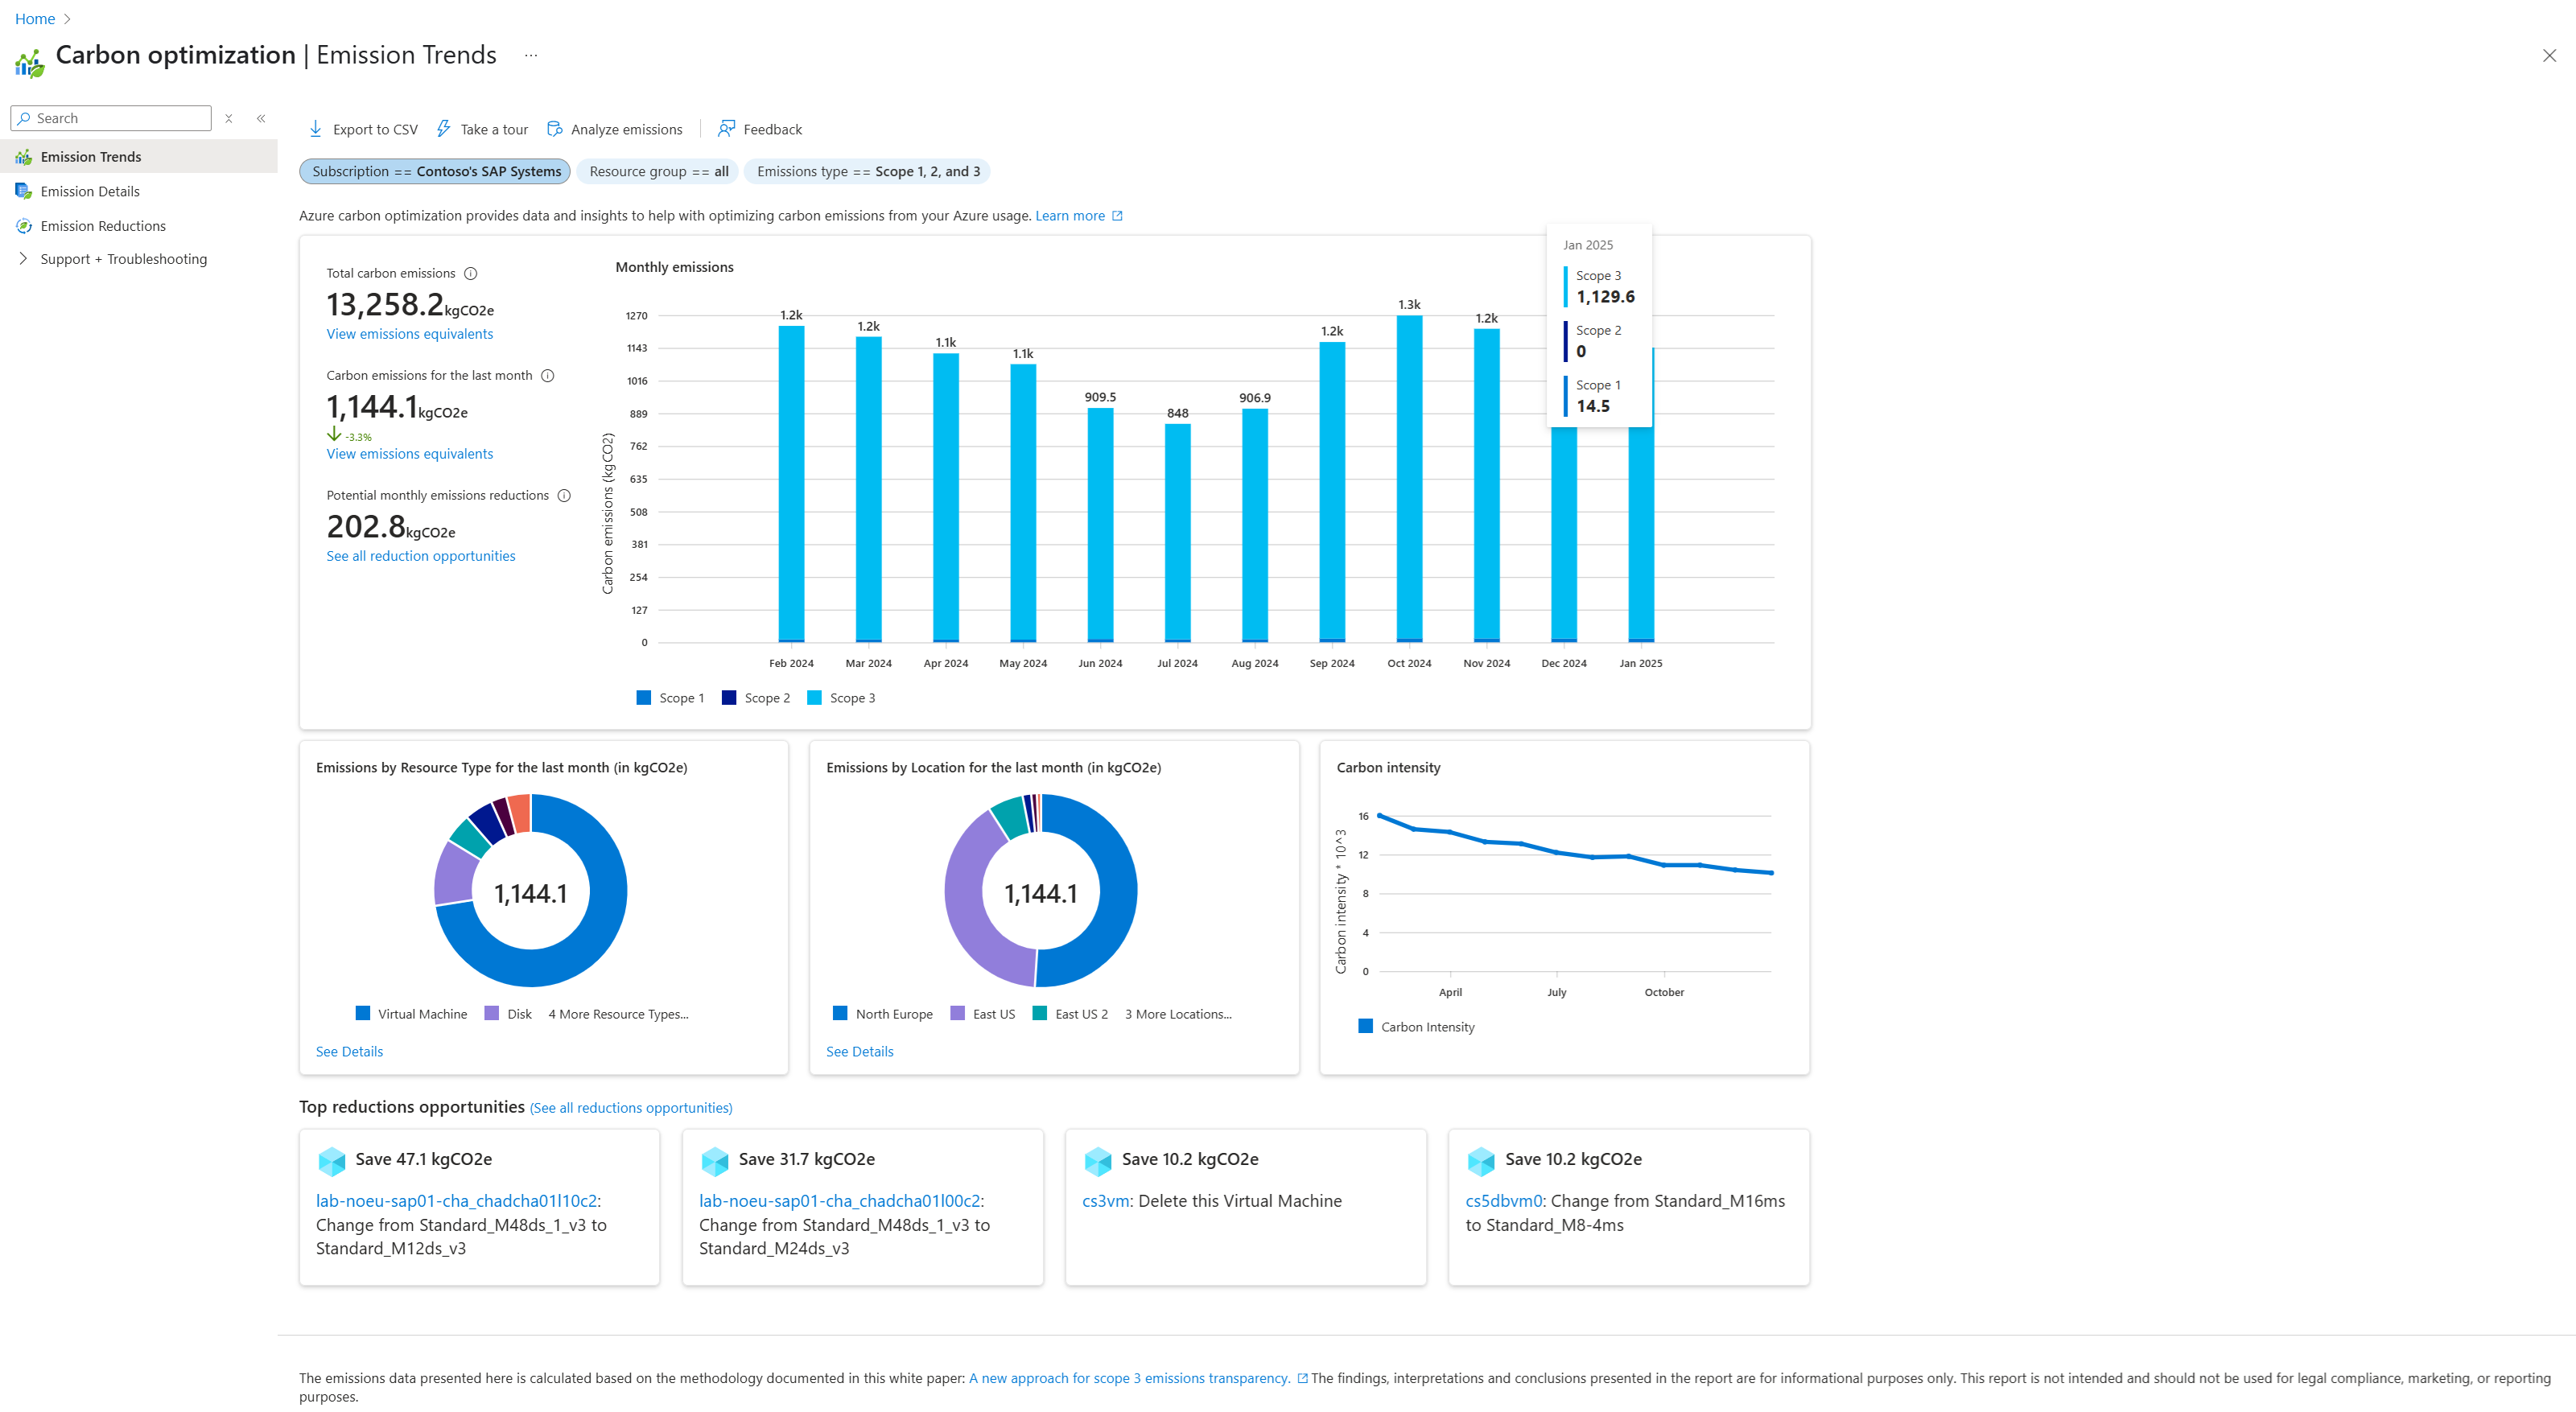
배출 추세 페이지는 클라우드 배출의 패턴을 추적하고 주요 기여 요인을 이해하는 데 도움이 됩니다.
다음은 배출 추세 페이지의 예제 이미지입니다.
- 월별 추세 - 지난 12개월 동안의 배출량 추세를 확인하여 시간에 따른 추세 및 성능을 평가합니다.
- 배출 유형별 분석 - 차트의 막대 위로 마우스를 가져가서 범위별로 분류된 배출을 확인합니다. 범위 1, 범위 2 시장 및 범위 3대한 정보가 제공됩니다. 범위에 대한 자세한 내용은 범위 1, 2 및 3참조하세요.
- 리소스 종류 및 위치 분석 - Azure 리소스 종류 및 위치 기반으로 배출을 분석하여 주요 내보내기와 감소 기회를 식별합니다.
- 상위 감소 기회 - 리소스 사용률에 따라 배출 감소에 대한 권장 사항을 확인합니다. 구현을 위해 관련 리소스 페이지로 이동하려면 권장 사항을 선택합니다. 권장 사항에 대한 자세한 내용은 Azure탄소 배출량 줄이기를 참조하세요.
-
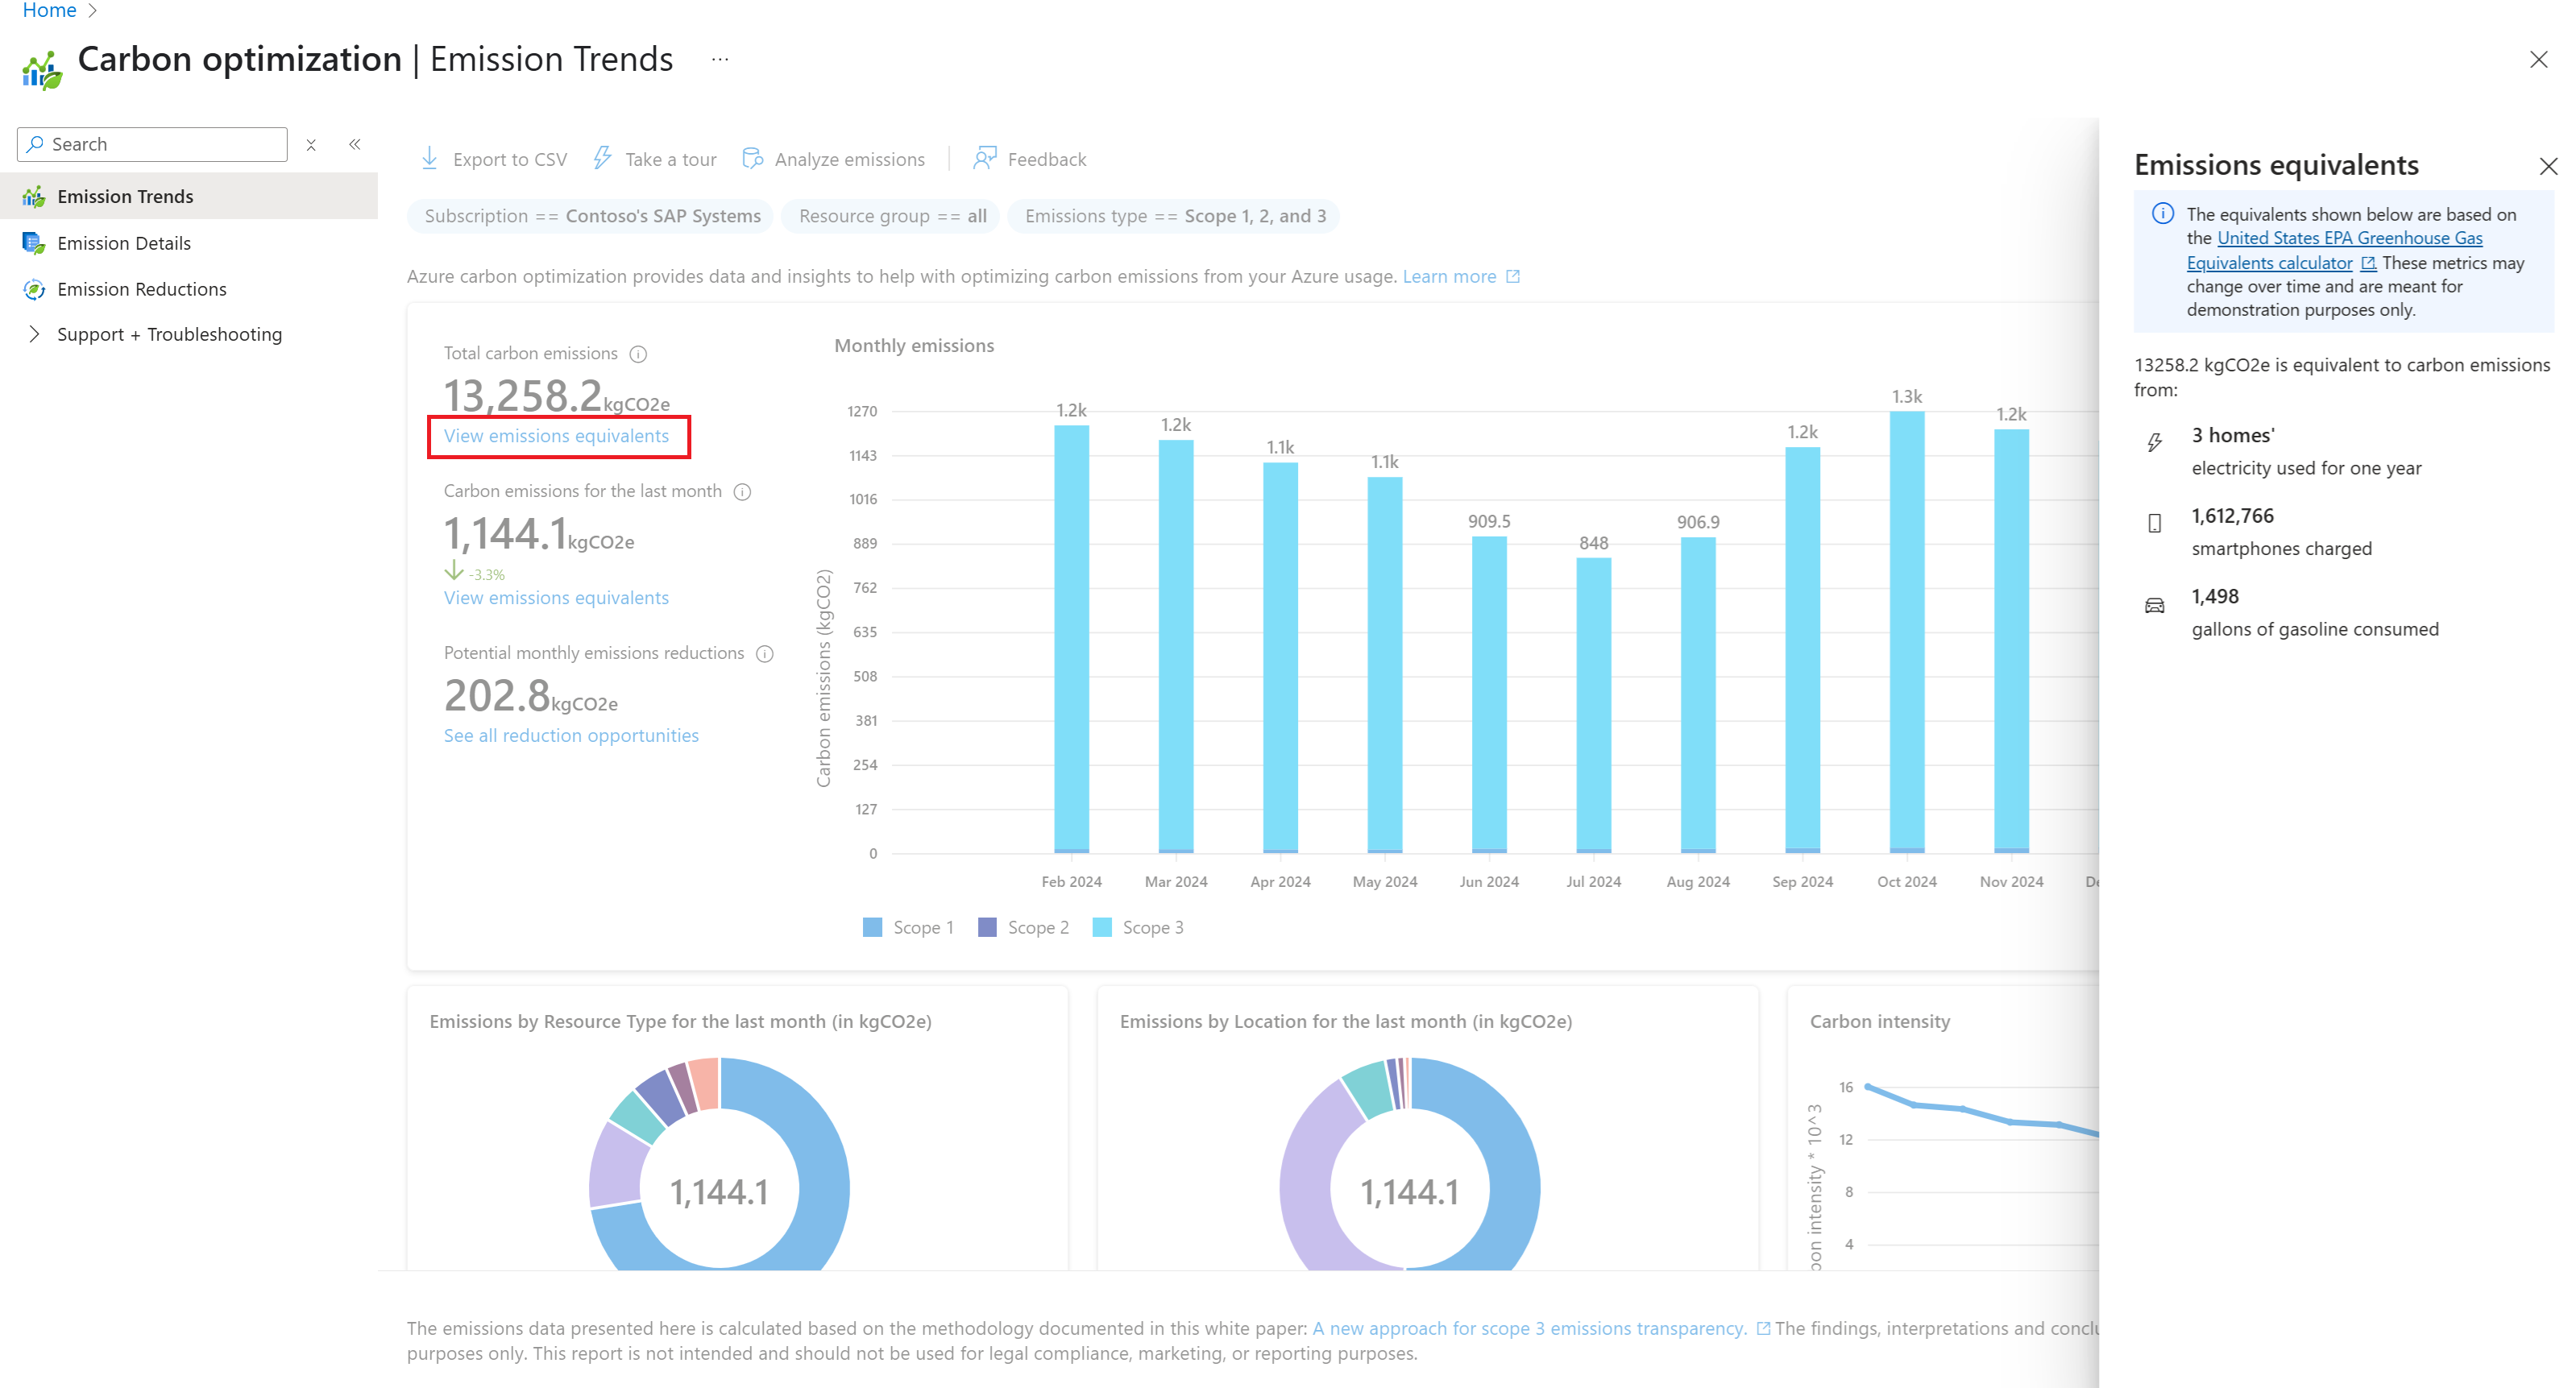
배출량 등가물 - 총 탄소 배출량 아래의 배출량 등가물 보기를 선택하여, EPA 온실가스 동등 계산기을 기반으로 한 실제 비교를 확인하세요.
다음은 배출 등가물을 나타내는 예제 이미지입니다.
배출 세부 정보
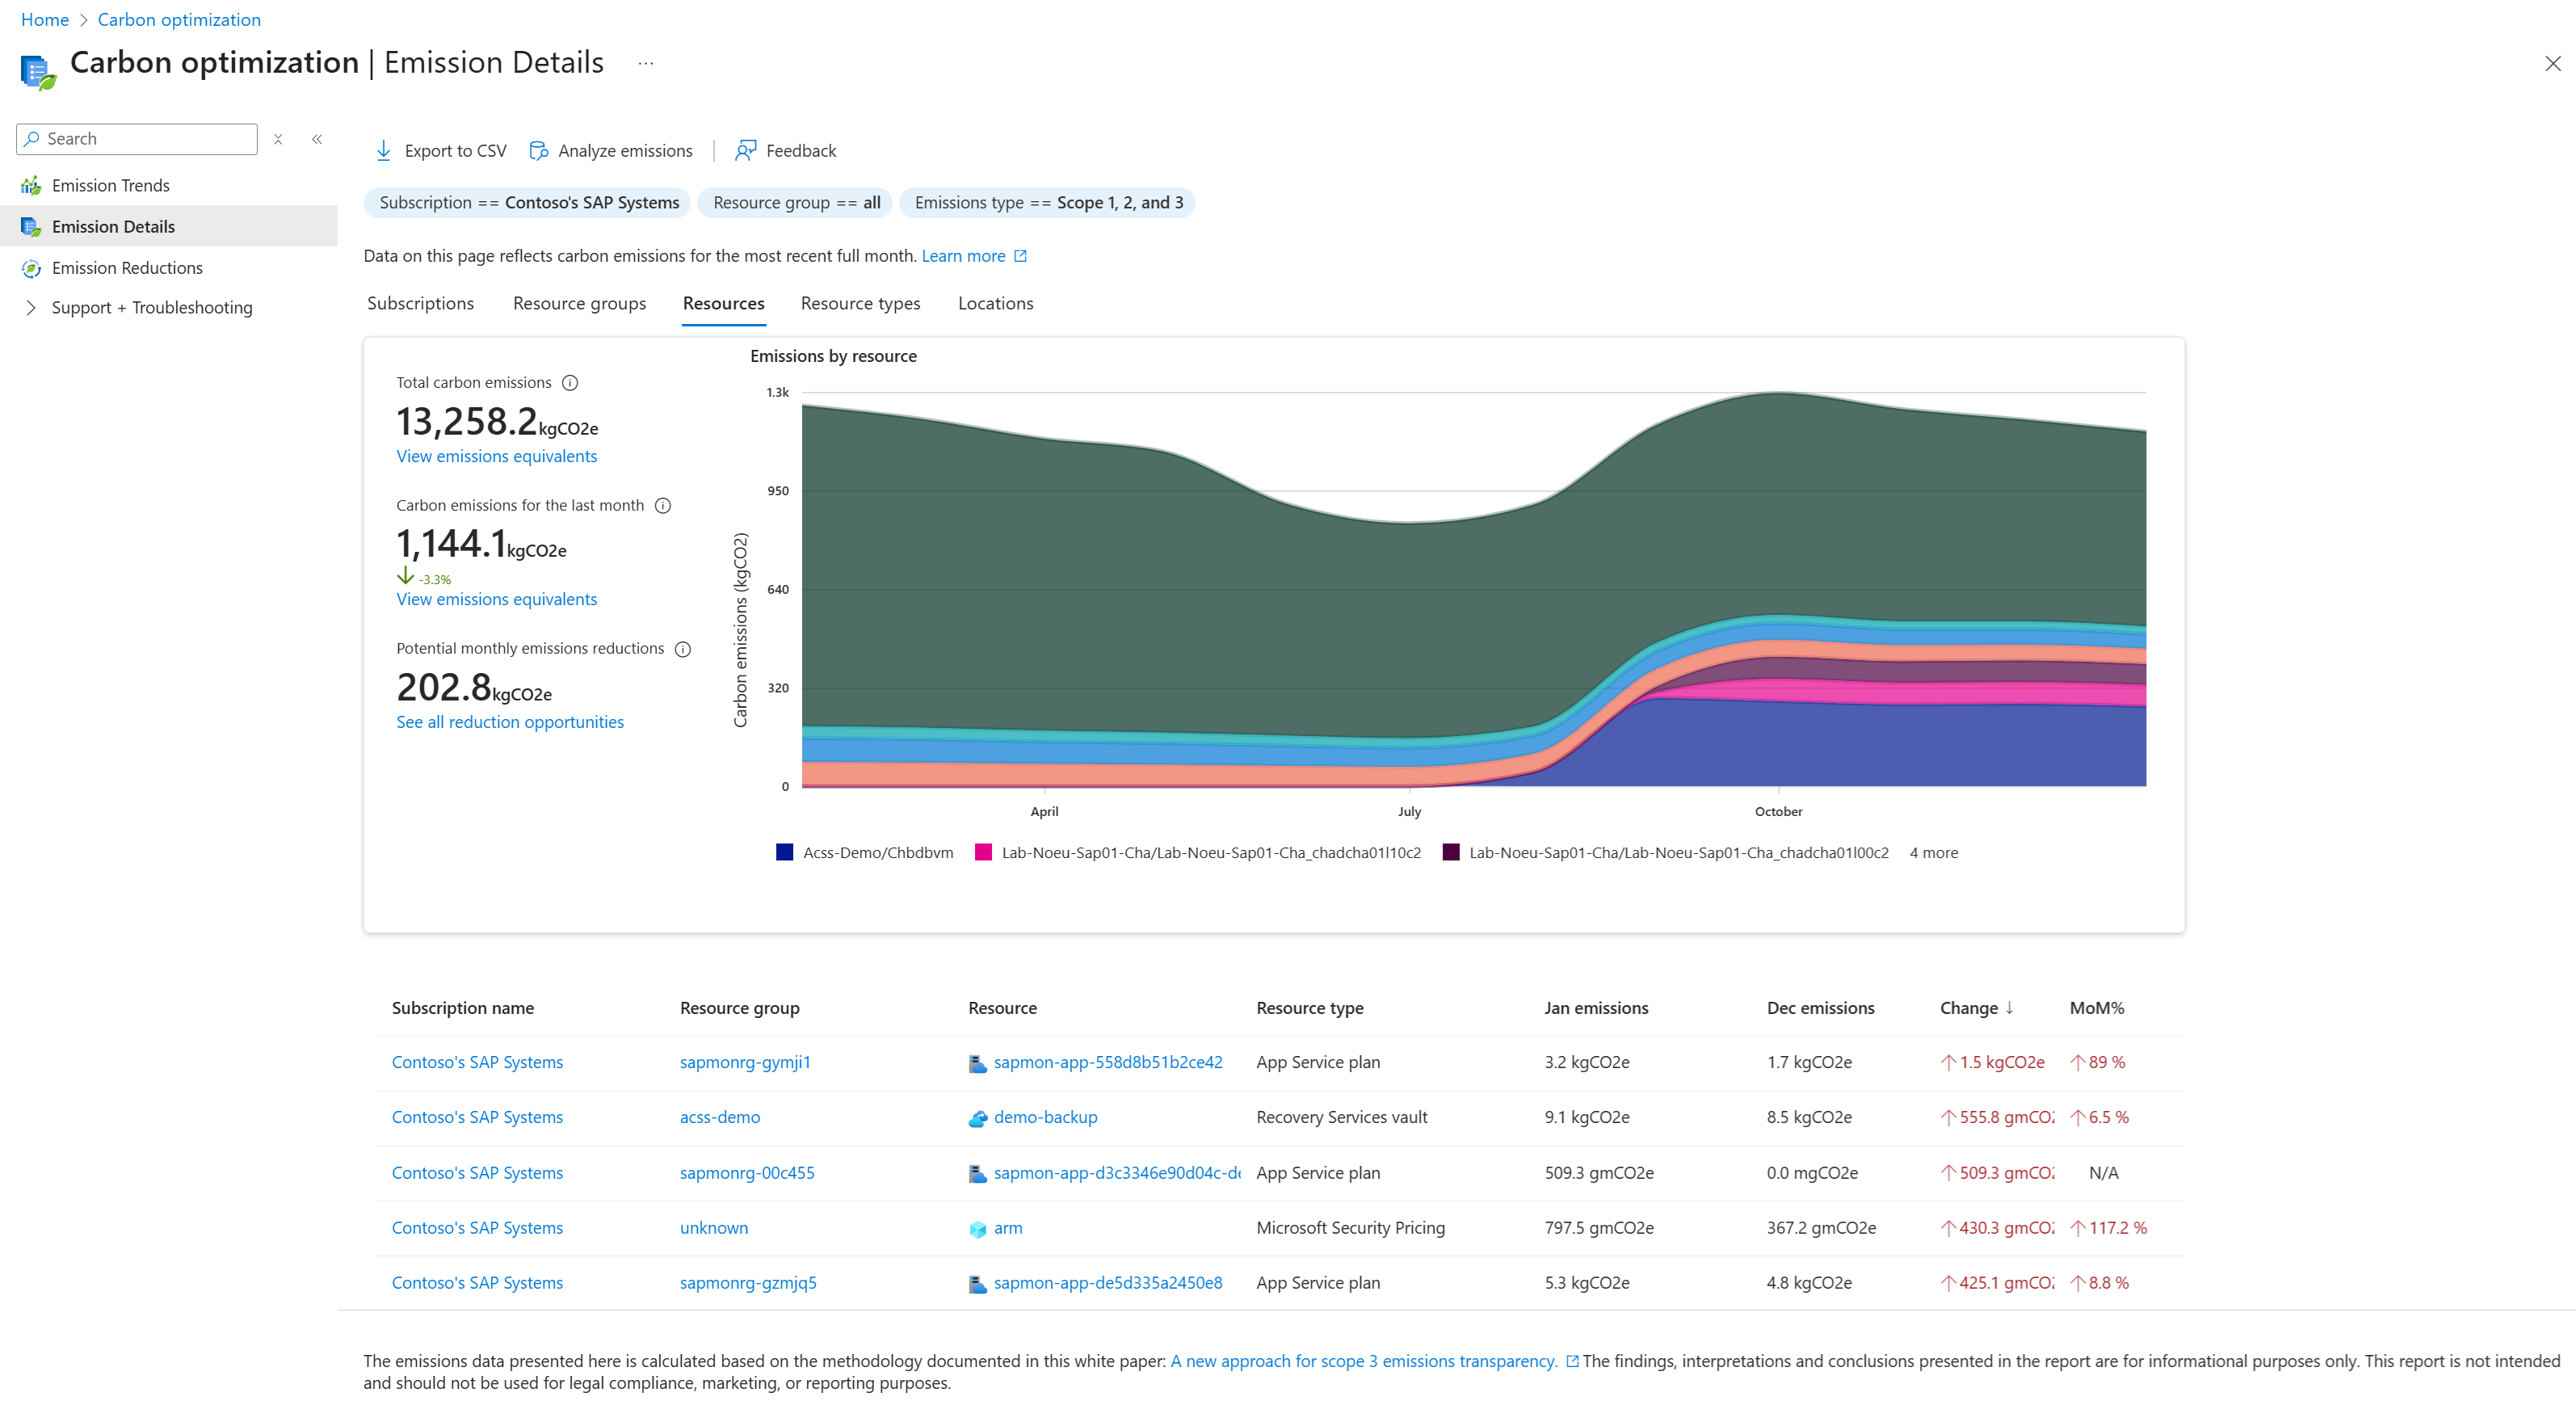
Azure 리소스 전체에서 배출에 대한 심층적인 인사이트를 얻고 최적화를 위한 주요 영역을 식별합니다. 탐색 패널에서 배출 세부 정보 선택합니다.
다음은 배출 세부 정보 페이지의 예제 이미지입니다.
배출 세부 정보 페이지에는 다음과 같은 영역이 있습니다.
- 범주별 분석 - 차트 위의 탭을 사용하여 구독, 리소스 그룹, 리소스, 리소스 종류및 위치 구성된 배출 데이터를 봅니다.
- 월별 변경 내용 추적 - 최근 달의 배출량을 이전 달과 비교하여 추세를 모니터링하고 매월 주요 교대조를 식별합니다.
- 정렬 - 변경 기준으로 정렬하여 가장 큰 월별 변형을 강조 표시하는 등 배출 데이터를 정렬할 열 머리글을 선택합니다.
- 필터링 - 구독, 리소스 그룹, 리소스 종류 및 위치 필터를 사용하여 데이터를 정제하고 더욱 세분화합니다.
- 데이터 내보내기 - 페이지 맨 위에서 CSV로 내보내기를 선택하여 배출 데이터를 CSV 파일로 다운로드합니다. 데이터 내보내기에 대한 더 많은 정보는 배출 데이터 내보내기을 참조하세요.
주요 사용 사례
- 상위 배출 기여자를 식별합니다.
- 월별 배출량의 중요한 변화를 감지합니다.
- 사용되지 않거나 중복된 리소스를 감사 및 해제합니다.
- 다양한 구독, 리소스 그룹 및 리소스의 배출량을 비교합니다.
- 운영 변경이 배출에 미치는 영향을 추적합니다.
- 최적화를 위해 배출 핫스팟을 정확히 파악합니다.


