series_mv_if_anomalies_fl()
이 함수 series_mv_if_anomalies_fl() 는 scikit-learn에서 격리 포리스트 모델을 적용하여 계열에서 다변량 변칙을 검색하는 UDF(사용자 정의 함수)입니다. 이 함수는 계열 집합을 숫자 동적 배열, 기능 열의 이름 및 전체 계열에서 예상되는 변칙 백분율로 허용합니다. 이 함수는 각 계열에 대한 격리 트리의 앙상블을 빌드하고 신속하게 격리된 점을 변칙으로 표시합니다.
필수 조건
- 클러스터에서 Python 플러그 인을 사용하도록 설정해야 합니다. 이 작업은 함수에 사용되는 인라인 Python에 필요합니다.
- 데이터베이스에서 Python 플러그 인을 사용하도록 설정해야 합니다. 이 작업은 함수에 사용되는 인라인 Python에 필요합니다.
구문
T | invoke series_mv_if_anomalies_fl(features_cols anomaly_col [, score_col [ , anomalies_pct [, num_trees [ , samples_pct ]]], )
구문 규칙에 대해 자세히 알아봅니다.
매개 변수
| 이름 | Type | 필수 | 설명 |
|---|---|---|---|
| features_cols | dynamic |
✔️ | 다변량 변칙 검색 모델에 사용되는 열의 이름을 포함하는 배열입니다. |
| anomaly_col | string |
✔️ | 검색된 변칙을 저장할 열의 이름입니다. |
| score_col | string |
변칙의 점수를 저장할 열의 이름입니다. | |
| anomalies_pct | real |
데이터에서 예상되는 변칙 비율을 지정하는 [0-50] 범위의 실수입니다. 기본값: 4%. | |
| num_trees | int |
각 시계열에 대해 빌드할 격리 트리의 수입니다. 기본값: 100. | |
| samples_pct | real |
각 트리를 빌드하는 데 사용되는 샘플의 비율을 지정하는 [0-100] 범위의 실수입니다. 기본값: 100%, 즉 전체 계열을 사용합니다. |
함수 정의
다음과 같이 해당 코드를 쿼리 정의 함수로 포함하거나 데이터베이스에 저장된 함수로 만들어 함수를 정의할 수 있습니다.
다음 let 문을 사용하여 함수를 정의합니다. 사용 권한이 필요 없습니다.
Important
let 문은 자체적으로 실행할 수 없습니다. 그 뒤에 테이블 형식 식 문이 있어야 합니다. 작업 예제 series_mv_if_anomalies_fl()를 실행하려면 예제를 참조 하세요.
// Define function
let series_mv_if_anomalies_fl=(tbl:(*), features_cols:dynamic, anomaly_col:string, score_col:string='', anomalies_pct:real=4.0, num_trees:int=100, samples_pct:real=100.0)
{
    let kwargs = bag_pack('features_cols', features_cols, 'anomaly_col', anomaly_col, 'score_col', score_col, 'anomalies_pct', anomalies_pct, 'num_trees', num_trees, 'samples_pct', samples_pct);
    let code = ```if 1:
        from sklearn.ensemble import IsolationForest
        features_cols = kargs['features_cols']
        anomaly_col = kargs['anomaly_col']
        score_col = kargs['score_col']
        anomalies_pct = kargs['anomalies_pct']
        num_trees = kargs['num_trees']
        samples_pct = kargs['samples_pct']
        dff = df[features_cols]
        iforest = IsolationForest(contamination=anomalies_pct/100.0, random_state=0, n_estimators=num_trees, max_samples=samples_pct/100.0)
        for i in range(len(dff)):
            dffi = dff.iloc[[i], :]
            dffe = dffi.explode(features_cols)
            iforest.fit(dffe)
            df.loc[i, anomaly_col] = (iforest.predict(dffe) < 0).astype(int).tolist()
            if score_col != '':
                df.loc[i, score_col] = iforest.decision_function(dffe).tolist()
        result = df
    ```;
    tbl
    | evaluate hint.distribution=per_node python(typeof(*), code, kwargs)
};
// Write your query to use the function here.
예시
다음 예제에서는 호출 연산자를 사용하여 함수를 실행합니다.
쿼리 정의 함수를 사용하려면 포함된 함수 정의 후에 호출합니다.
// Define function
let series_mv_if_anomalies_fl=(tbl:(*), features_cols:dynamic, anomaly_col:string, score_col:string='', anomalies_pct:real=4.0, num_trees:int=100, samples_pct:real=100.0)
{
let kwargs = bag_pack('features_cols', features_cols, 'anomaly_col', anomaly_col, 'score_col', score_col, 'anomalies_pct', anomalies_pct, 'num_trees', num_trees, 'samples_pct', samples_pct);
let code = ```if 1:
from sklearn.ensemble import IsolationForest
features_cols = kargs['features_cols']
anomaly_col = kargs['anomaly_col']
score_col = kargs['score_col']
anomalies_pct = kargs['anomalies_pct']
num_trees = kargs['num_trees']
samples_pct = kargs['samples_pct']
dff = df[features_cols]
iforest = IsolationForest(contamination=anomalies_pct/100.0, random_state=0, n_estimators=num_trees, max_samples=samples_pct/100.0)
for i in range(len(dff)):
dffi = dff.iloc[[i], :]
dffe = dffi.explode(features_cols)
iforest.fit(dffe)
df.loc[i, anomaly_col] = (iforest.predict(dffe) < 0).astype(int).tolist()
if score_col != '':
df.loc[i, score_col] = iforest.decision_function(dffe).tolist()
result = df
```;
tbl
| evaluate hint.distribution=per_node python(typeof(*), code, kwargs)
};
// Usage
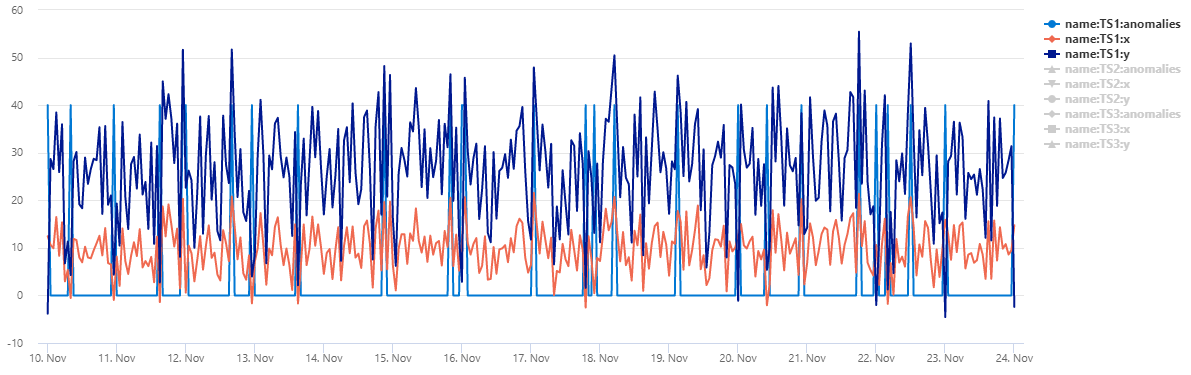
normal_2d_with_anomalies
| extend anomalies=dynamic(null), scores=dynamic(null)
| invoke series_mv_if_anomalies_fl(pack_array('x', 'y'), 'anomalies', 'scores', anomalies_pct=8, num_trees=1000)
| extend anomalies=series_multiply(40, anomalies)
| render timechart
출력
테이블 normal_2d_with_anomalies 3개의 시계열 집합이 포함되어 있습니다. 각 시계열에는 자정, 오전 8시 및 오후 4시에 매일 변칙이 추가된 2차원 정규 분포가 있습니다. 예제 쿼리를 사용하여 이 샘플 데이터 세트를 만들 수 있습니다.
데이터를 분산형 차트로 보려면 사용 코드를 다음으로 바꿉니다.
normal_2d_with_anomalies
| extend anomalies=dynamic(null)
| invoke series_mv_if_anomalies_fl(pack_array('x', 'y'), 'anomalies')
| where name == 'TS1'
| project x, y, anomalies
| mv-expand x to typeof(real), y to typeof(real), anomalies to typeof(string)
| render scatterchart with(series=anomalies)
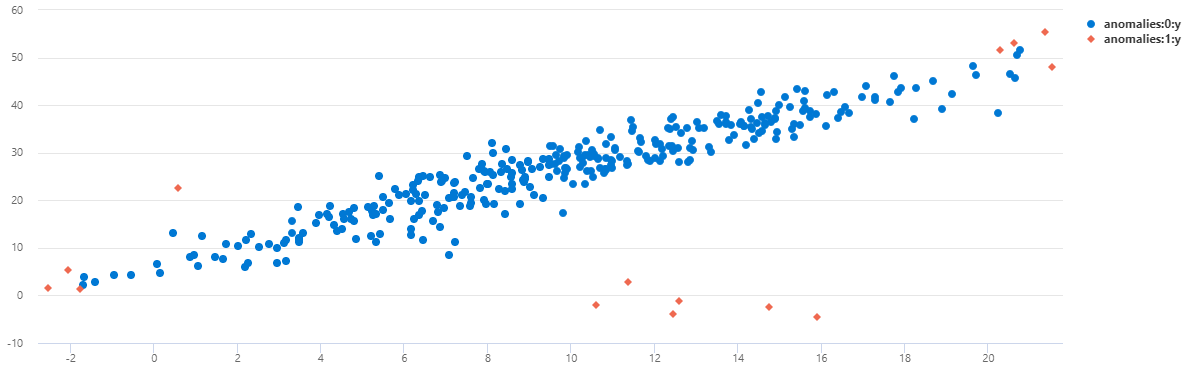
TS2에서 오전 8시에 발생하는 대부분의 변칙이 이 다변량 모델을 사용하여 검색되었음을 알 수 있습니다.
이 기능은 지원되지 않습니다.
피드백
출시 예정: 2024년 내내 콘텐츠에 대한 피드백 메커니즘으로 GitHub 문제를 단계적으로 폐지하고 이를 새로운 피드백 시스템으로 바꿀 예정입니다. 자세한 내용은 다음을 참조하세요. https://aka.ms/ContentUserFeedback
다음에 대한 사용자 의견 제출 및 보기