자습서: 관리형 프라이빗 엔드포인트를 사용하여 AKS 클러스터에서 자체 호스팅 Prometheus 서비스에 연결
이 가이드에서는 AKS(Azure Kubernetes Service) 클러스터에 오픈 소스 모니터링 및 경고 도구 키트인 Prometheus를 설치하는 단계를 안내합니다. 그런 다음 Azure Managed Grafana의 관리형 프라이빗 엔드포인트를 사용하여 이 Prometheus 서버에 연결하고 Grafana 대시보드에 Prometheus 데이터를 표시합니다.
이 자습서에서는 다음을 하는 방법을 알아볼 수 있습니다.
- Azure Kubernetes Service 클러스터 만들기
- Prometheus 설치
- Prometheus 서버에 프라이빗 링크 서비스 추가
- 관리되는 프라이빗 엔드포인트를 사용하여 커넥트
- Grafana 대시보드에 Prometheus 데이터 표시
필수 조건
시작하기 전에 다음을 확인합니다.
Azure Kubernetes Service 클러스터 만들기
명령을 실행하여 Azure CLI에 로그인합니다
az login.az login여러 Azure 구독이 있는 경우 명령을
az account set -s <your-azure-subscription-id>사용하여 Azure 구독을 선택합니다.kubectl을 설치하거나 업데이트합니다.
az aks install-cli후속 명령에서 사용할 두 개의 bash/zsh 변수를 만듭니다. 다른 셸을 사용하는 경우 아래 구문을 변경합니다.
RESOURCE_GROUP=myResourceGroup
AKS_NAME=myaks
리소스 그룹을 만듭니다. 이 예제에서는 미국 중서부 Azure 지역에 리소스 그룹을 만듭니다.
az group create --name $RESOURCE_GROUP --location westcentralusaz aks create 명령을 사용하여 새 AKS 클러스터를 만듭니 다. 여기서는 비용 효율적이고 이와 같은 작은 테스트/개발 워크로드에 적합한 B 시리즈 버스트 가능 가상 머신 유형을 사용하여 3노드 클러스터를 만듭니다.
az aks create --resource-group $RESOURCE_GROUP \
  --name $AKS_NAME \
  --node-count 3 \
  --node-vm-size Standard_B2s \
  --generate-ssh-keys
이 작업이 완료될 때까지 몇 분 정도 걸릴 수 있습니다.
만든 클러스터에 인증합니다.
az aks get-credentials \
  --resource-group $RESOURCE_GROUP \
  --name $AKS_NAME
이제 kubectl을 사용하여 Kubernetes 클러스터에 액세스할 수 있습니다.
kubectl을 사용하여 만든 노드를 확인합니다.
kubectl get nodes
Prometheus 설치
Prometheus를 설치하는 인기 있는 방법은 Prometheus 및 관련 모니터링 구성 요소의 Kubernetes 네이티브 배포 및 관리를 제공하는 prometheus 연산자를 통해서입니다. 이 자습서에서는 kube-prometheus-stack Helm 차트를 사용하여 prometheus-operator를 배포합니다.
helm-charts 리포지토리를 추가한 다음 리포지토리 목록을 업데이트합니다.
helm repo add prometheus-community https://prometheus-community.github.io/helm-charts
helm repo update
Helm 차트를 모니터링이라는 네임스페이스에 설치합니다. 이 네임스페이스는 자동으로 만들어집니다.
helm install prometheus \
  prometheus-community/kube-prometheus-stack \
  --namespace monitoring \
  --create-namespace
helm 명령은 배포된 Pod의 상태 검사 묻는 메시지를 표시합니다. 다음 명령을 실행합니다.
kubectl --namespace monitoring get pods계속하기 전에 Pod가 모두 "실행 중"인지 확인합니다. 드문 경우 실행 상태에 도달하지 않는 경우 문제를 해결할 수 있습니다.
Prometheus 서버에 프라이빗 링크 서비스 추가
Azure Private Link 서비스를 사용하면 여러 Azure 가상 네트워크에서 프라이빗 링크를 통해 Kubernetes 서비스를 사용할 수 있습니다. AKS는 Azure Private Link 서비스와 네이티브 통합을 가지며, Kubernetes 서비스 개체에 주석을 추가하여 Azure 내에서 해당 프라이빗 링크 서비스를 만드는 데 도움이 됩니다.
pls-prometheus-svc.yaml 파일의 내용은 아래를 참조하세요.
apiVersion: v1
kind: Service
metadata:
  name: prom-pls-svc
  annotations:
    service.beta.kubernetes.io/azure-load-balancer-internal: "true" # Use an internal LB with PLS
    service.beta.kubernetes.io/azure-pls-create: "true"
    service.beta.kubernetes.io/azure-pls-name: promManagedPls
    service.beta.kubernetes.io/azure-pls-proxy-protocol: "false"
    service.beta.kubernetes.io/azure-pls-visibility: "*"
spec:
  type: LoadBalancer
  selector:
    # app: myApp
    app.kubernetes.io/name: prometheus
    prometheus: prometheus-kube-prometheus-prometheus # note that this is related to the release name
  ports:
    - name: http-web
      protocol: TCP
      port: 9090
      targetPort: 9090
다음 명령을 실행하여 Prometheus 서버에 프라이빗 링크 서비스를 추가합니다.
kubectl --namespace monitoring apply -f pls-prometheus-svc.yaml이름이
promManagedPls있는 프라이빗 링크 서비스는 AKS 관리되는 리소스 그룹에 만들어집니다. 이 작업에는 몇 분이 소요됩니다.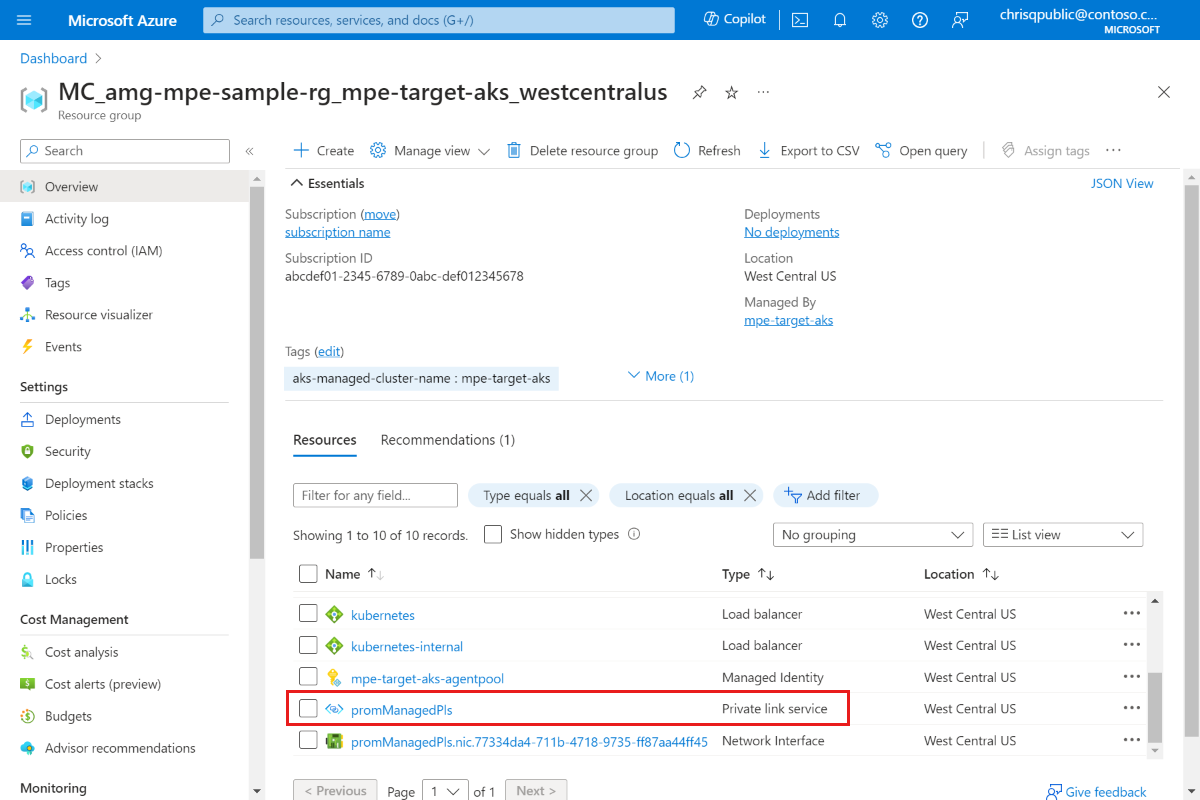
관리되는 프라이빗 엔드포인트를 사용하여 커넥트
Azure Managed Grafana 작업 영역이 아직 없는 경우 Azure Managed Grafana 빠른 시작을 따라 만듭니다.
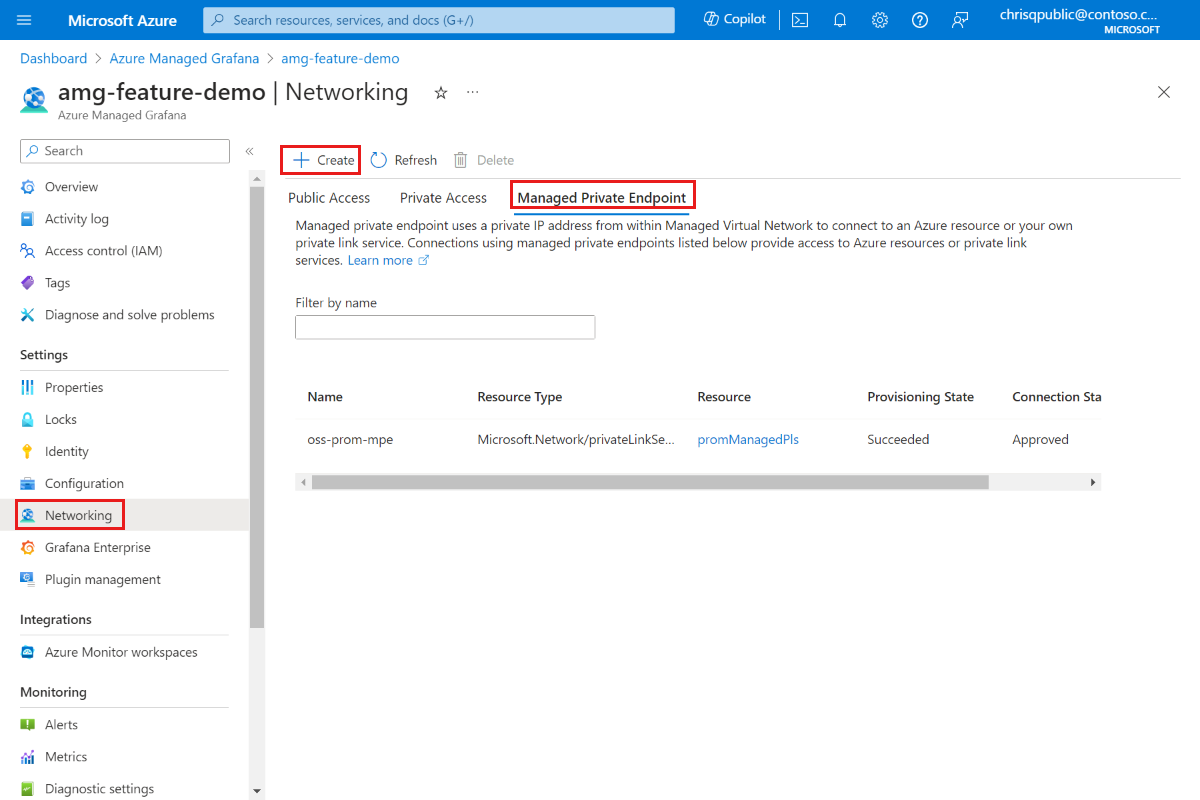
Azure Managed Grafana 작업 영역을 열고 네트워킹>관리되는 프라이빗 엔드포인트>만들기로 이동합니다.
관리형 프라이빗 엔드포인트의 이름을 입력하고 Azure 구독을 선택합니다.
리소스 유형의 경우 Microsoft.Network/privateLinkServices(프라이빗 링크 서비스)를 선택하고 대상 리소스의 경우 위의 단계에서 만든 프라이빗 링크 서비스를 선택합니다
promManagedPls. 관리되는 각 프라이빗 엔드포인트는 개인 IP 주소를 가져옵니다. 이 관리되는 프라이빗 엔드포인트에 대해 할기본 이름을 제공할 수도 있습니다. Azure Managed Grafana 서비스는 Azure Managed Grafana 환경 내에서 관리되는 프라이빗 엔드포인트의 프라이빗 IP로 이 작업을 기본 확인합니다. 예를 들어 do기본를 으로*.prom.my-own-domain.com설정합니다.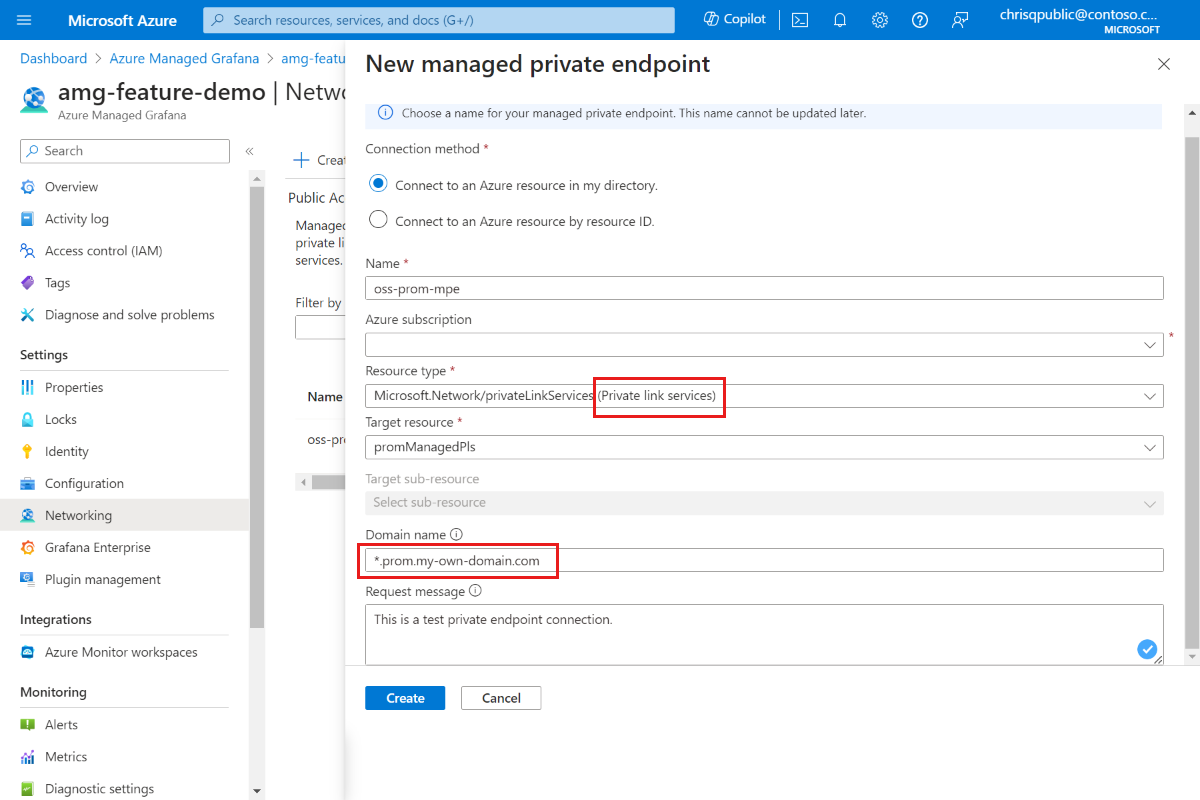
promManagedPls 리소스로 이동하여 프라이빗 엔드포인트 연결을 승인합니다. 설정 프라이빗 엔드포인트 연결을 이동하고 검사box를 사용하여 연결을 선택하고 승인합니다.
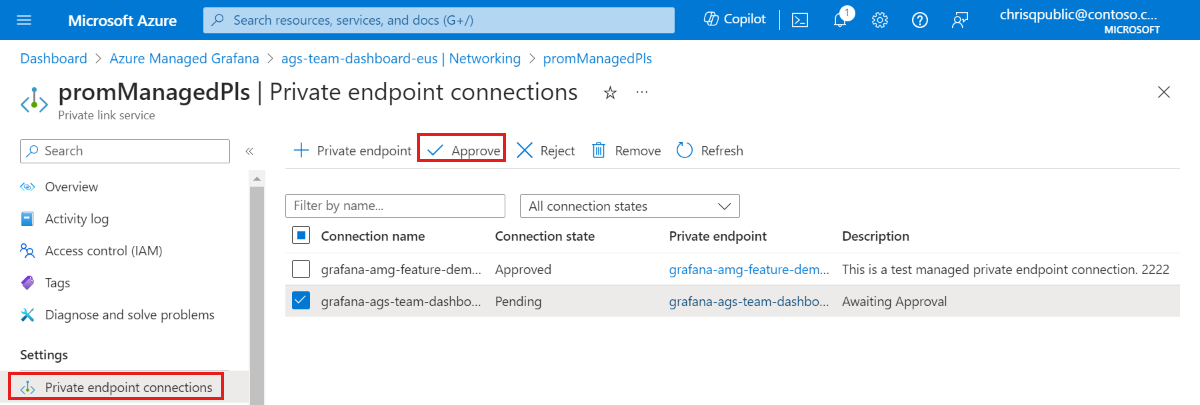
프라이빗 엔드포인트 연결이 승인되면 Azure Managed Grafana 리소스로 돌아가서 관리형 프라이빗 엔드포인트 탭에서 새로 고침 단추를 선택하여 동기화합니다
Connection state. 이제 승인됨으로 표시됩니다.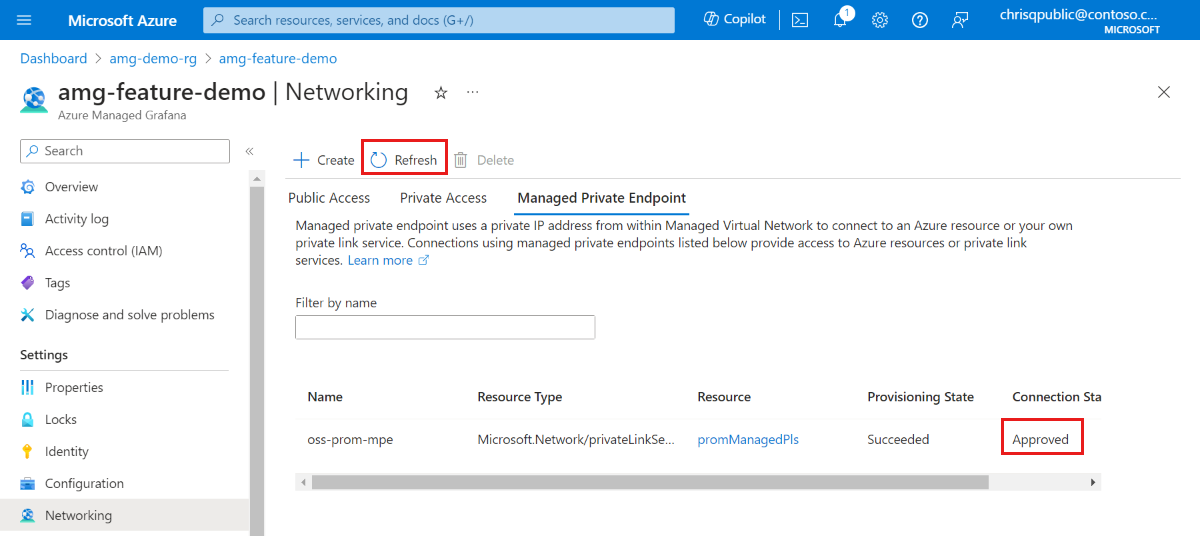
Grafana 대시보드에 Prometheus 데이터 표시
Grafana 포털에서 Grafana에 Prometheus 데이터 원본을 추가합니다. 자세한 내용은 데이터 원본 추가로 이동합니다. Prometheus URL은 다음과 입니다
http://prom-service.prom.my-own-domain.com:9090.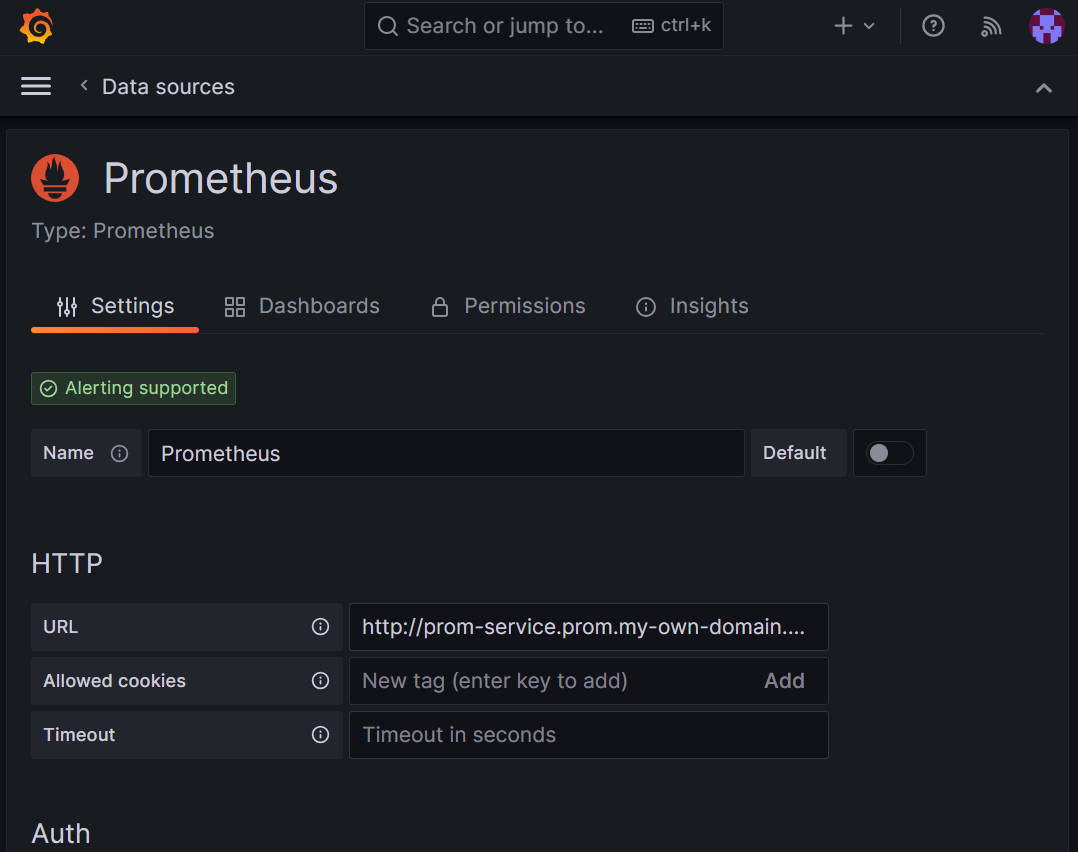
자체 호스팅 Prometheus 데이터 원본을 활용하려면 노드 내보내기 전체 대시보드, ID
1860를 사용해 보세요. 자세한 지침은 Grafana Labs에서 대시보드 가져오기로 이동하세요.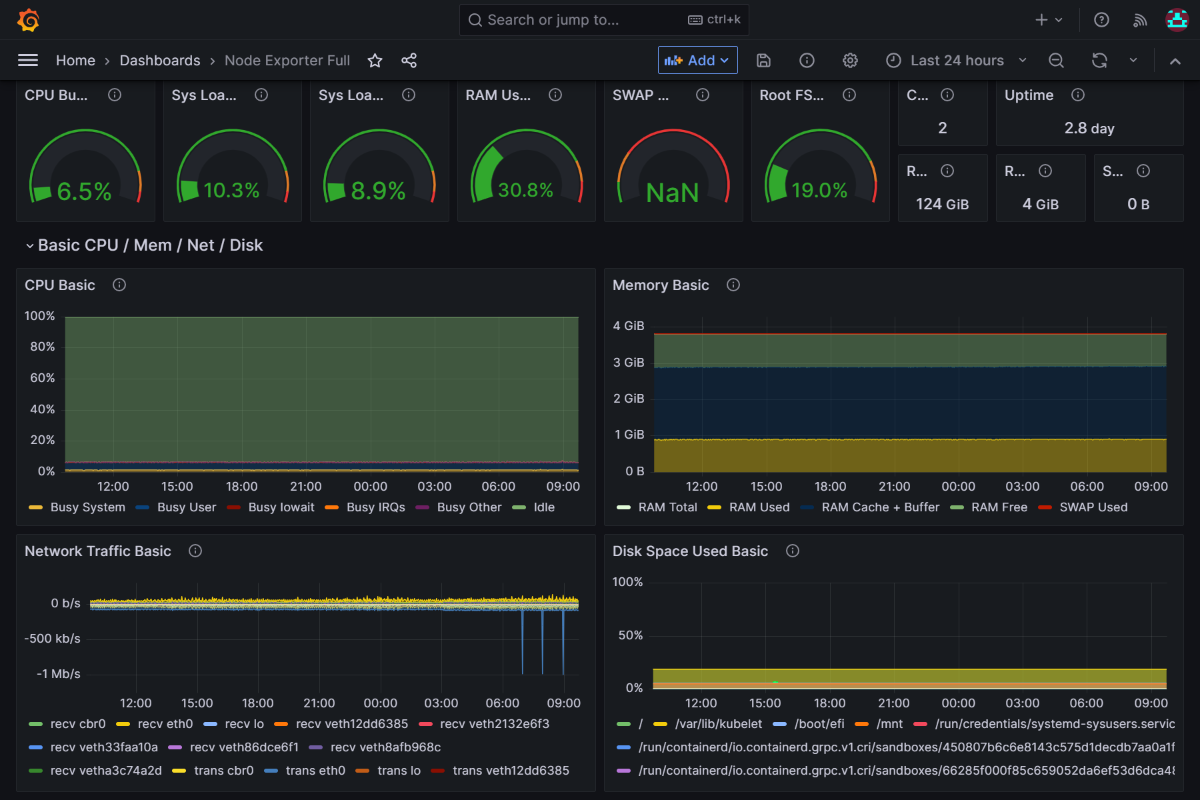
다음 단계
서비스 계정을 사용하는 방법을 알아봅니다.