Heatmaps Features for Mobile Apps
Heat maps are a great way to analyze user behavior in an aggregated manner. Once you onboard Clarity and land on Heatmaps, Clarity generates heat maps for popular screens.
There's no creation delay. Heat maps return within a matter of seconds. Clarity Mobile Apps support Taps map.
Note
There's no minimum traffic limitation to generate a heat map.
Supported filters
Heat maps filters help you sort and customize your visualizations. For more information, see Filters overview.
Segments
To avoid multiple manual typings, you can save groups of filters into segments. Segments can be applied to filters and custom tags. For more information, see Segments.
Compare Heatmaps
Use Heatmaps Compare to compare two same or different screens.
Sharing
Learn how to share Heatmaps either internally with your team or externally outside your team.
Color coding in a Heatmap
Clarity uses color scale representation to better understand the user interaction with your app. The color scale allows you to view your user movement throughout the app.
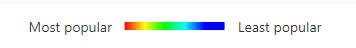
Red indicates hot areas where users interact more that's most popular.
Blue indicates cold areas where the users interact the least that is least popular.
View Recordings
You can also view the recordings of tapped data to understand and analyze user taps. Learn more on how to view recordings.
Opacity
Opacity changes the transparency of heat when the heat covers up the text or images. You can use opacity to view the heat in red zones quickly.
Download
Learn how to download Heatmaps to save them for further reference or share it with your team.
Heatmaps limitations
- Heat maps data is retained for up to 13 months.
- Heat maps are limited to up to 100,000 screen views per heat map.
- Clarity doesn't support capturing screenshots of different dynamic sections, such as a menu that opens as you hover/tap.
- Clarity uses CSS element selectors to create a heat map and chooses a random playback to overlay the heat map on the top. The page state depends on the playback.
- The left panel that displays the screens isn't 100% exhaustive. In addition, there might be some duplication in the screens.
- Taps on the same element might not be aggregated together if the element is moved from its original place (when the first heatmap was generated) to a different place in the application UI (or to a different fragment/activity).
FAQ
For more answers, refer to FAQ.