시각적 개체를 만들 때 속성을 사용자 지정하기 위한 옵션을 추가할 수 있습니다. 사용자 지정 형식으로 지정할 수 있는 항목에는 다음이 포함됩니다.
- 타이틀
- 배경
- Border
- Shadow
- 색
이 자습서에서는 다음을 하는 방법을 알아볼 수 있습니다.
- 시각적 개체에 서식 속성을 추가합니다.
- 시각적 개체를 패키징합니다.
- 사용자 지정 시각적 개체를 Power BI Desktop 또는 서비스 보고서로 가져옵니다.
필수 조건
이 자습서에서는 시각적 개체에 일반적인 서식 속성을 추가하는 방법에 관해 설명합니다. 원 카드 시각적 개체를 예제로 사용하겠습니다. 원의 색 및 두께를 변경하는 기능을 추가합니다. 이 자습서에서 만든 원형 카드 프로젝트 폴더가 없다면 계속하기 전에 자습서를 다시 진행하세요.
서식 옵션 추가
PowerShell에서 원 카드 프로젝트 폴더로 이동하여 원 카드 시각적 개체를 시작합니다. 시각적 개체는 컴퓨터에서 호스트되는 동안 실행됩니다.
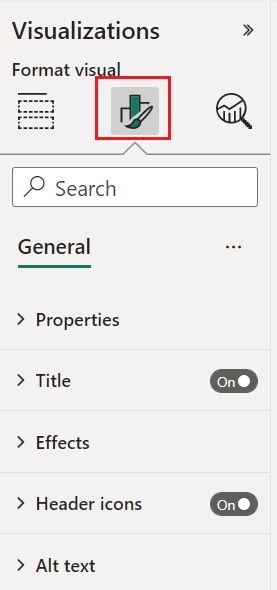
pbiviz startPower BI에서 서식 창을 선택합니다.
일반 서식 옵션은 표시되지만 시각적 개체 서식 옵션은 표시되지 않습니다.
Visual Studio Code에서
capabilities.json파일을 엽니다.dataViewMappings 배열 앞에 objects를 추가합니다.
"objects": {},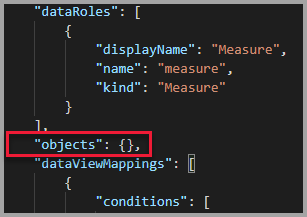
capabilities.json파일을 저장합니다.Power BI에서 서식 옵션을 다시 검토합니다.
참고 항목
서식 옵션이 변경되지 않으면 사용자 지정 시각적 개체 다시 로드를 선택합니다.
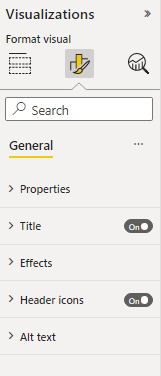
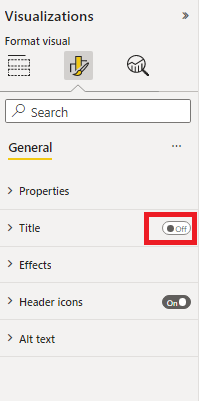
제목 옵션을 ‘끄기’로 설정합니다. 시각적 개체가 왼쪽 위 모서리에 측정값 이름을 표시하지 않는지 확인합니다.
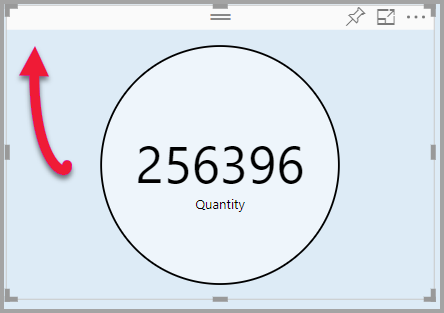
사용자 지정 서식 옵션 추가
이제 원 윤곽선의 색 및 두께를 구성하기 위해 color라는 새 그룹을 추가해 보겠습니다.
PowerShell에서 사용자 지정 시각적 개체를 중지하려면 Ctrl+C를 입력합니다.
Visual Studio Code의
capabilities.json파일에서 다음 JSON 조각을 objects 레이블이 지정된 개체에 삽입합니다."circle": { "properties": { "circleColor": { "type": { "fill": { "solid": { "color": true } } } }, "circleThickness": { "type": { "numeric": true } } } }JSON 조각은 circleColor와 circleThickness라는 두 개의 변수로 구성된 circle이라는 그룹을 설명합니다.
capabilities.json파일을 저장합니다.탐색기 창에서 src 폴더로 이동한 후 settings.ts를 선택합니다. 이 파일은 시작 시각적 개체의 설정을 나타냅니다.
settings.ts파일에서 import 줄과 두 개의 클래스를 다음 코드로 바꿉니다.import { formattingSettings } from "powerbi-visuals-utils-formattingmodel"; import FormattingSettingsCard = formattingSettings.SimpleCard; import FormattingSettingsSlice = formattingSettings.Slice; import FormattingSettingsModel = formattingSettings.Model; export class CircleSettings extends FormattingSettingsCard{ public circleColor = new formattingSettings.ColorPicker({ name: "circleColor", displayName: "Color", value: { value: "#ffffff" }, visible: true }); public circleThickness = new formattingSettings.NumUpDown({ name: "circleThickness", displayName: "Thickness", value: 2, visible: true }); public name: string = "circle"; public displayName: string = "Circle"; public visible: boolean = true; public slices: FormattingSettingsSlice[] = [this.circleColor, this.circleThickness] } export class VisualSettings extends FormattingSettingsModel { public circle: CircleSettings = new CircleSettings(); public cards: FormattingSettingsCard[] = [this.circle]; }이 모듈은 두 개의 클래스를 정의합니다. CircleSettings 클래스는 capabilities.json 파일에 정의된 개체와 일치하는 이름을 사용하여 두 개의 속성(circleColor 및 circleThickness)을 정의하고 기본값을 설정합니다. VisualSettings 클래스는
capabilities.json파일에 설명된 속성에 따라 circle 개체를 정의합니다.settings.ts파일을 저장합니다.visual.ts파일을 엽니다.visual.ts파일에서 다음을 가져옵니다.import { VisualSettings } from "./settings"; import { FormattingSettingsService } from "powerbi-visuals-utils-formattingmodel";Visual 클래스에서 다음 속성을 추가합니다.
private visualSettings: VisualSettings;
private formattingSettingsService: FormattingSettingsService;
이 속성은 시각적 개체 설정을 설명하는 VisualSettings 개체에 대한 참조를 저장합니다.
Visual 클래스에서 constructor의 첫 번째 줄로 다음을 삽입합니다.
this.formattingSettingsService = new FormattingSettingsService();Visual 클래스에서 update 메서드 뒤에 다음 메서드를 추가합니다.
public getFormattingModel(): powerbi.visuals.FormattingModel {
    return this.formattingSettingsService.buildFormattingModel(this.visualSettings);
}
이 함수는 서식 창이 렌더링될 때마다 호출됩니다. 이 함수를 통해 속성 창에서 사용자에게 노출할 개체와 속성을 선택할 수 있습니다.
update 메서드에서 radius 변수 선언 뒤에 다음 코드를 추가합니다.
this.visualSettings = this.formattingSettingsService.populateFormattingSettingsModel(VisualSettings, options.dataViews[0]);
this.visualSettings.circle.circleThickness.value = Math.max(0, this.visualSettings.circle.circleThickness.value);
this.visualSettings.circle.circleThickness.value = Math.min(10, this.visualSettings.circle.circleThickness.value);
이 코드는 서식 옵션을 검색합니다. circleThickness 속성으로 전달된 모든 값을 0에서 10 사이의 숫자로 변환합니다.

circle 요소에서 다음과 같이 채우기 스타일 및 스트로크 너비 스타일에 전달된 값을 수정합니다.
.style("fill", this.visualSettings.circle.circleColor.value.value).style("stroke-width", this.visualSettings.circle.circleThickness.value)
visual.ts파일을 저장합니다.PowerShell에서 시각적 개체를 시작합니다.
pbiviz startPower BI의 시각적 개체 위에서 움직이는 도구 모음에서 자동 다시 로드 토글을 선택합니다.

시각적 개체 서식 옵션에서 원을 확장합니다.
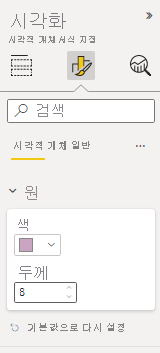
색 및 두께 옵션을 수정합니다.
두께 옵션을 0보다 작은 값과 10보다 큰 값으로 수정합니다. 그런 다음, 시각적 개체가 값을 허용 가능한 최솟값 또는 최댓값으로 업데이트하는지 확인합니다.
디버깅
사용자 지정 시각적 개체의 디버깅에 대한 팁은 디버깅 가이드를 을 참조하세요.
사용자 지정 시각적 개체 패키지
이제 시각적 개체를 완성하고 사용할 준비가 되었으므로 패키징해야 합니다. 다른 사용자가 유용하게 사용할 수 있도록 패키징된 시각적 개체를 Power BI 보고서 또는 서비스로 가져올 수 있습니다.
시각적 개체가 준비되면 Power BI 시각적 개체 패키지의 지침을 따르고, 원하는 경우 다른 사용자가 가져오기를 통해 사용할 수 있도록 공유하세요.