Build a basic model-driven app
A model-driven app consists of several components that you select by using the App Designer. Components and component properties become the metadata. Let's look more closely at these components.
Model-driven app components
Data
The table shows the different data components that can make up a model-driven app, which can determine what data the app is based upon.
| Component | Description |
|---|---|
| Table | Tables are items with properties that you track. Examples include contacts and accounts. Many standard tables are available. You can customize a nonsystem standard table (or production table). You can also create a custom table from scratch. |
| Column | Columns are properties that are associated with a table and help define that table. A column is defined by a data type, which determines the type of data that can be entered or selected. Examples of data types include text, number, date and time, currency, and lookup (which creates a relationship with another table). Columns are typically used in forms, views, and searches. |
| Relationship | Relationships define how tables can be related to each other. There are 1:N (one-to-many), N:1 (many-to-one), and N:N (many-to-many) relationships. For example, adding a lookup column to a table creates a new 1:N relationship between the two tables and lets you add that lookup column to a form. |
| Choice | This type of column shows a control that lets the user select among predefined options. Each option has a number value and a label. Choice columns can require either a single value or multiple values. |
User interface
The table shows the user interface components, which determine how users interact with the app and what designer is used to create or edit the component.
| Component | Description |
|---|---|
| App | Apps determine the app fundamentals, like components, properties, the client type, and the URL. |
| Site map | A site map specifies the navigation for your app. |
| Form | Forms include a set of data entry columns for a given table. A form can be used to create a new data row or edit an existing one. |
| View | Views define how a list of rows for a specific table appears in your app. A view defines the columns shown, the width of each column, the sorting behavior, and the default filters. |
Logic
The logic components determine what business processes, rules, and automation the app has. Microsoft Power Apps makers use a designer that is specific to the type of process or rule they need.
| Type of logic | Description |
|---|---|
| Business process flow | Business process flows walk users through a standard business process. Use a business process flow if you want everyone to handle customer service requests the same way. Or you can use a business process flow to require staff to gain approval for an invoice before submitting an order. |
| Business rule | Business rules apply rules or recommendation logic to a form to set field requirements, hide or show fields, validate data, and more. App designers use a simple interface to implement and maintain fast-changing and commonly used rules. |
| Flows | Power Automate is a cloud-based service that lets you create automated workflows between apps and services to get notifications, sync files, collect data, and more. |
Visualization
The visualization components determine what type of data and reporting the app shows and which designer is used to create or edit that component.
| Component | Description |
|---|---|
| Chart | Charts are individual graphical visualizations that can appear in a view or a form or that can be added to a dashboard. |
| Dashboard | Dashboards show one or more graphical visualizations in one place that provide an overview of actionable business data. |
| Embedded Microsoft Power BI | Power BI adds embedded Power BI tiles and dashboards to your app. Power BI is a cloud-based service that provides business intelligence (BI) insight. |
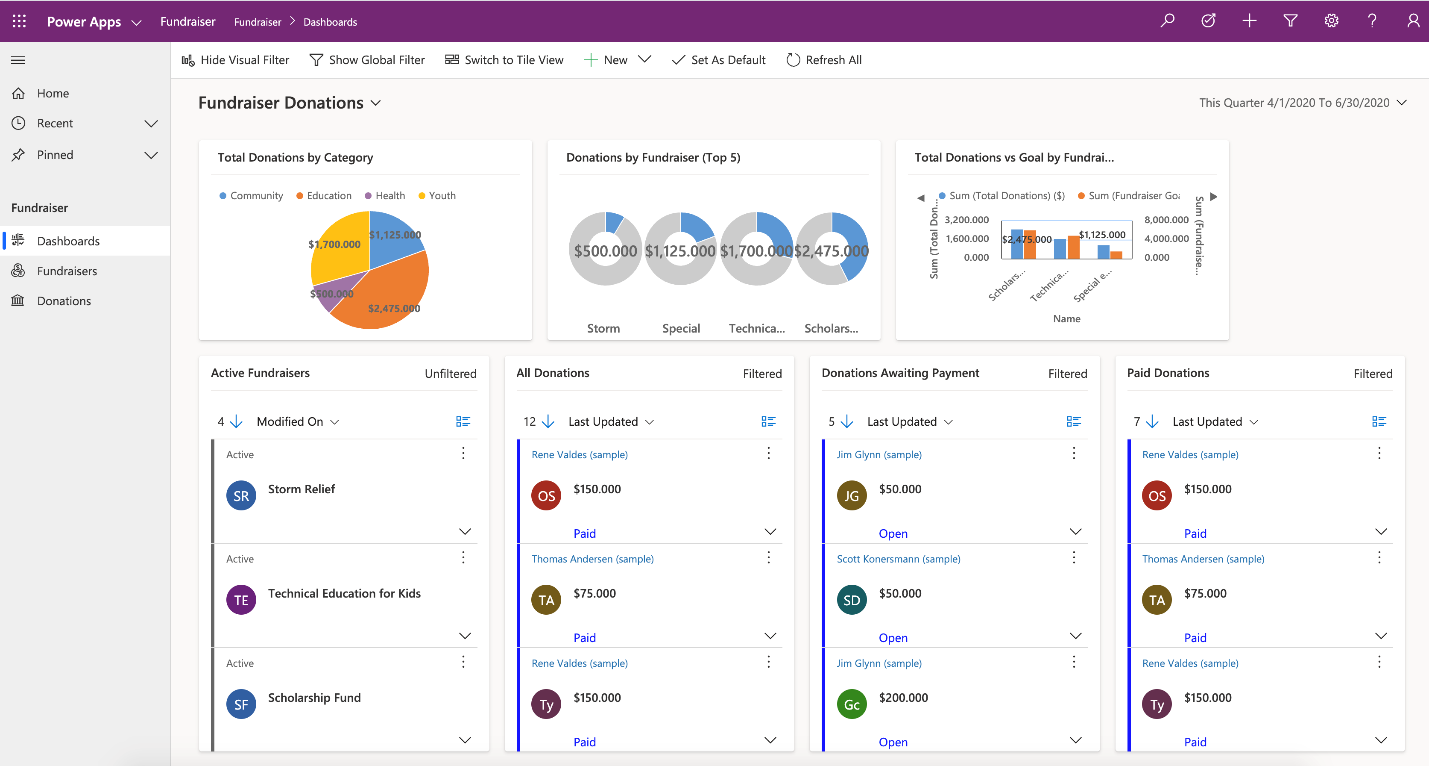
Some examples of visualizations in a model-driven app:

Building model-driven apps
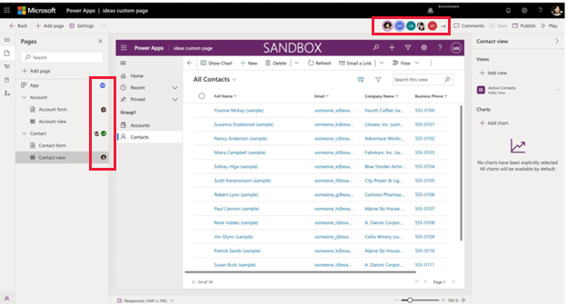
Model-driven apps are built using the App designer. It’s a simplified user interface that allows you to specify which tables the app is based on and which visual elements should be included. Let’s look at the App Designer for one of the available sample model-driven apps called "Fundraiser."
This application includes two Dataverse tables: Donation and Fundraiser.

Once you define the tables for your app, you need to define the visual elements that are used to present the data to users. For each table, you need to specify the following information:
Forms – Defines how users see and interact with individual records.
Views – Defines how lists of rows are presented for each table. For example, you might create a view to display a list of all active fundraisers.
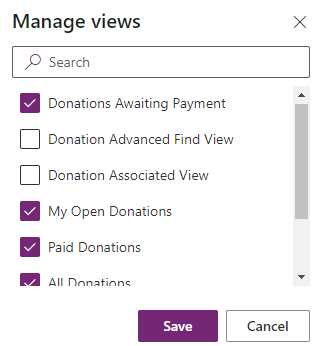
You can specify which specific forms or views to include for a table by selecting either the table form or view and choosing either Manage forms or Manage Views.
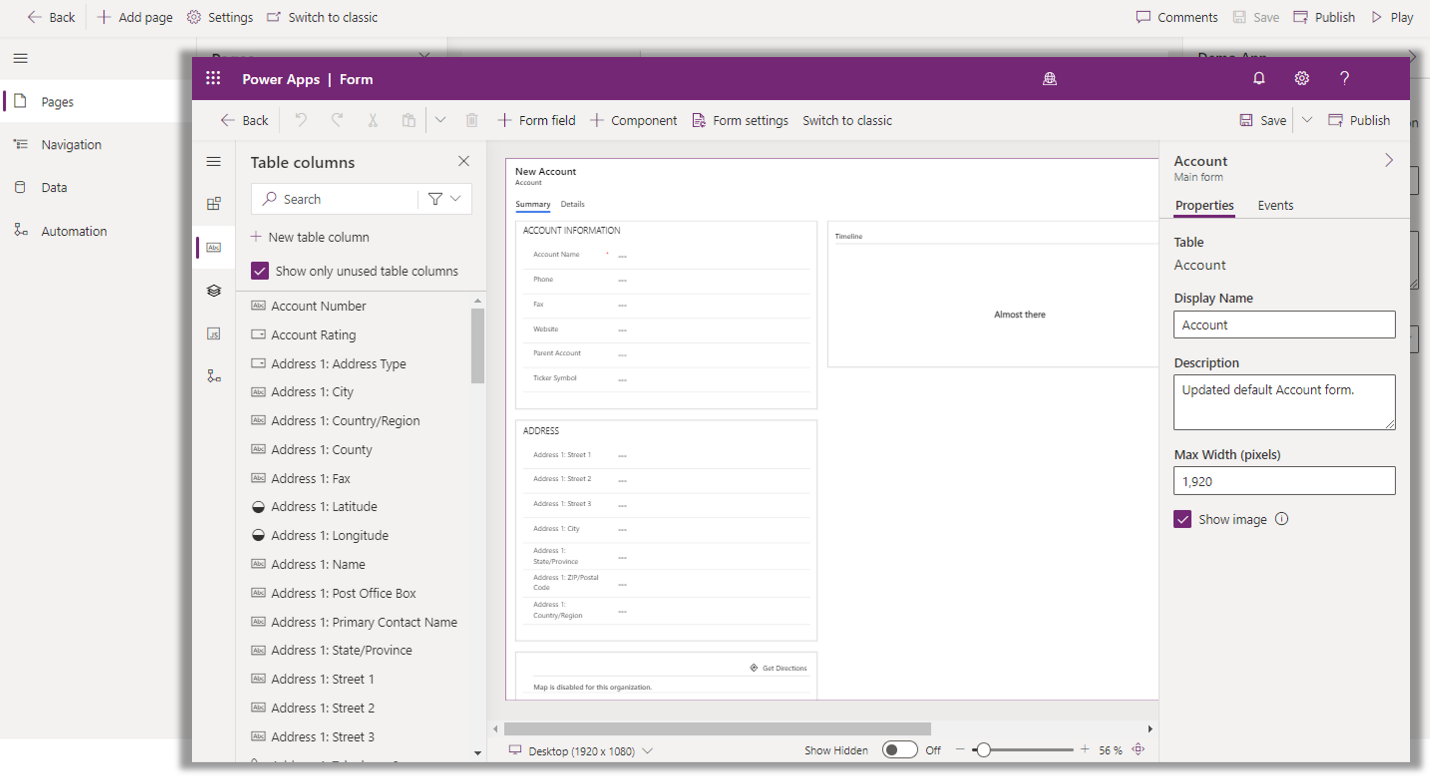
For example, the Account table in Dataverse includes all the columns defined for it. However, the data might not be relevant for each of your model driven applications. Let’s say that an organization created two model driven applications: Fundraiser and Innovation. In the fundraiser application, you would likely need details related to fundraising efforts such as an account’s tax exemption status. However, it’s likely that in the innovation application, you wouldn't need that need that data. As a result, you would typically have two different account forms. One for the fundraising app with the tax exemption status details, and another for the innovation app without those fields.

It's possible to include multiple forms and views per table. In the screenshot, we're including multiple views to help manage donations. Only the selected forms are displayed. However, if you don't select any view or forms, the system assumes that all items should be included in your app.
Add new content to an application
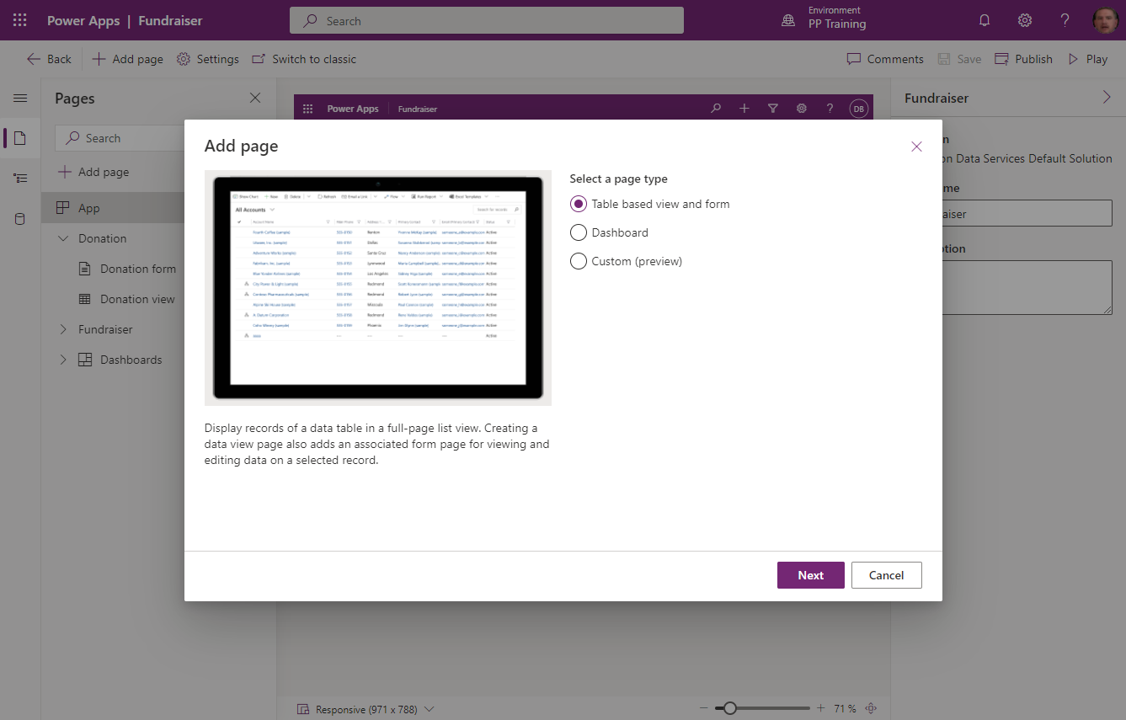
New content is added to the application by selecting the Add page button. When you add a new page, you specify which type of page you want to use.
There are several options to choose from:
Table-based form and view: Allows you to display records of table in a full-page list view. Forms associated with that table are also included.
Dashboard: Allows you to displays charts and tables from multiple entities to visualize data on a single page. Multiple dashboards can be added to a model application.
URL: Allows you to add a URL to the application navigation.
Web resource: Allows you to display a web resource inside a page. Web resources are files created by developers that extend the functionality of an app.
Custom: Allows you to design and build the type of page you want by dragging interactive components into the canvas.
Testing the application
By selecting the Play button on the top right, the app is put into Play mode. You can see the app that displays data based on the choices made in the design process.
Throughout this unit, we talked about how individuals can create model-driven applications in Power Apps. Many times, application building isn't being done by just one individual. Power Apps coauthoring feature allows makers to edit model-driven applications together in real time. The ability to coauthor can dramatically reduce the amount of time it takes organizations to build applications.