Optimize monitoring costs for Container insights
Kubernetes clusters generate a large amount of data that's collected by Container insights. Since you're charged for the ingestion and retention of this data, you want to configure your environment to optimize your costs. You can significantly reduce your monitoring costs by filtering out data that you don't need and also by optimizing the configuration of the Log Analytics workspace where you're storing your data.
Once you've analyzed your collected data and determined if there's any data that you're collecting that you don't require, there are several options to filter any data that you don't want to collect. This ranges from selecting from a set of predefined cost configurations to leveraging different features to filter data based on specific criteria. This article provides a walkthrough of guidance on how to analyze and optimize your data collection for Container insights.
Analyze your data ingestion
To identify your best opportunities for cost savings, analyze the amount of data being collected in different tables. This information will help you identify which tables are consuming the most data and help you make informed decisions about how to reduce costs.
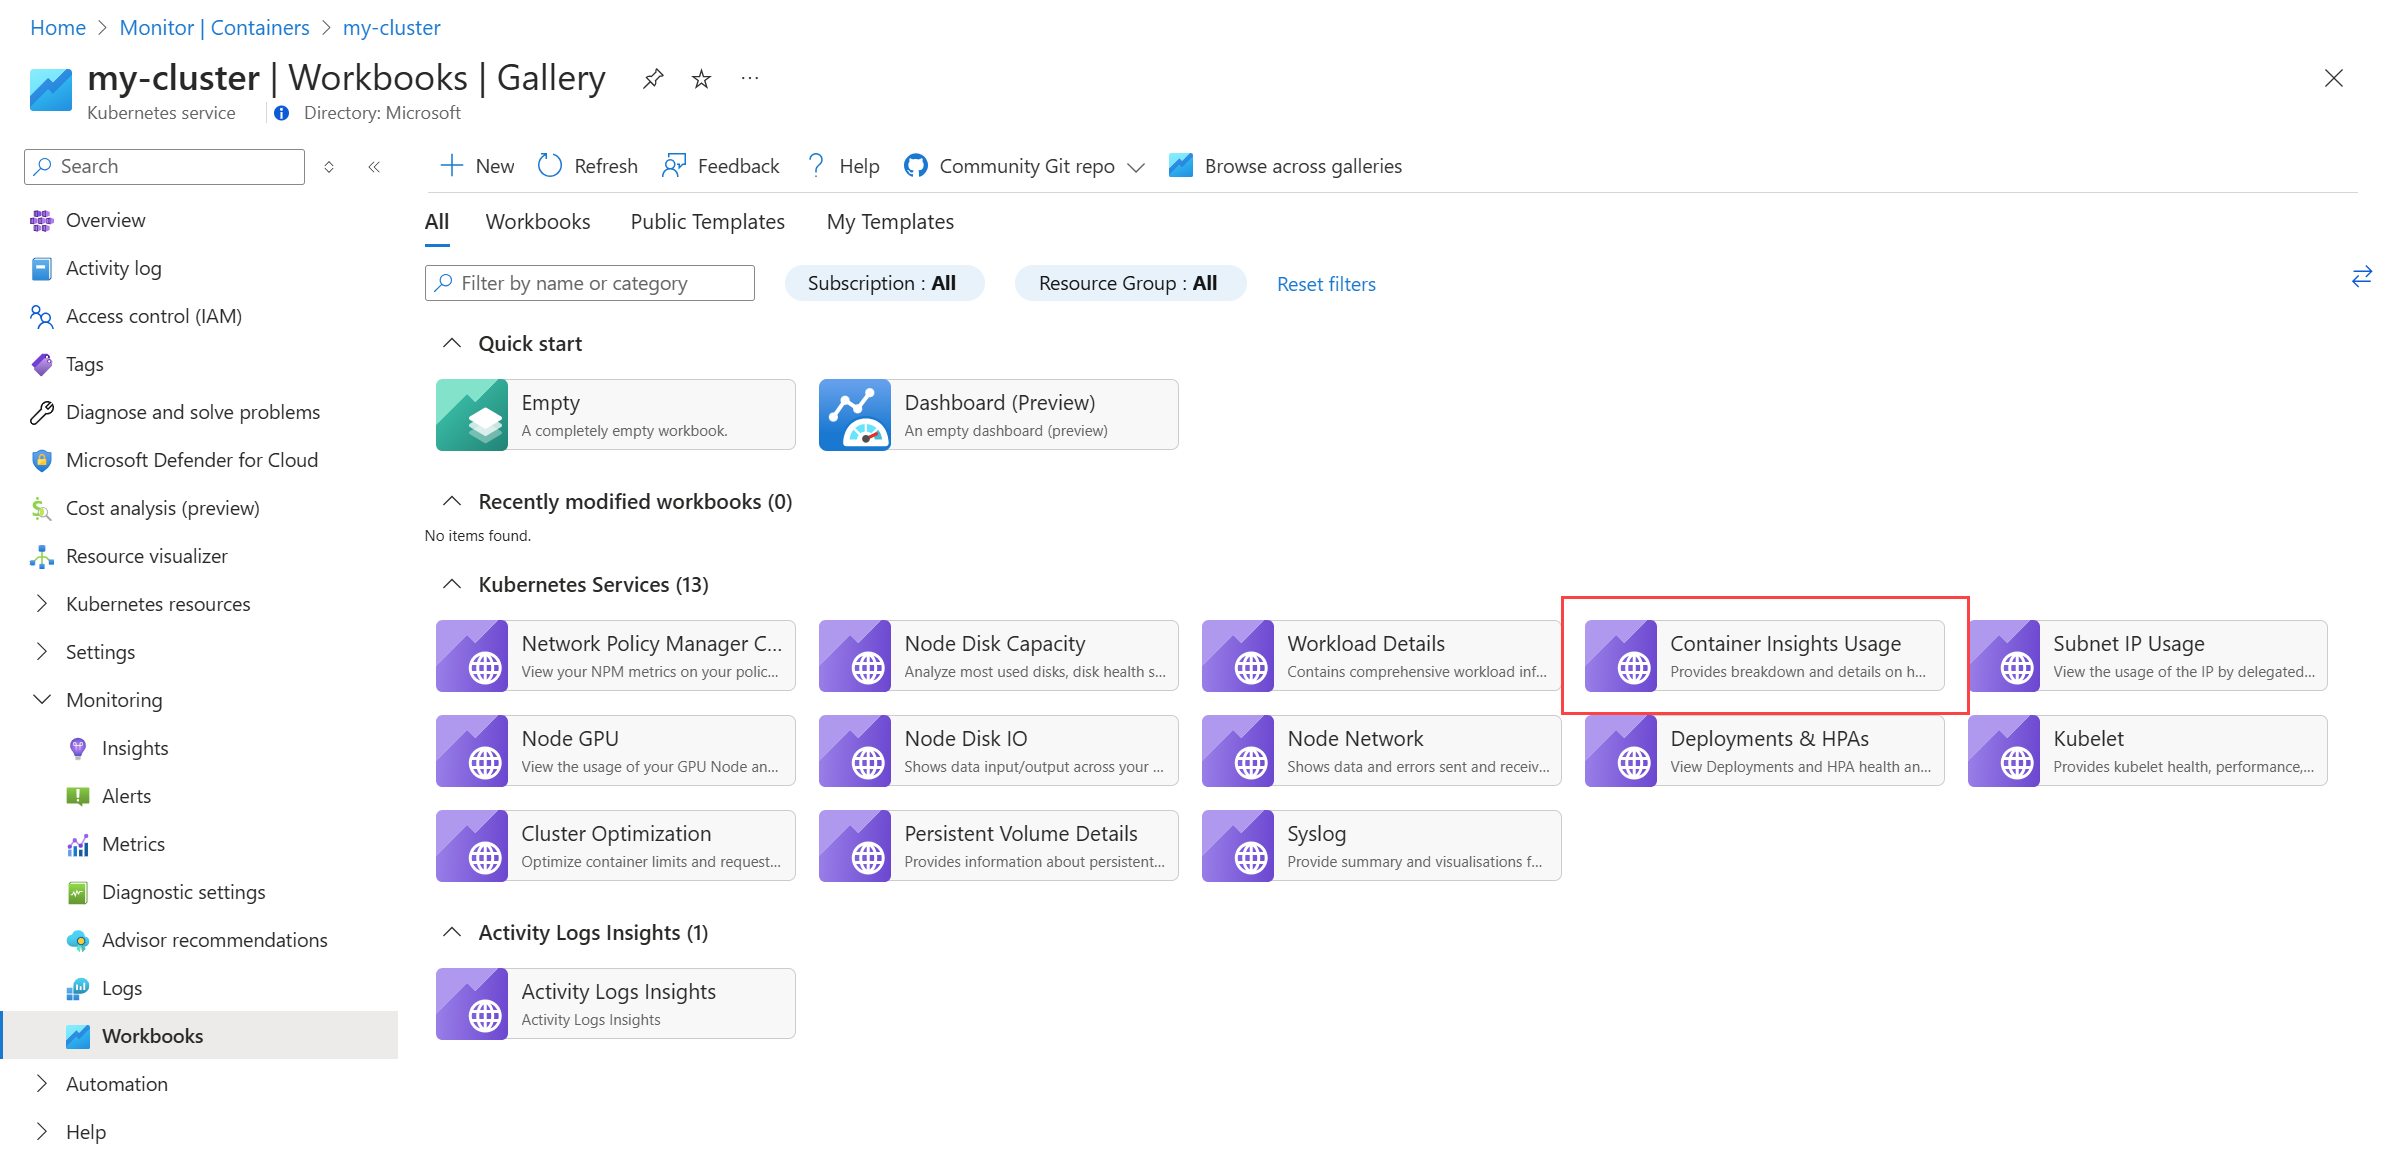
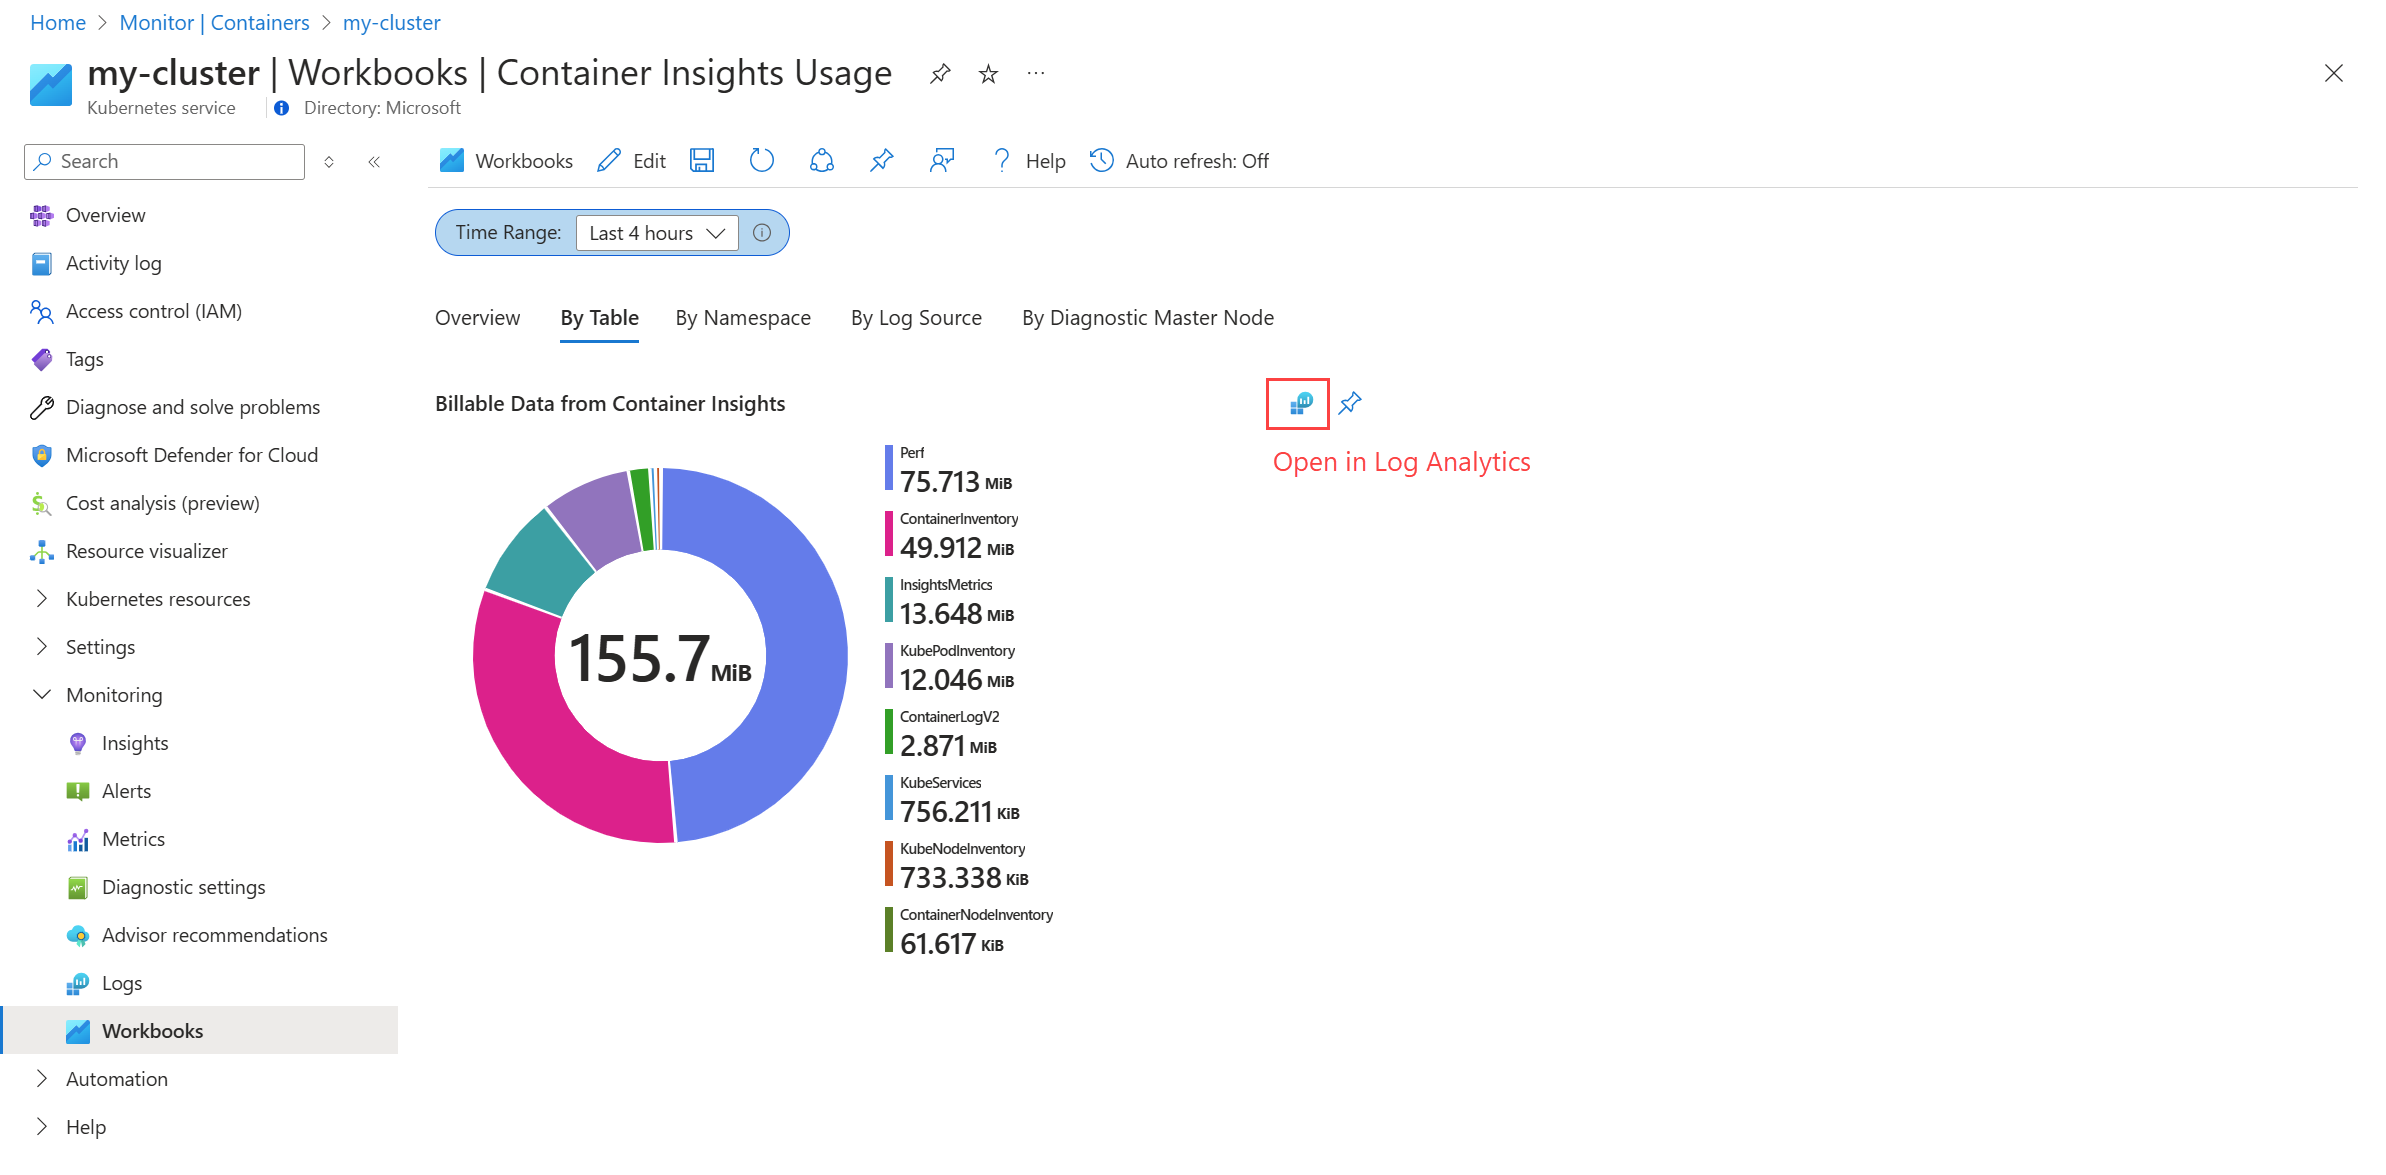
You can visualize how much data is ingested in each workspace by using the Container Insights Usage runbook, which is available from the Workspace page of a monitored cluster.
The report will let you view the data usage by different categories such as table, namespace, and log source. Use these different views to determine any data that you're not using and can be filtered out to reduce costs.
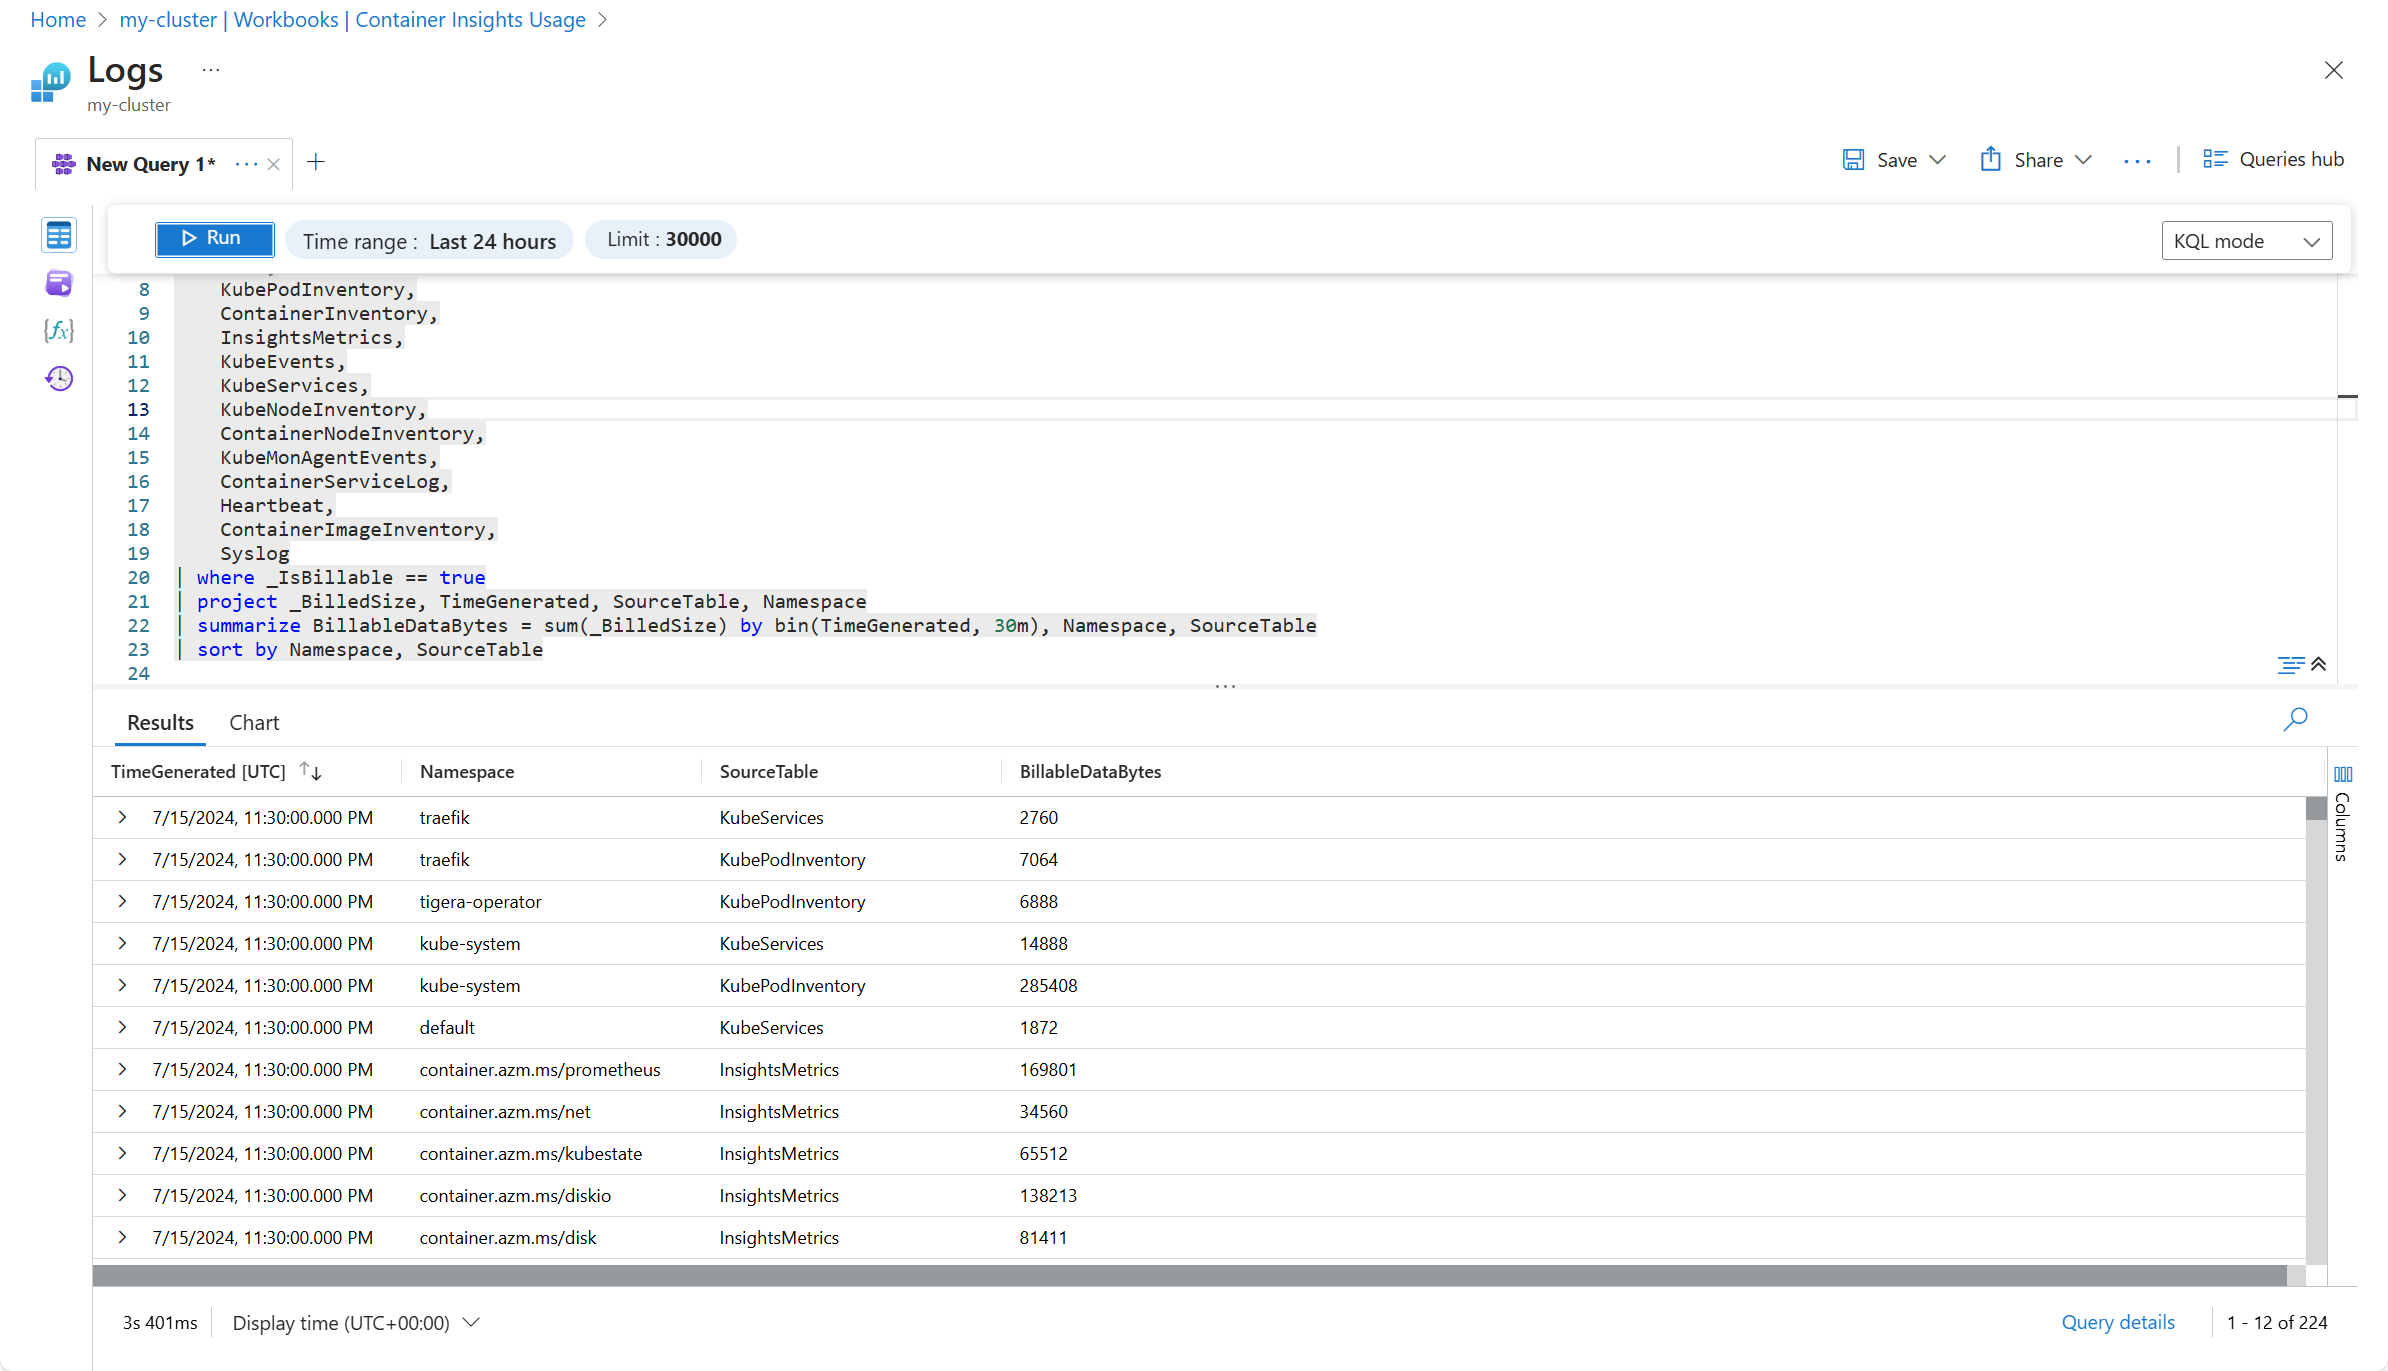
Select the option to open the query in Log Analytics where you can perform more detailed analysis including viewing the individual records being collected. See Query logs from Container insights for additional queries you can use to analyze your collected data.
For example, the following screenshot shows a modification to the log query used for By Table that shows the data by namespace and table.
Filter collected data
Once you've identified data that you can filter, use different configuration options in Container insights to filter out data that you don't require. Options are available to select predefined configurations, set individual parameters, and use custom log queries for detailed filtering.
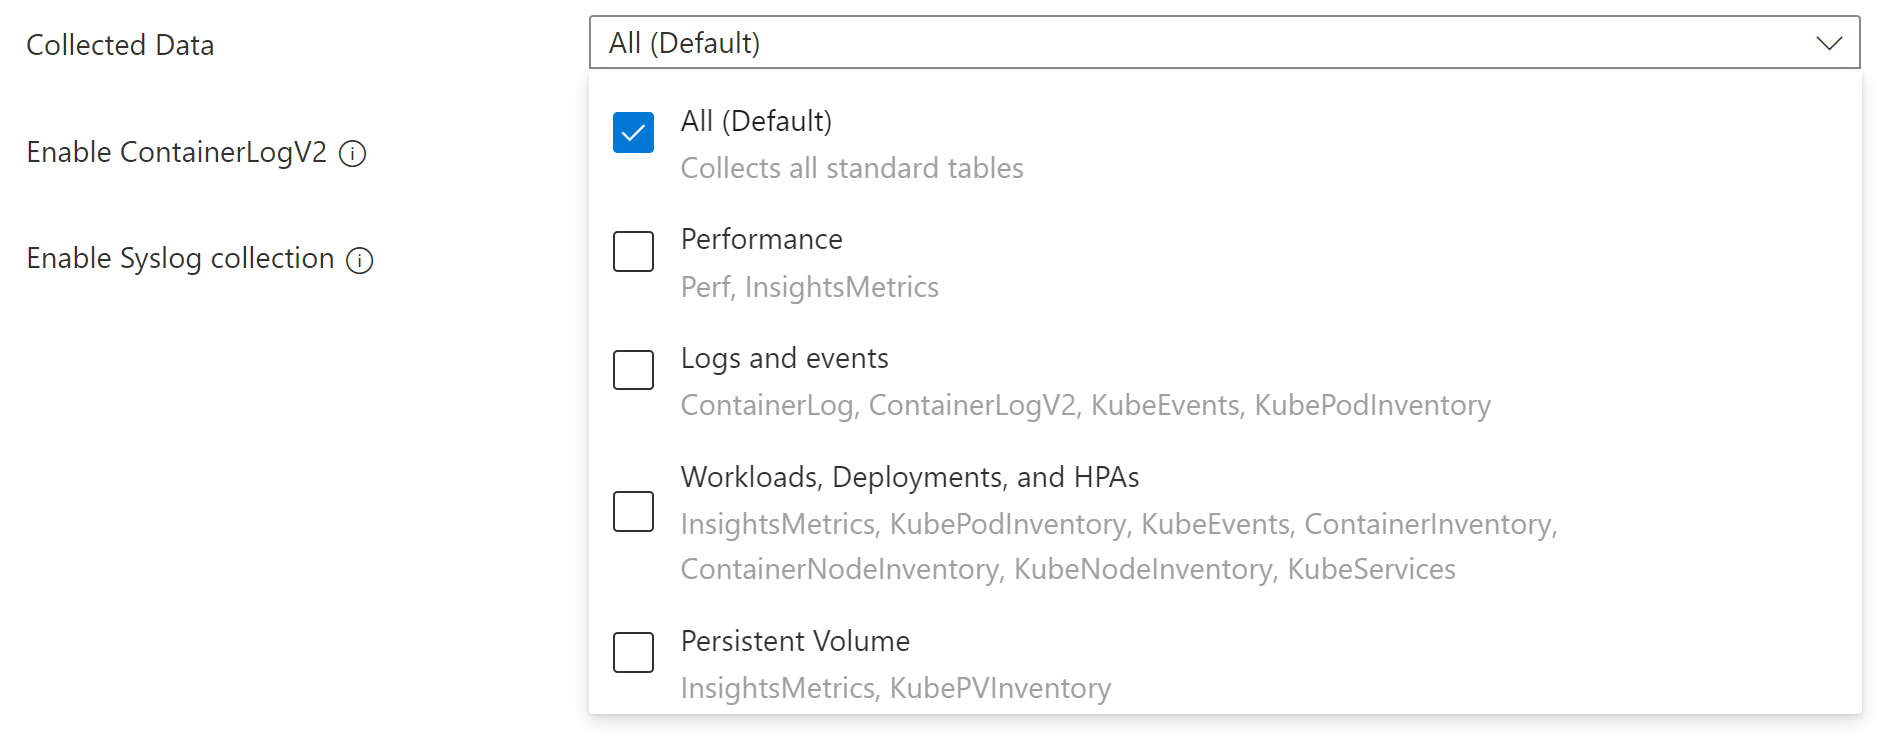
Cost presets
The simplest way to filter data is using the cost presets in the Azure portal. Each preset includes different sets of tables to collect based on different operation and cost profiles. The cost presets are designed to help you quickly configure your data collection based on common scenarios.
Tip
If you've configured your cluster to use the Prometheus experience for Container insights, then you can disable Performance collection since performance data is being collected by Prometheus.
For details on selecting a cost preset, see Configure DCR with Azure portal
Filtering options
After you've chosen an appropriate cost preset, you can filter additional data using the different methods in the following table. Each option will allow you to filter data based on different criteria. When you're done with your configuration, you should only be collecting data that you require for analysis and alerting.
| Filter by | Description |
|---|---|
| Tables | Manually modify the DCR if you want to select individual tables to populate other than the cost preset groups. For example, you may want to collect ContainerLogV2 but not collect KubeEvents which is included in the same cost preset. See Stream values in DCR for a list of the streams to use in the DCR and use the guidance in . |
| Container logs | ContainerLogV2 stores the stdout/stderr records generated by the containers in the cluster. While you can disable collection of the entire table using the DCR, you can configure the collection of stderr and stdout logs separately using the ConfigMap for the cluster. Since stdout and stderr settings can be configured separately, you can choose to enable one and not the other.See Filter container logs for details on filtering container logs. |
| Namespace | Namespaces in Kubernetes are used to group resources within a cluster. You can filter out data from resources in specific namespaces that you don't require. Using the DCR, you can only filter performance data by namespace, if you've enabled collection for the Perf table. Use ConfigMap to filter data for particular namespaces in stdout and stderr logs.See Filter container logs for details on filtering logs by namespace and Platform log filtering (System Kubernetes Namespaces) for details on the system namespace. |
| Pods and containers | Annotation filtering allows you to filter out container logs based on annotations that you make to the pod. Using the ConfigMap you can specify whether stdout and stderr logs should be collected for individual pods and containers. See Annotation based filtering for workloads for details on updating your ConfigMap and on setting annotations in your pods. |
Transformations
Ingestion time transformations allow you to apply a KQL query to filter and transform data in the Azure Monitor pipeline before it's stored in the Log Analytics workspace. This allows you to filter data based on criteria that you can't perform with the other options.
For example, you may choose to filter container logs based on the log level in ContainerLogV2. You could add a transformation to your Container insights DCR that would perform the functionality in the following diagram. In this example, only error and critical level events are collected, while any other events are ignored.
An alternate strategy would be to save the less important events to a separate table configured for basic logs. The events would still be available for troubleshooting, but with a significant cost savings for data ingestion.
See Data transformations in Container insights for details on adding a transformation to your Container insights DCR including sample DCRs using transformations.
Configure pricing tiers
Basic Logs in Azure Monitor offer a significant cost discount for ingestion of data in your Log Analytics workspace for data that you occasionally use for debugging and troubleshooting. Tables configured for basic logs offer a significant cost discount for data ingestion in exchange for a cost for log queries meaning that they're ideal for data that you require but that you access infrequently.
ContainerLogV2 can be configured for basic logs which can give you significant cost savings if you query the data infrequently. Using transformations, you can specify data that should be sent to alternate tables configured for basic logs. See Data transformations in Container insights for an example of this strategy.
Next steps
To help you understand what the costs are likely to be based on recent usage patterns from data collected with Container insights, see Analyze usage in a Log Analytics workspace.


