Usage examples for Azure Data Explorer connector to Power Automate
The Azure Data Explorer Power Automate (previously Microsoft flow) connector allows Azure Data Explorer to use the flow capabilities of Microsoft Power Automate. You can run Kusto queries and commands automatically, as part of a scheduled or triggered task. This article includes several common Power Automate connector usage examples.
For more information, see Azure Data Explorer Power Automate connector.
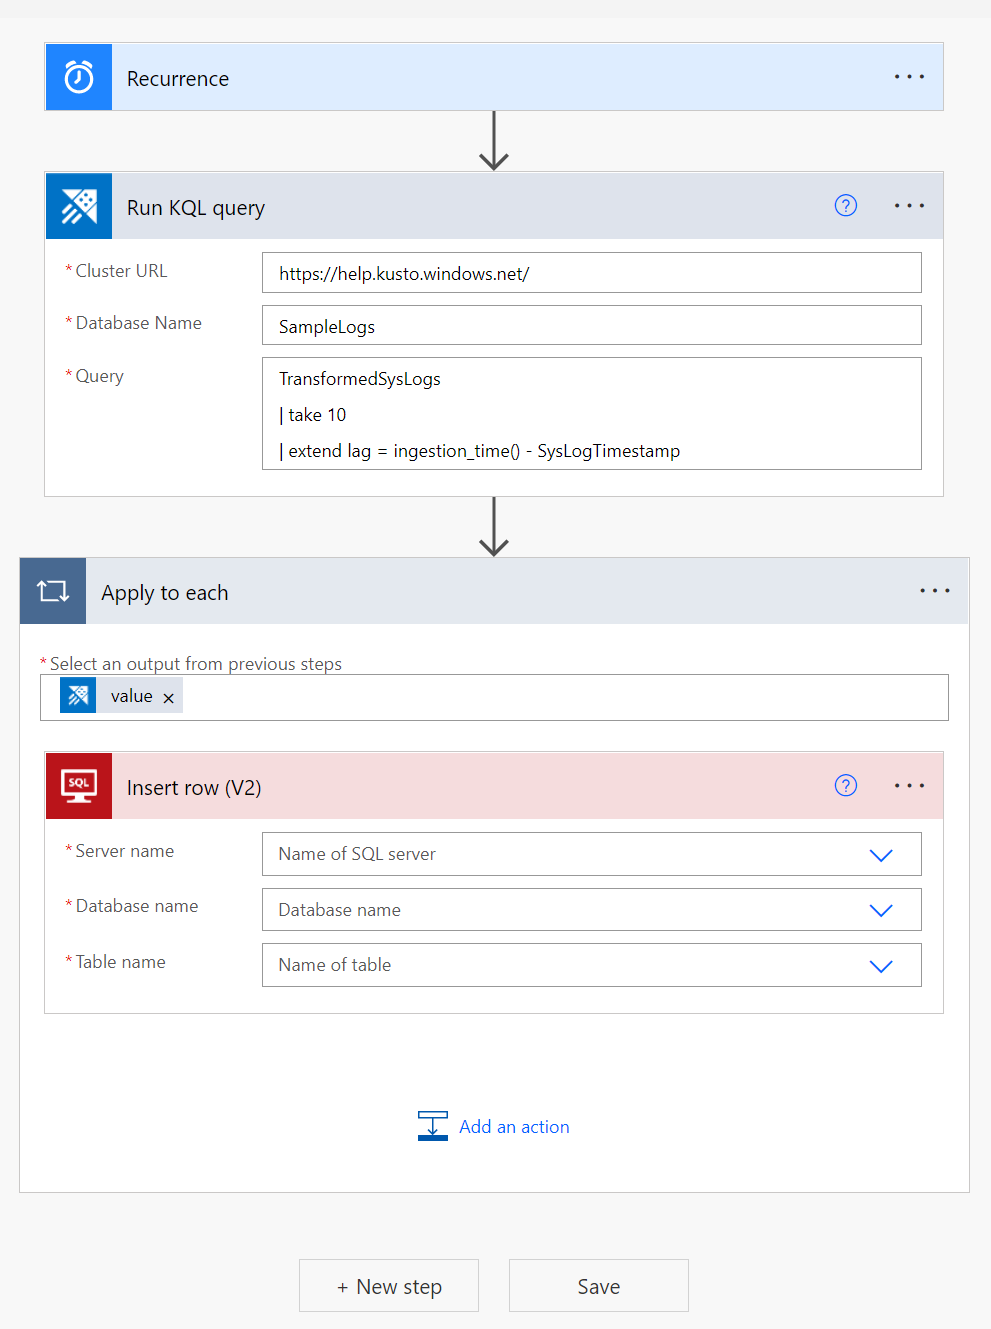
Power Automate connector and your SQL database
Use the Power Automate connector to query your data and aggregate it in an SQL database.
Note
Only use the Power Automate connector for small amounts of output data. The SQL insert operation is done separately for each row.
Push data to a Microsoft Power BI dataset
You can use the Power Automate connector with the Power BI connector to push data from Kusto queries to Power BI streaming datasets.
Create a new Run query and list results action.
Select New step.
Select Add an action, and search for Power BI.
Select Power BI > Add rows to a dataset.
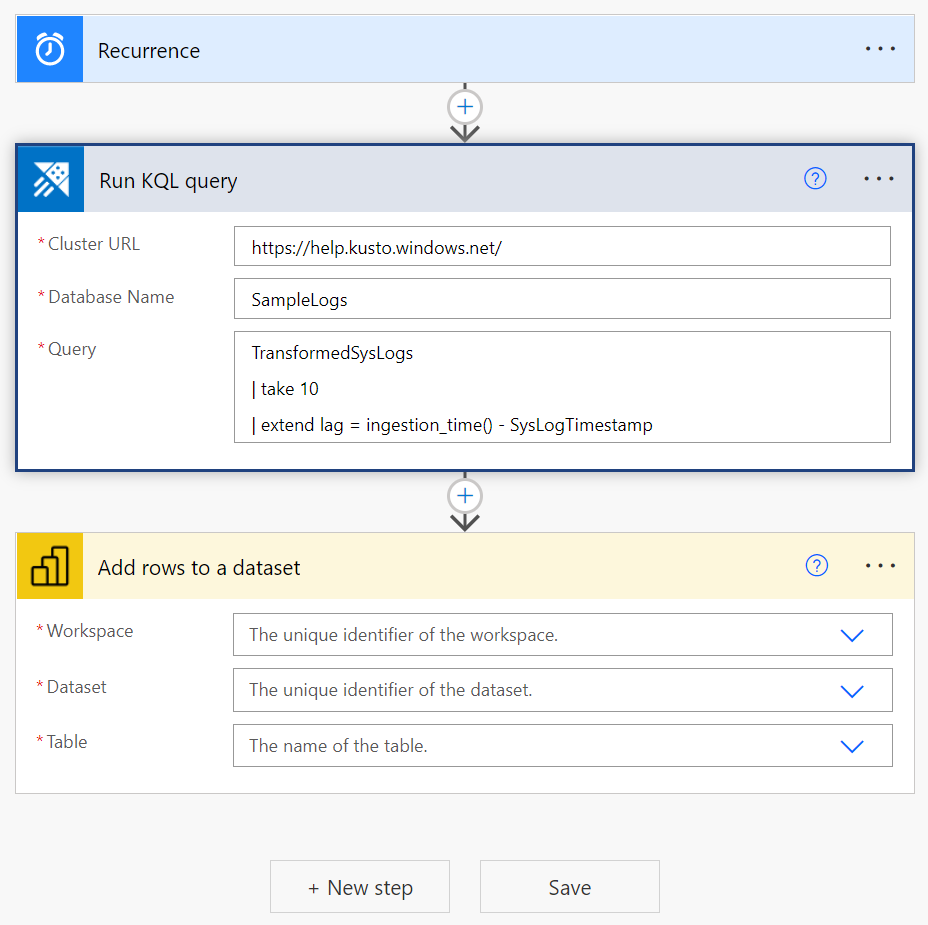
Enter the Workspace, Dataset, and Table to which data will be pushed.
From the dynamic content dialog box, add a Payload that contains your dataset schema and the relevant Kusto query results.
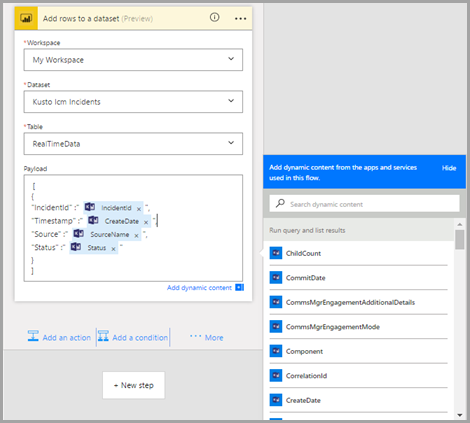
The flow automatically applies the Power BI action for each row of the Kusto query result table.
Conditional queries
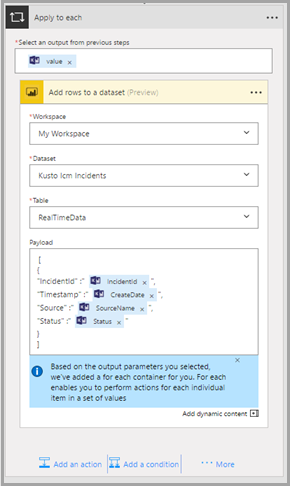
You can use the results of Kusto queries as input or conditions for the next Power Automate actions.
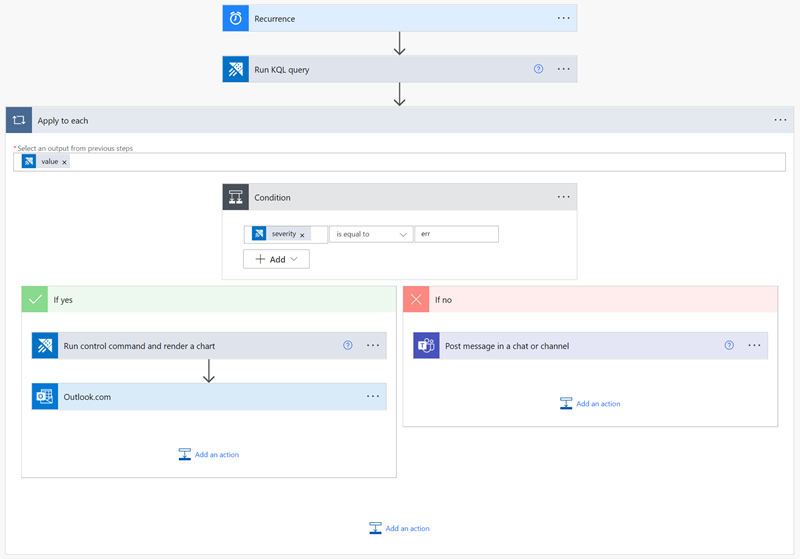
In the following example, we query Kusto for incidents that occurred during the last day. For each resolved incident, a Slack message is posted and a push notification is created. For each incident that is still active, we query Kusto for more information about similar incidents. It sends that information as an email, and opens a related task in Azure DevOps Server.
Follow these instructions to create a similar flow:
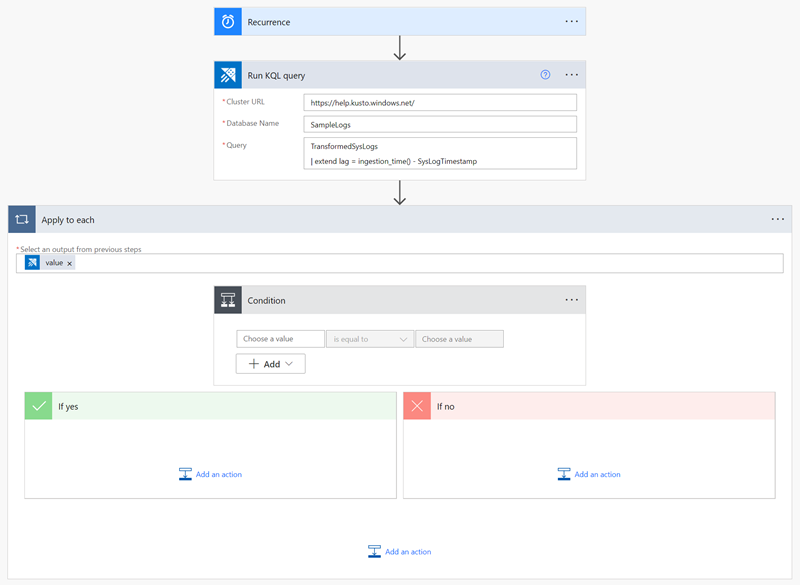
Create a new Run query and list results action.
Select New step > Condition control.
From the dynamic content window, select the parameter you want to use as a condition for the next actions.
Select the type of Relationship and Value to set a specific condition on the particular parameter.
The flow applies this condition on each row of the query result table.
Add actions for when the condition is true and false.
You can use the result values from the Kusto query as input for the next actions. Select the result values from the dynamic content window. In the following example, we add a Slack - Post Message action and a Visual Studio - Create a new work item action, containing data from the Kusto query.
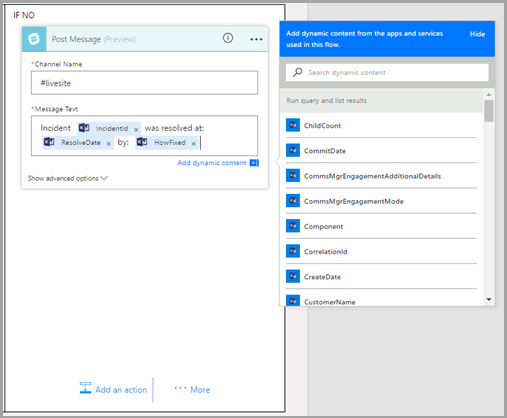
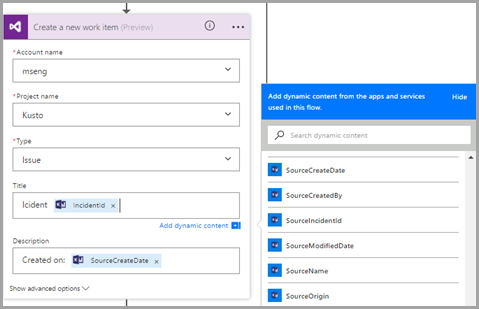
In this example, if an incident is still active, query Kusto again to get information about how incidents from the same source were solved in the past.
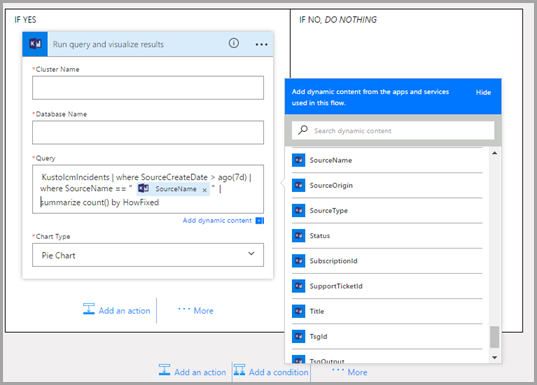
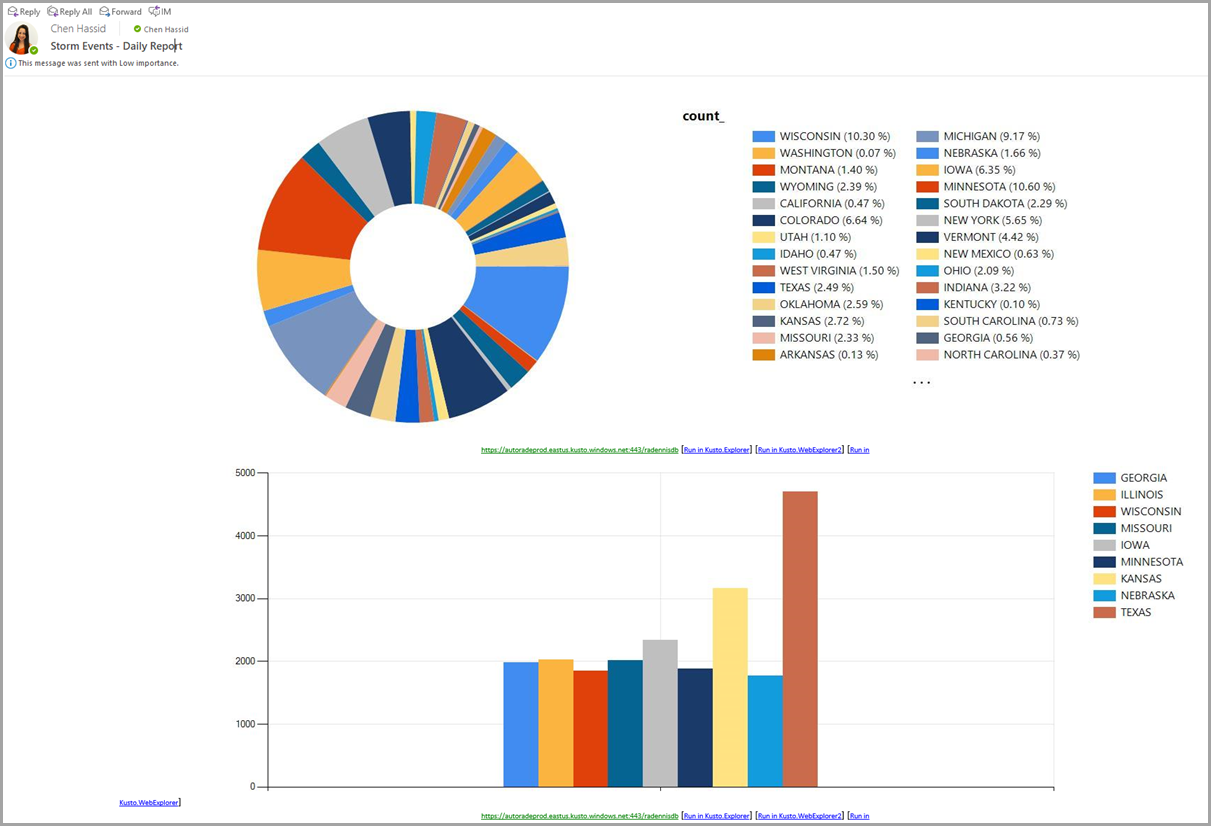
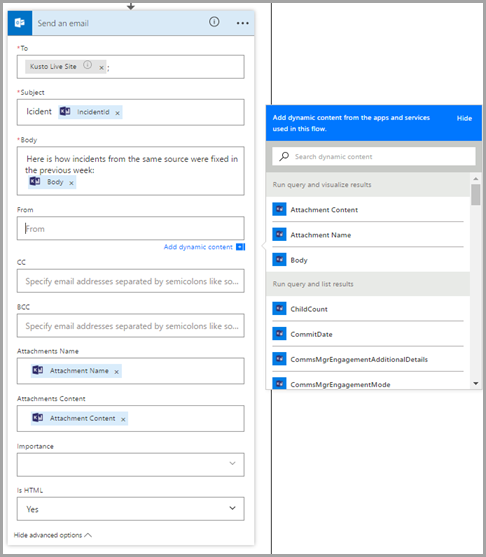
Visualize this information as a pie chart, and email it to the team.
Email multiple Azure Data Explorer flow charts
Create a new flow with the recurrence trigger, and define the interval and frequency of the flow.
Add a new step, with one or more Kusto - Run query and visualize results actions.
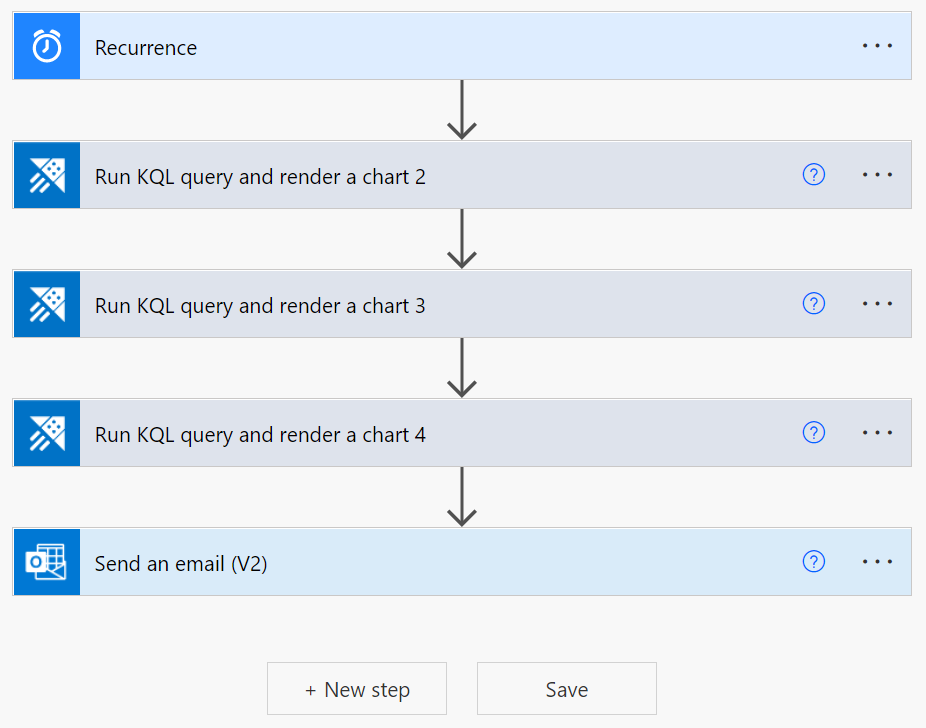
For each Kusto - Run query and visualize result action, define the following fields:
- Cluster URL.
- Database Name.
- Query and Chart Type (for example, HTML table, pie chart, time chart, bar chart, or a custom value).

Add a Send an email (v2) action:
- In the body section, select the code view icon.
- In the Body field, insert the required BodyHtml so that the visualized result of the query is included in the body of the email.
- To add an attachment to the email, add Attachment Name and Attachment Content.
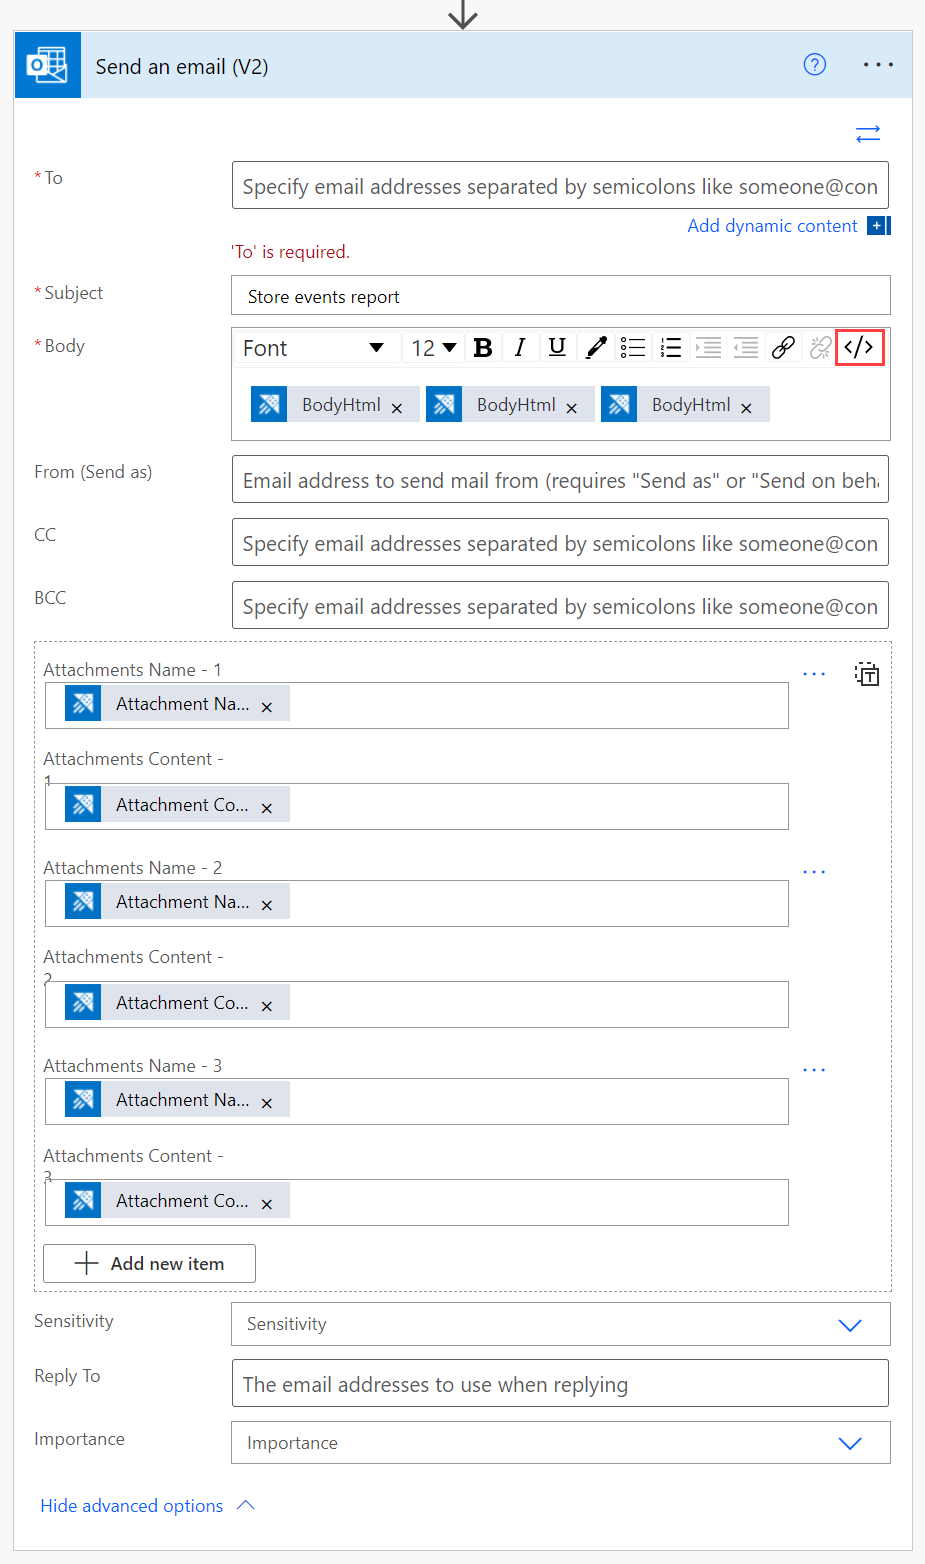
For more information about creating an email action, see Email Kusto query results.
Results:
Related content
- Use the Azure Kusto Logic App connector to run Kusto queries and commands as part of a scheduled or triggered task.
