User entity page in Microsoft Defender
The user entity page in the Microsoft Defender portal helps you in your investigation of user entities. The page contains all the important information about a given user entity. If an alert or incident indicates that a user might be compromised or is suspicious, check and investigate the user entity.
You can find user entity information in the following views:
- Identities page, under Assets
- Alerts queue
- Any individual alert/incident
- Devices page
- Any individual device entity page
- Activity log
- Advanced hunting queries
- Action center
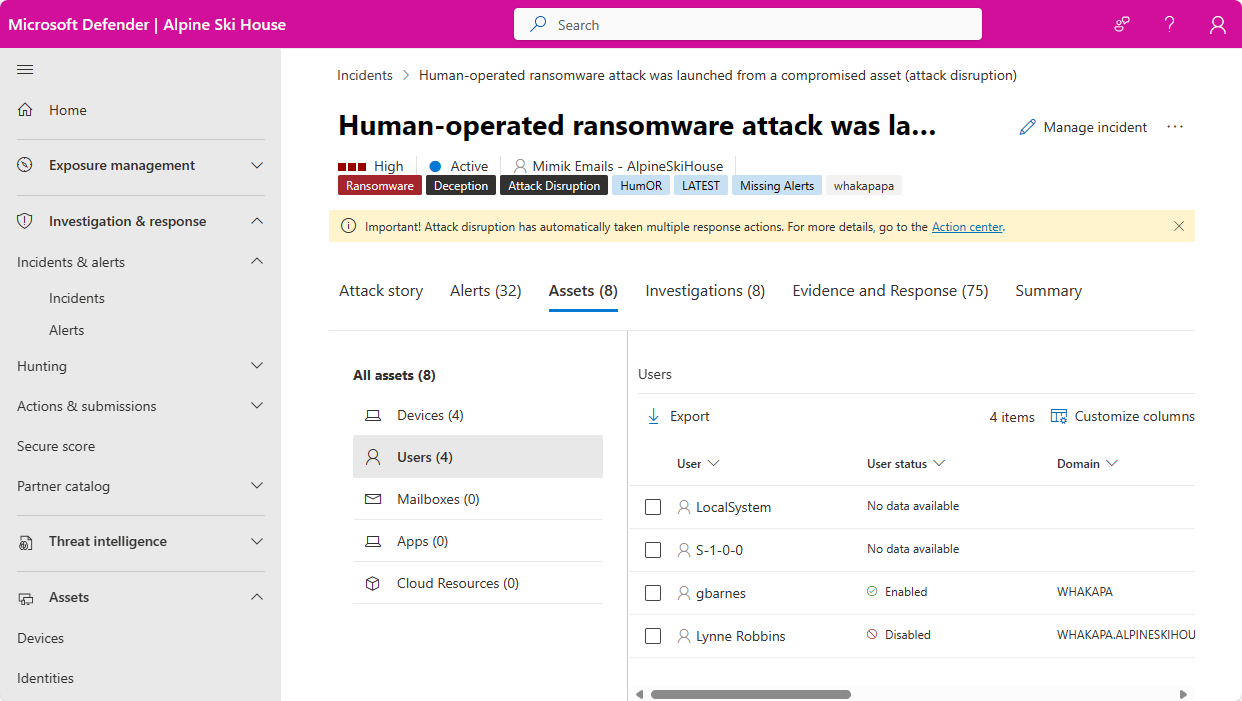
Wherever user entities appear in these views, select the entity to view the User page, which displays more details about the user. For example, you can see the details of user accounts identified in the alerts of an incident in the Microsoft Defender portal at Incidents & alerts > Incidents > incident > Assets > Users.
When you investigate a specific user entity, you see the following tabs on its entity page:
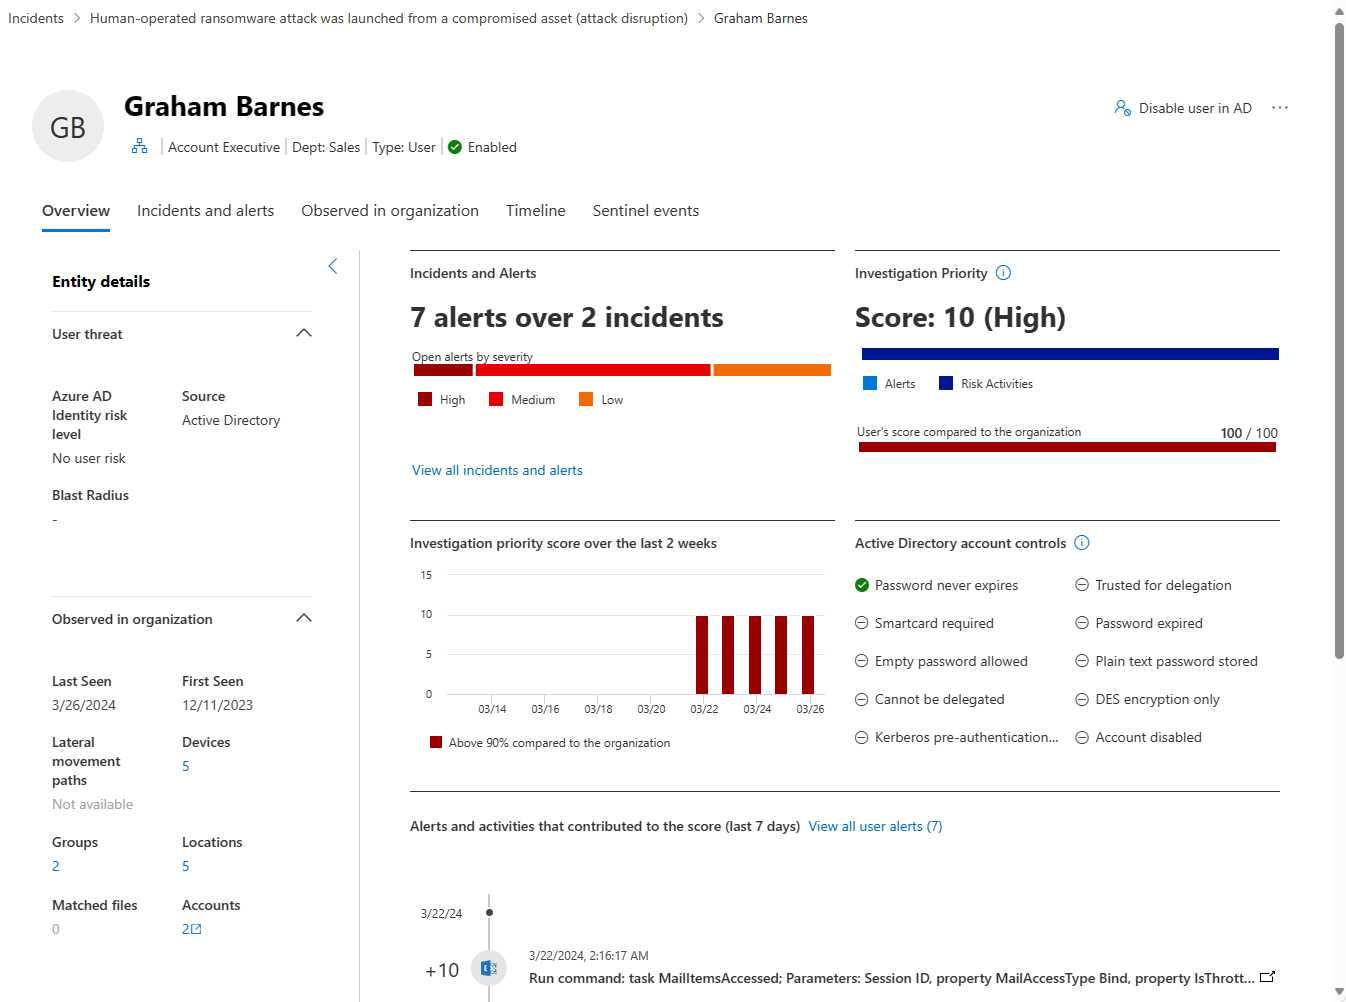
- Overview, including entity details, incidents and alerts visual view, investigation priority, and scored timeline
- Incidents and alerts tab
- Observed in organization tab
- Timeline tab
- Sentinel events tab
The user page shows the Microsoft Entra organization as well as groups, helping you understand the groups and permissions associated with a user.
Important
Microsoft Sentinel is now generally available within the Microsoft unified security operations platform in the Microsoft Defender portal. For more information, see Microsoft Sentinel in the Microsoft Defender portal.
Overview
Entity details
The Entity details panel on the left side of the page provides information about the user, such as the Microsoft Entra identity risk level, the insider risk severity level (Preview), the number of devices the user is signed in to, when the user was first and last seen, the user's accounts, groups that the user belongs to, contact information, and more. You see other details depending on the integration features you enabled.
Note
(Preview) Microsoft Defender XDR users with access to Microsoft Purview Insider Risk Management can now see a user's insider risk severity and gain insights on a user's suspicious activities in the user page. Select the insider risk severity under Entity details to see the risk insights about the user.
Visual view of incidents and alerts
This card includes all incidents and alerts associated with the user entity, grouped by severity.
Investigation priority
This card includes the user entity's calculated investigation priority score breakdown, and a two-week trend for that score, including the percentile of the score in relation to the tenant.
Active directory account controls
This card surfaces Microsoft Defender for Identity security settings that may need your attention. You can see important flags about the user's account settings, such as if the user can press enter to bypass the password, and if the user has a password that never expires, etc.
For more information, see User Account Control flags.
Scored activities
This card includes all activities and alerts contributing to the entity's investigation priority score over the last seven days.
Organization tree
This section shows the user entity's place in the organizational hierarchy as reported by Microsoft Defender for Identity.
Account tags
Microsoft Defender for Identity pulls tags out of Active Directory to give you a single interface for monitoring your Active Directory users and entities. Tags provide you with details from Active Directory about the entity, and include:
| Name | Description |
|---|---|
| New | Indicates that the entity was created less than 30 days ago. |
| Deleted | Indicates that the entity was permanently deleted from Active Directory. |
| Disabled | Indicates that the entity is currently disabled in Active Directory. The disabled attribute is an Active Directory flag that's available for user accounts, computer accounts, and other objects to indicate that the object is not currently in use. When an object is disabled, it can't be used to sign in or perform actions in the domain. |
| Enabled | Indicates that the entity is currently enabled in Active Directory, indicating that the entity is currently in use, and can be used to sign in or perform actions in the domain. |
| Expired | Indicates that the entity is expired in Active Directory. When a user account is expired, the user is no longer able to log in to the domain or access any network resources. The expired account is essentially treated as if it were disabled, but with an explicit expiration date set. Any services or applications that the user was authorized to access may also be affected, depending on how they are configured. |
| Honeytoken | Indicates that the entity is manually tagged as a honeytoken. |
| Locked | Indicates that the entity supplied the wrong password too many times, and is now locked. |
| Partial | Indicates that the user, device, or group is not in synch with the domain, and is partially resolved via a global catalog. In this case, some attributes aren't available. |
| Unresolved | Indicates that the device doesn't resolve to a valid identity in the Active Directory forest. No directory information is available. |
| Sensitive | Indicates that the entity is considered as sensitive. |
For more information, see Defender for Identity entity tags in Microsoft Defender XDR.
Note
The organization tree section and the account tags are available when a Microsoft Defender for Identity license is available.
Incidents and alerts
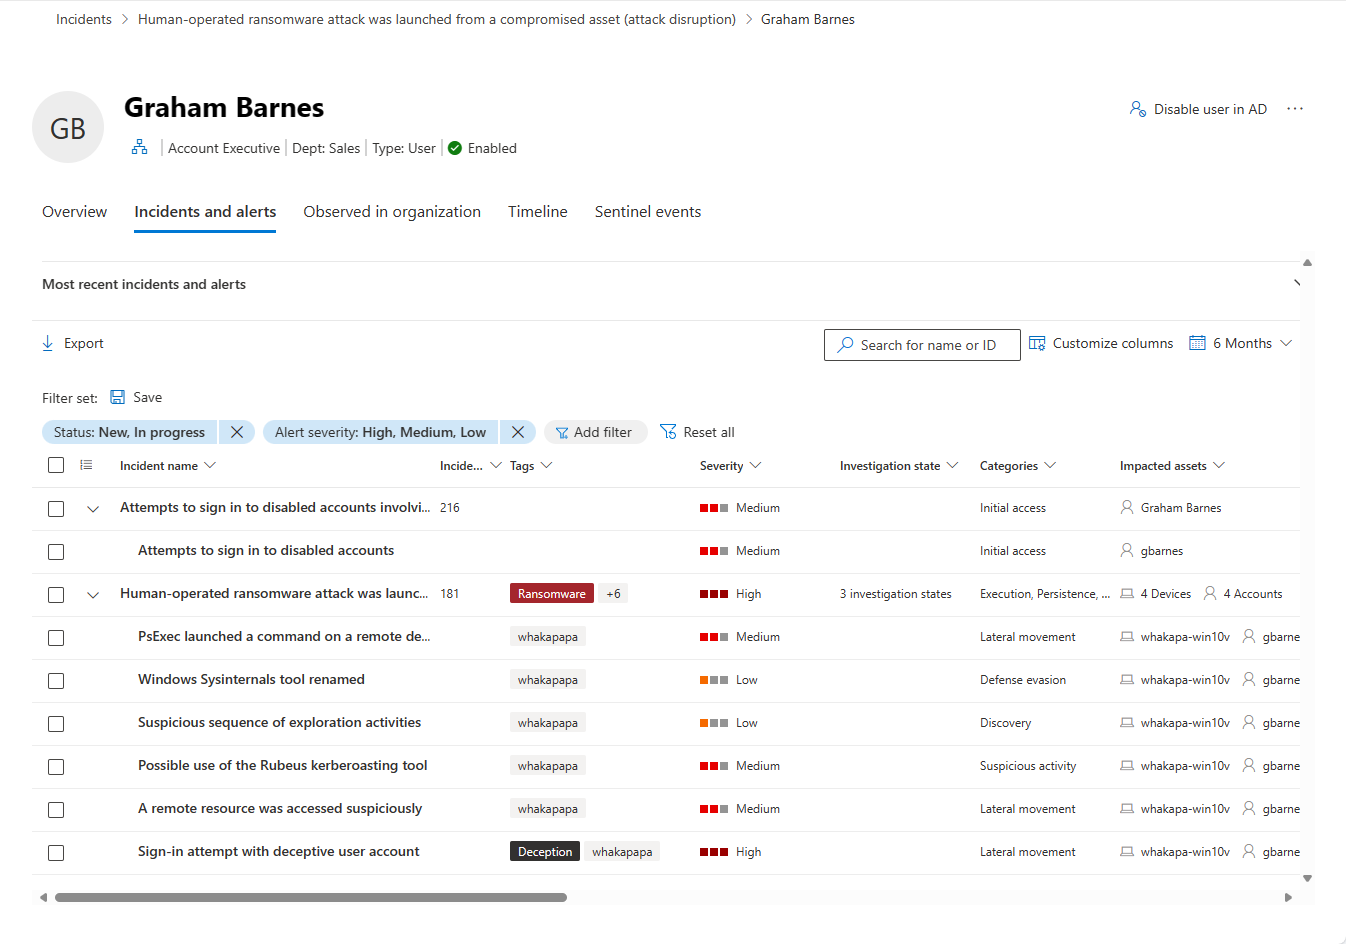
You can see all active incidents and alerts involving the user from the last six months in this tab. All the information from the main incidents and alerts queues is shown here. This list is a filtered version of the incidents queue, and shows a short description of the incident or alert, its severity (high, medium, low, informational), its status in the queue (new, in progress, resolved), its classification (not set, false alert, true alert), investigation state, category, who is assigned to address it, and last activity observed.
You can customize the number of items displayed and which columns are displayed for each item. The default behavior is to list 30 items per page. You can also filter the alerts by severity, status, or any other column in the display.
The impacted entities column refers to all the device and user entities referenced in the incident or alert.
When an incident or alert is selected, a fly-out appears. From this panel you can manage the incident or alert and view more details such as incident/alert number and related devices. Multiple alerts can be selected at a time.
To see a full page view of an incident or alert, select its title.
Observed in organization
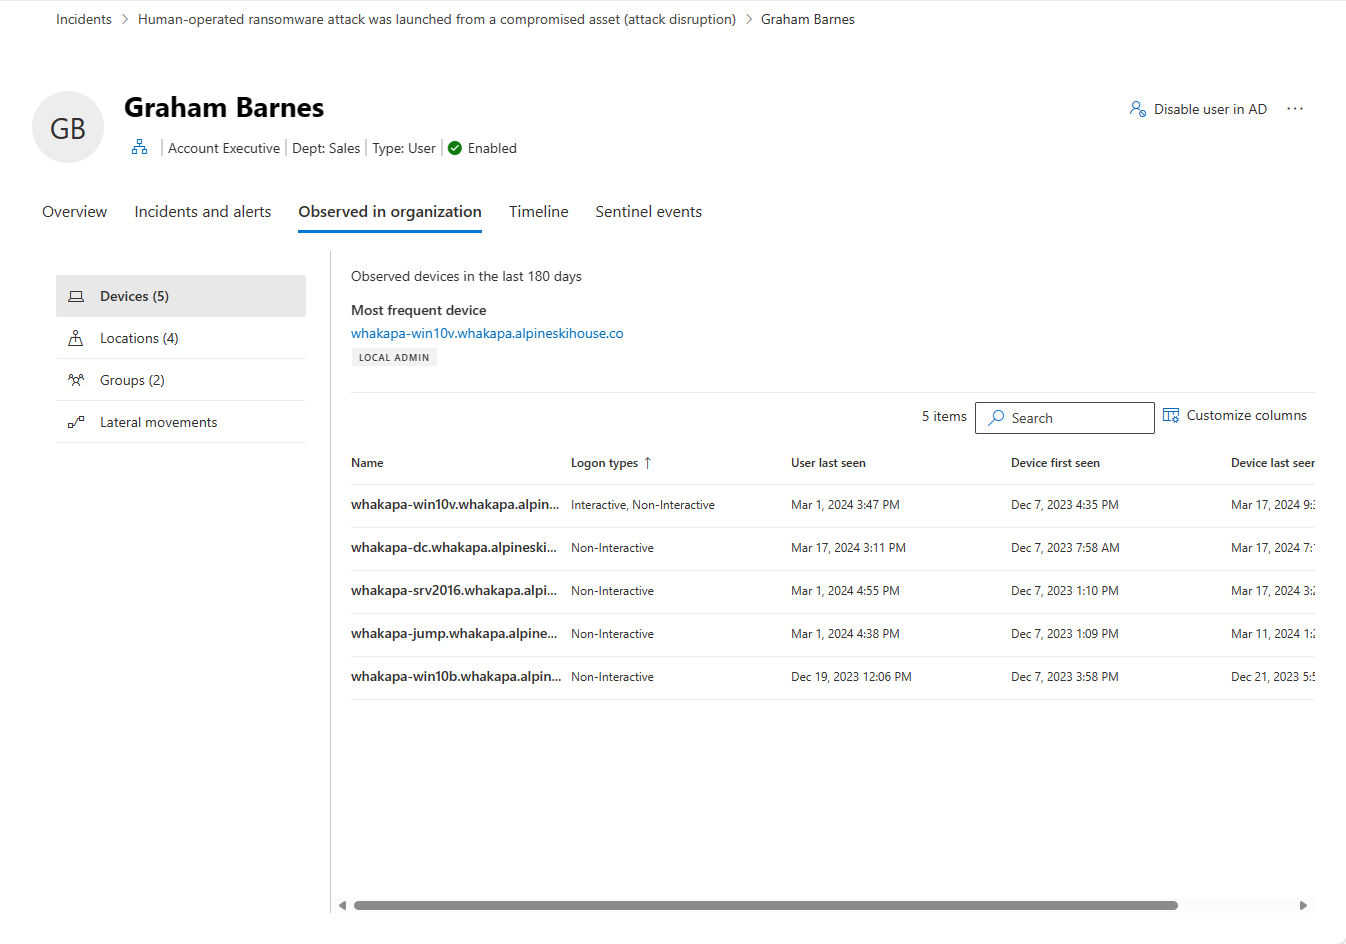
Devices: this section shows all the devices the user entity signed into in the prior 180 days, indicating the most and least used.
Locations: this section shows all the observed locations for the user entity in the last 30 days.
Groups: this section shows all observed on-premises groups for the user entity, as reported by Microsoft Defender for Identity.
Lateral movement paths: this section shows all profiled lateral movement paths from the on-premises environment, as detected by Defender for Identity.
Note
Groups and lateral movement paths are available when a Microsoft Defender for Identity license is available.
Selecting the Lateral movements tab lets you view a fully dynamic and clickable map where you can see the lateral movement paths to and from a user. An attacker can use the path information to infiltrate your network.
The map provides a list of other devices or users an attacker can take advantage of to compromise a sensitive account. If the user has a sensitive account, you can see how many resources and accounts are directly connected.
The lateral movement path report, which can be viewed by date, is always available to provide information about the potential lateral movement paths discovered and can be customized by time. Select a different date using View a different date to view previous lateral movement paths found for an entity. The graph only displays if a potential lateral movement path has been found for an entity in the past two days.
Timeline
The timeline displays user activities and alerts observed from a user's identity in the last 180 days. It unifies the user's identity entries across Microsoft Defender for Identity, Microsoft Defender for Cloud Apps, and Microsoft Defender for Endpoint workloads. By using the timeline, you can focus on activities a user performed or were performed on them in specific timeframes.
For users of the unified SOC platform to see alerts from Microsoft Sentinel based on data sources other than the ones in the previous paragraph, they can find these alerts and other information in the Sentinel events tab, described below.
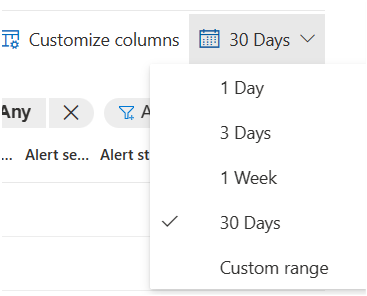
Custom time range picker: You can choose a timeframe to focus your investigation on the last 24 hours, the last 3 days and so on. Or you can choose a specific timeframe by clicking on Custom range. Filtered data older than 30 days is displayed in seven-day intervals.
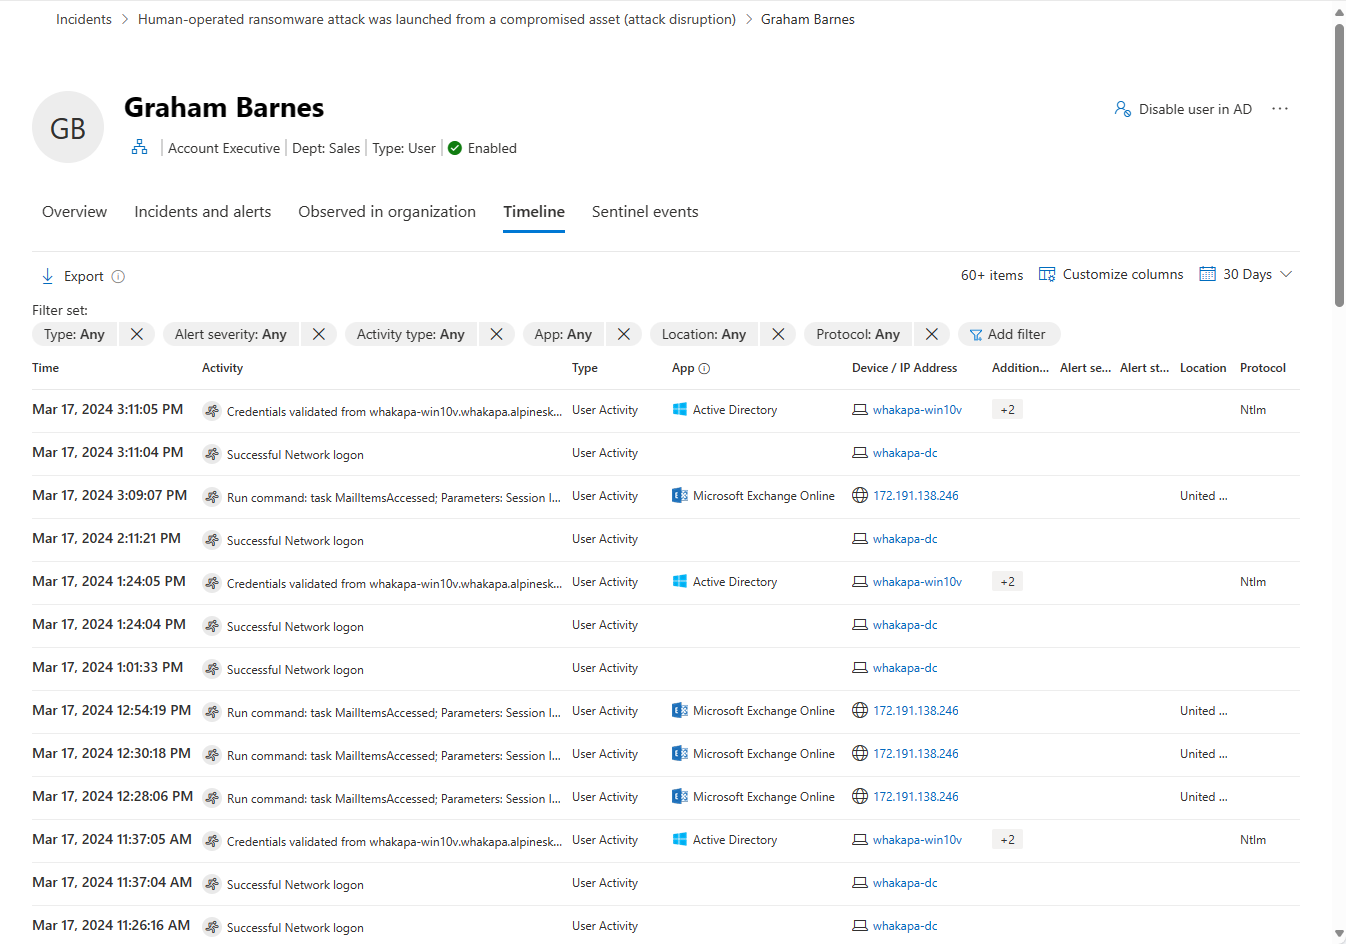
For example:Timeline filters: In order to improve your investigation experience, you can use the timeline filters: Type (Alerts and/or user's related activities), Alert severity, Activity type, App, Location, Protocol. Each filter depends on the others, and the options in each filter (drop-down) only contains the data that is relevant for the specific user.
Export button: You can export the timeline to a CSV file. Export is limited to the first 5000 records and contains the data as it displays in the UI (same filters and columns).
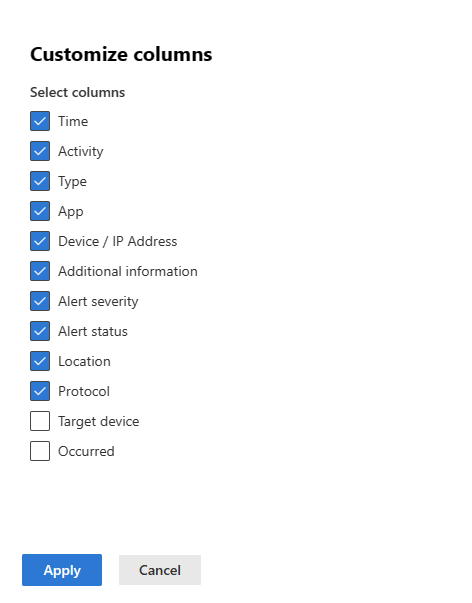
Customized columns: You can choose which columns to expose in the timeline by selecting the Customize columns button. For example:
What data types are available?
The following data types are available in the timeline:
- A user's impacted alerts
- Active Directory and Microsoft Entra activities
- Cloud apps' events
- Device logon events
- Directory services changes
What information is displayed?
The following information is displayed in the timeline:
- Date and time of the activity
- Activity/alert description
- Application that performed the activity
- Source device/IP address
- MITRE ATT&CK techniques
- Alert severity and status
- Country/region where the client IP address is geolocated
- Protocol used during the communication
- Target device (optional, viewable by customizing columns)
- Number of times the activity happened (optional, viewable by customizing columns)
For example:
Note
Microsoft Defender XDR can display date and time information using either your local time zone or UTC. The selected time zone will apply to all date and time information shown in the Identity timeline.
To set the time zone for these features, go to Settings > Security center > Time zone.
Sentinel events
If your organization onboarded Microsoft Sentinel to the Defender portal, this additional tab is on the user entity page. This tab imports the Account entity page from Microsoft Sentinel.
Sentinel timeline
This timeline shows alerts associated with the user entity. These alerts include those seen on the Incidents and alerts tab and those created by Microsoft Sentinel from third-party, non-Microsoft data sources.
This timeline also shows bookmarked hunts from other investigations that reference this user entity, user activity events from external data sources, and unusual behaviors detected by Microsoft Sentinel's anomaly rules.
Insights
Entity insights are queries defined by Microsoft security researchers to help you investigate more efficiently and effectively. These insights automatically ask the big questions about your user entity, providing valuable security information in the form of tabular data and charts. The insights include data regarding sign-ins, group additions, anomalous events and more, and include advanced machine learning algorithms to detect anomalous behavior.
The following are some of the insights shown:
- User peers based on security groups membership.
- Actions by account.
- Actions on account.
- Event logs cleared by user.
- Group additions.
- Anomalously high office operation count.
- Resource access.
- Anomalously high Azure sign-in result count.
- UEBA insights.
- User access permissions to Azure subscriptions.
- Threat indicators related to user.
- Watchlist insights (Preview).
- Windows sign-in activity.
The insights are based on the following data sources:
- Syslog (Linux)
- SecurityEvent (Windows)
- AuditLogs (Microsoft Entra ID)
- SigninLogs (Microsoft Entra ID)
- OfficeActivity (Office 365)
- BehaviorAnalytics (Microsoft Sentinel UEBA)
- Heartbeat (Azure Monitor Agent)
- CommonSecurityLog (Microsoft Sentinel)
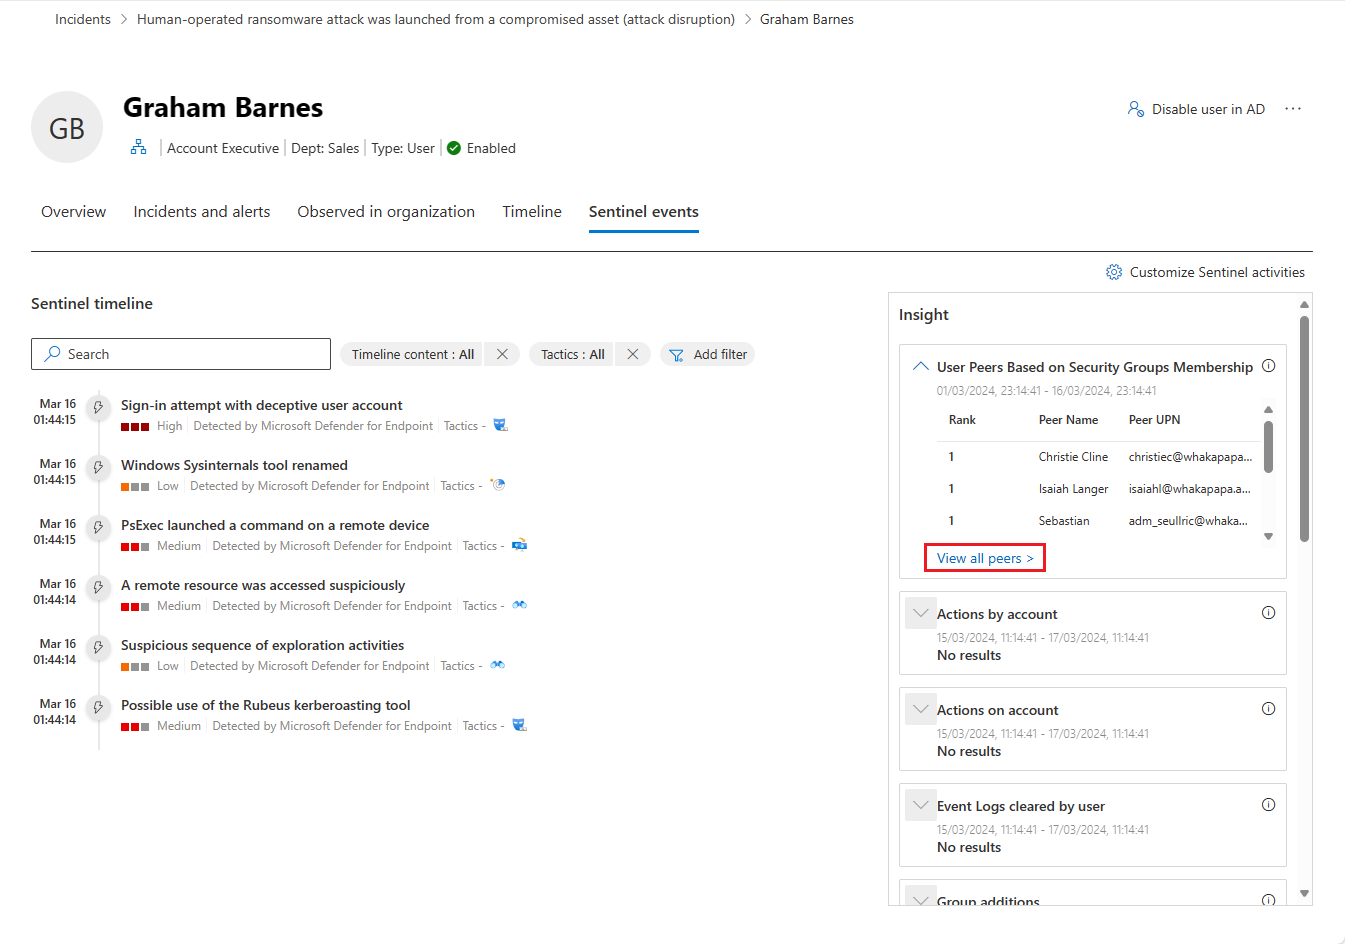
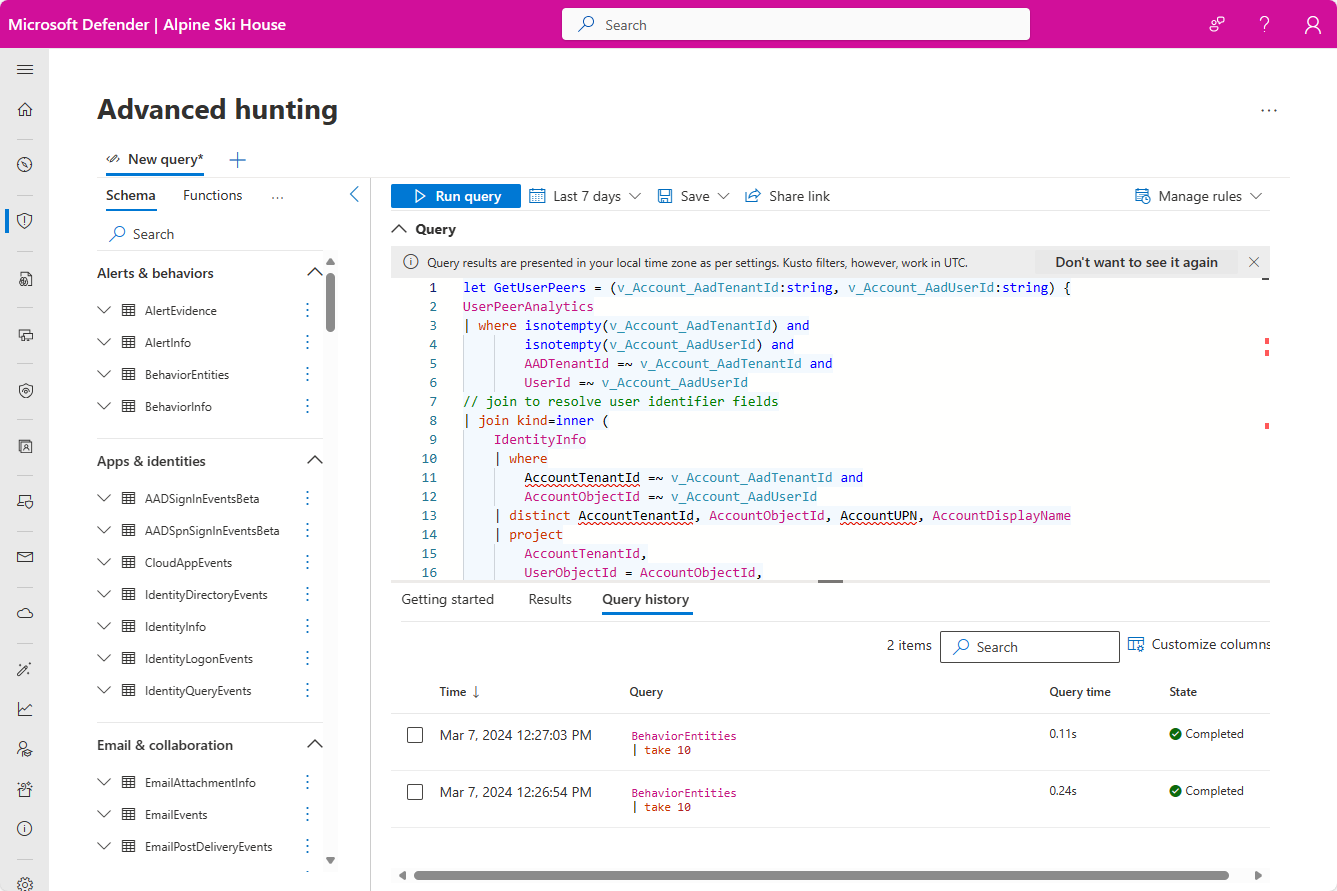
If you want to further explore any of the insights in this panel, select the link accompanying the insight. The link takes you to the Advanced hunting page, where it displays the query underlying the insight, along with its raw results. You can modify the query or drill down into the results to expand your investigation or just satisfy your curiosity.
Remediation actions
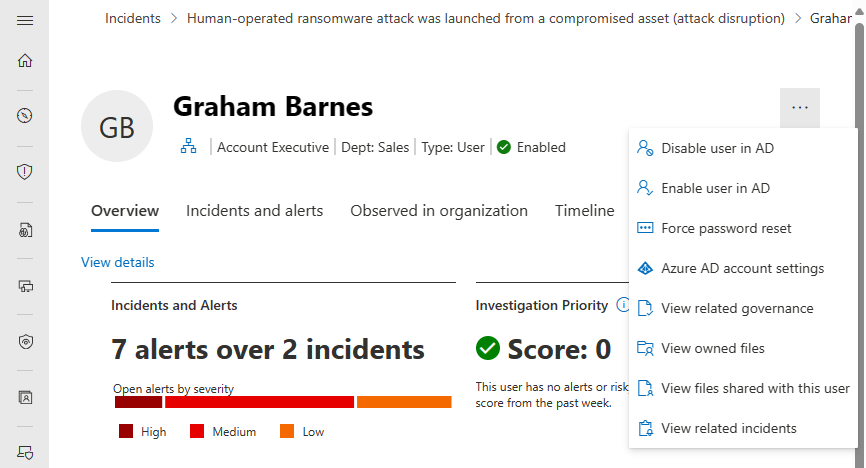
From the Overview page, you can do these additional actions:
- Enable, disable, or suspend the user in Microsoft Entra ID
- Direct user to do certain actions such as require the user to sign in again or force password reset
- Reset investigation priority score for the user
- View Microsoft Entra account settings, related governance, the user's owned files, or the user's shared files
For more information, see Remediation actions in Microsoft Defender for Identity.
Next steps
As needed for in-process incidents, continue your investigation.
See also
- Incidents overview
- Prioritize incidents
- Manage incidents
- Microsoft Defender XDR overview
- Turn on Microsoft Defender XDR
- Device entity page in Microsoft Defender
- IP address entity page in Microsoft Defender
- Microsoft Defender XDR integration with Microsoft Sentinel
- Connect Microsoft Sentinel to Microsoft Defender XDR
Tip
Do you want to learn more? Engage with the Microsoft Security community in our Tech Community: Microsoft Defender XDR Tech Community.
