Monitor a paused capacity
To monitor paused capacities, use the latest version of the Microsoft Fabric Capacity Metrics app.
View the paused capacity events
The system events table lists all the paused capacity events. Use this table to see when your capacity was paused and when it was reactivated. In the State column, a paused capacity is listed as Suspended, and a resumed capacity is listed as Active. Use the Time column to calculate the amount of time your capacity was active or paused.
Why is my capacity spiking?
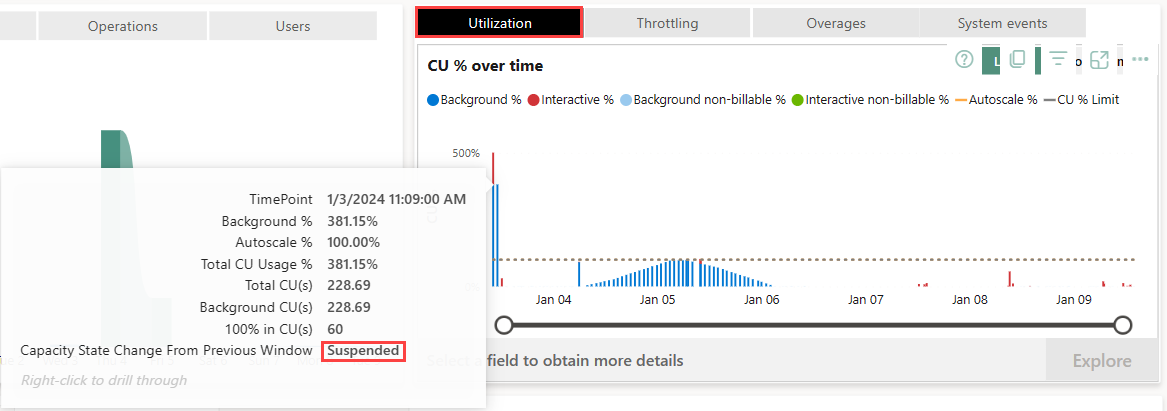
To allow your capacity to perform at the highest level, its usage is smoothed over time. When you pause your capacity, the remaining cumulative overages and smoothed operations are executed. As a result, a spike appears in the Utilization visual.
The spike provides an indication that your capacity was paused. You can hover over the spike to view and see the state of the capacity in the tooltip.

View carryforward operations
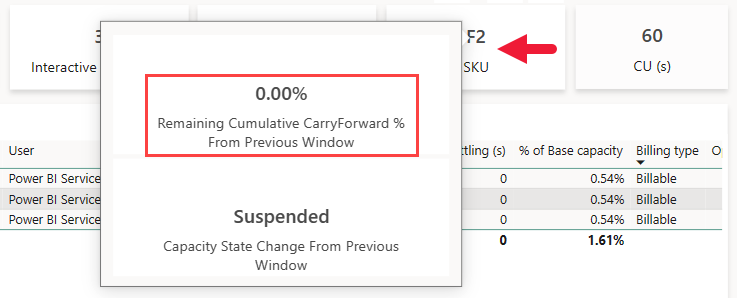
You can find out what's the percentage of carryforward operations that your capacity had when it was paused.
Locate the paused capacity timepoint by reviewing the spike in the utilization visual.
Right-click the paused capacity's timepoint and drill through to the Timepoint Detail page.
Hover over the SKU card. A tooltip displays the remaining cumulative carryforward percent.

Considerations and limitations
When you pause a capacity, the timepoint of the paused capacity is displayed on the Timepoint page 30 seconds afterward. This timepoint includes all of your capacity’s reconciled consumption. If you have enabled capacity alerts you might receive a false alert that your capacity usage has exceeded the threshold you specified, after it was paused.
When you pause a capacity, the timepoint preceding the timepoint at which the capacity was paused is canceled and doesn't appear on the Compute page. For example, if you pause your capacity at 13:00:00, the 12:29:30 timepoint won't exist.