Monitor content you distribute with Configuration Manager
Applies to: Configuration Manager (current branch)
Use the Configuration Manager console to monitor distributed content, including:
- The status for all package types for the associated distribution points.
- The content validation status for the content in a package.
- The status of content assigned to a specific distribution point group.
- The state of content assigned to a distribution point.
- The status of optional features for each distribution point (content validation, PXE, and multicast).
Configuration Manager only monitors the content on a distribution point that's in the content library. It doesn't monitor content stored on the distribution point in package or custom shares.
Tip
The Power BI sample reports for Configuration Manager includes a report called Content Status. This report can also help with monitoring content.
Content status monitoring
The Content Status node in the Monitoring workspace provides information about content packages. In the Configuration Manager console, review information like:
- Package name, type, and ID
- How many distribution points a package has been sent to
- Compliance rate
- When the package was created
- Source version
You also find detailed status information for any package, including:
- Distribution status
- The number of failures
- Pending distributions
- The number of installations
You can also manage distributions that remain in progress to a distribution point, or that failed to successfully distribute content to a distribution point:
The option to either cancel or redistribute content is available when you view the deployment status message of a distribution job to a distribution point in the Asset Details pane. This pane can be found in either the In Progress tab or the Error tab of the Content Status node.
Additionally, the job details display the percentage of the job that has completed when you view the details of a job on the In Progress tab. The job details also display the number of retries that remain for a job. When you view the details of a job on the Error tab, it shows how long before the next retry occurs.
When you cancel a deployment that's not yet complete, the distribution job to transfer that content stops:
- The status of the deployment then updates to indicate that the distribution failed, and that it was canceled by a user action.
- This new status appears in the Error tab.
Note
When a deployment is near completion, it's possible the action to cancel that distribution won't process before the distribution to the distribution point completes. When this occurs, the action to cancel the deployment is ignored, and the status for the deployment displays as successful.
Although you can select the option to cancel a distribution to a distribution point that is located on a site server, this has no effect. This behavior is because the site server and the distribution point on a site server share the same single instance content store. There's no actual distribution job to cancel.
When you redistribute content that previously failed to transfer to a distribution point, Configuration Manager immediately begins redeploying that content to the distribution point. Configuration Manager updates the status of the deployment to reflect the ongoing state of that redeployment.
Tasks to monitor content
In the Configuration Manager console, go to the Monitoring workspace, expand Distribution Status, and then select the Content Status node. This node displays the packages.
Select the package you want to manage.
On the Home tab of the ribbon, in the Content group, select View Status. The console displays detailed status information for the package.
Tip
Starting in version 2203, select View Content Distribution to monitor content distribution path and status in a graphical format. The graph shows distribution point type, distribution state, and associated status messages. This visualization allows you to more easily understand the status of your content package distribution. For more information, see Visualize content distribution status.
Continue to one of the following sections for other actions:
Cancel a distribution that remains in progress
Switch to the In Progress tab.
In the Asset Details pane, right-click the entry for the distribution that you want to cancel, and select Cancel.
Select Yes to confirm the action and cancel the distribution job to that distribution point.
Redistribute content that failed to distribute
Switch to the Error tab.
In the Asset Details pane, right-click the entry for the distribution that you want to redistribute, and select Redistribute.
Select Yes to confirm the action and start the redistribution process to that distribution point.
Distribution point group status
The Distribution Point Group Status node in the Monitoring workspace provides information about distribution point groups. You can review information like:
- The distribution point group name, description, and status
- How many distribution points are members of the distribution point group
- How many packages have been assigned to the group
- The compliance rate
You also view the following detailed status information:
- Errors for the distribution point group
- How many distributions are in progress
- How many have been successfully distributed
Monitor distribution point group status
In the Configuration Manager console, go to the Monitoring workspace, expand Distribution Status, and then select the Distribution Point Group Status node. It displays the distribution point groups.
Select the distribution point group for which you want detailed status information.
On the Home tab of the ribbon, select View Status. It displays detailed status information for the distribution point group.
Distribution point configuration status
The Distribution Point Configuration Status node in the Monitoring workspace provides information about the distribution point. You can review what attributes are enabled for the distribution point, such as the PXE, multicast, content validation. Also review the distribution status for the distribution point.
Warning
Distribution point configuration status is relative to the last 24 hours. If the distribution point has an error and recovers, the error status might be displayed for up to 24 hours after the distribution point recovers.
Monitor distribution point configuration status
In the Configuration Manager console, go to the Monitoring workspace, expand Distribution Status, and then select the Distribution Point Configuration Status node.
Select a distribution point.
In the results pane, switch to the Details tab. It displays status information for the distribution point.
Client data sources dashboard
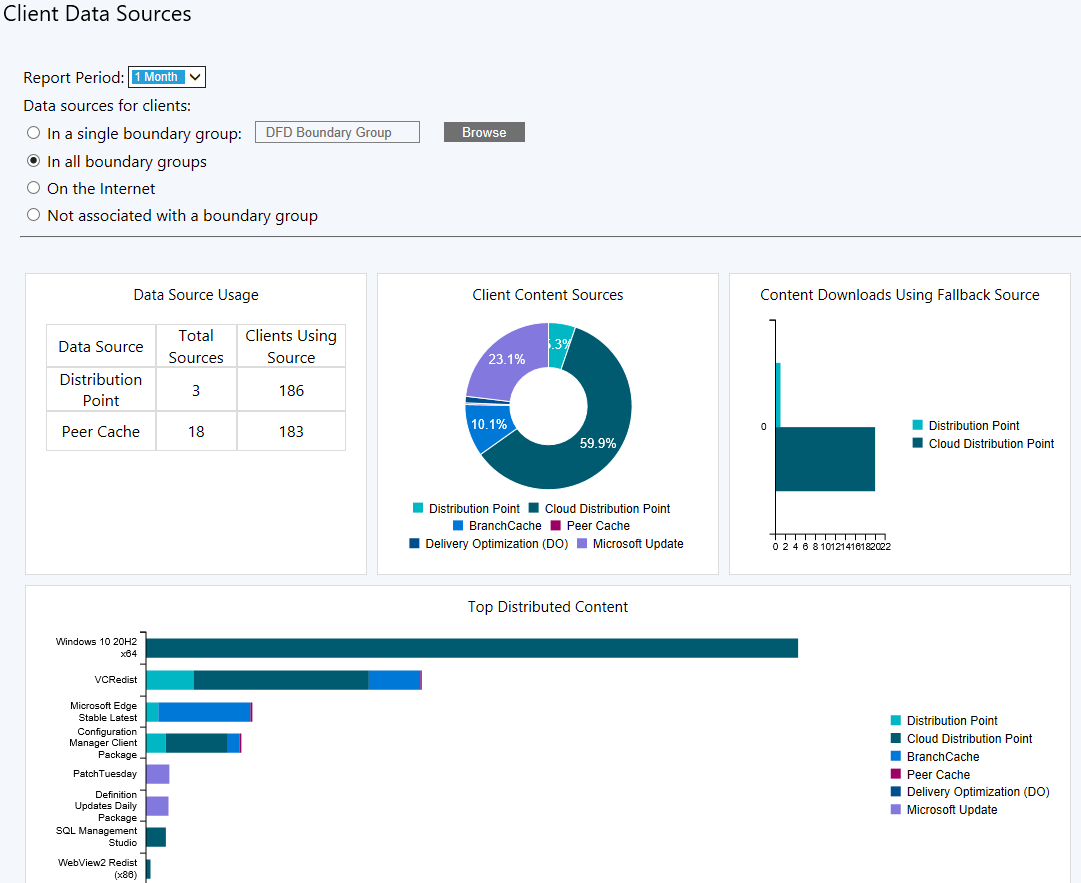
Use the Client data sources dashboard to better understand from where clients get content in your environment. The dashboard starts displaying data after clients download content and report that information back to the site. This process can take up to 24 hours.
The client data sources dashboard includes a selection of filters to view information about where clients get content:
Note
Configuration Manager doesn't enable this optional feature by default. Before you can use it, enable the Client Peer Cache feature. For more information, see Enable optional features from updates.
In the Configuration Manager console, go to the Monitoring workspace, expand Distribution Status, and select the Client Data Sources node.
Report Period: Select a time period to apply to the dashboard.
Then select the single boundary group for which you want to view information.
You can also select more filters for the dashboard:
- All boundary groups
- Internet clients
- Clients not associated with a boundary group
Note
If there's no data available for the selected client group, the chart displays: "This data is not yet available."
You can hover your mouse over tiles to see more details about the different content or policy sources.
Also use the report, Client Data Sources - Summarization, to view a summary of the client data sources for each boundary group.
Dashboard tiles
The dashboard includes the following tiles:
Data source usage
This tile summarizes the types of sources in your environment and how many clients use them.
This summary tile replaces the following four tiles in prior versions:
- Distribution points
- Clients that used a distribution point
- Peer cache sources
- Clients that used a peer
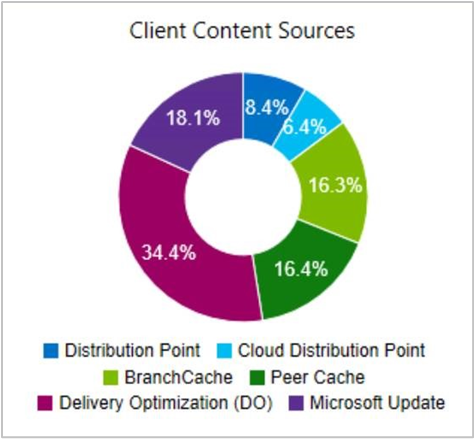
Client content sources
Displays the sources from which clients got content:
- Distribution point
- Cloud distribution point, which includes content-enabled cloud management gateways
- BranchCache
- Peer Cache
- Delivery Optimization Note 1
- Microsoft Update: Devices report this source when the Configuration Manager client downloads software updates from Microsoft cloud services. These services include Microsoft Update and Microsoft 365 Apps for enterprise.

Note
To include Delivery Optimization on this dashboard, do the following actions:
Configure the client setting, Enable installation of Express Updates on clients in the Software Updates group
Deploy Windows express updates
For more information, see Manage Express installation files for Windows updates.
Content downloads using fallback source
This information helps you understand how often clients download content from an alternate source.
Top distributed content
The most distributed packages by source type
