Opportunity Analysis sample for Power BI: Take a tour
Note
For an updated version of this sample, see Revenue Opportunities sample for Power BI: Take a tour.
The Opportunity Analysis built-in sample contains a dashboard, report, and semantic model for a software company that has two sales channels: direct and partner. The sales manager created this dashboard to track opportunities and revenue by region, deal size, and channel.
This sample relies on two measures of revenue:
- Revenue: A salesperson's estimate of what the revenue will be.
- Factored revenue: Calculated as revenue X probability% and is accepted as being a more-accurate predictor of actual sales revenue. Probability is determined by the deal's current sales stage:
- Lead: 10%
- Qualify: 20%
- Solution: 40%
- Proposal: 60%
- Finalize: 80%
This sample is part of a series that shows how you can use Power BI with business-oriented data, reports, and dashboards. The company obviEnce created this sample using real, anonymized data. The data is available in several formats: built-in sample in the Power BI service, .pbix Power BI Desktop file, or Excel workbook. See Samples for Power BI.
This tutorial explores the Opportunity Analysis built-in sample in the Power BI service. Because the report experience is similar in Power BI Desktop and in the service, you can also follow along by using the sample .pbix file in Power BI Desktop. Get the sample in one of the following ways:
- Get the built-in sample in the Power BI service.
- Download the .pbix file.
- Download the Excel workbook.
Prerequisites
You don't need a Power BI license to explore the sample in Power BI Desktop. You just need a Fabric free license to explore the sample in the Power BI service, and save it to your My workspace.
Get the built-in sample
Open the Power BI service (
app.powerbi.com), and select Learn in the left navigation.On the Learning center page, under Sample reports, scroll until you see the Opportunity Analysis Sample.
Select the sample. It opens in Reading mode.
Power BI imports the built-in sample, adding a new dashboard, report, and semantic model to your current workspace.
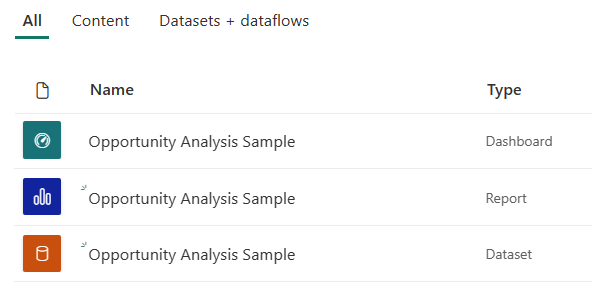
Select the dashboard to view the sample dashboard.
What's the dashboard telling us?
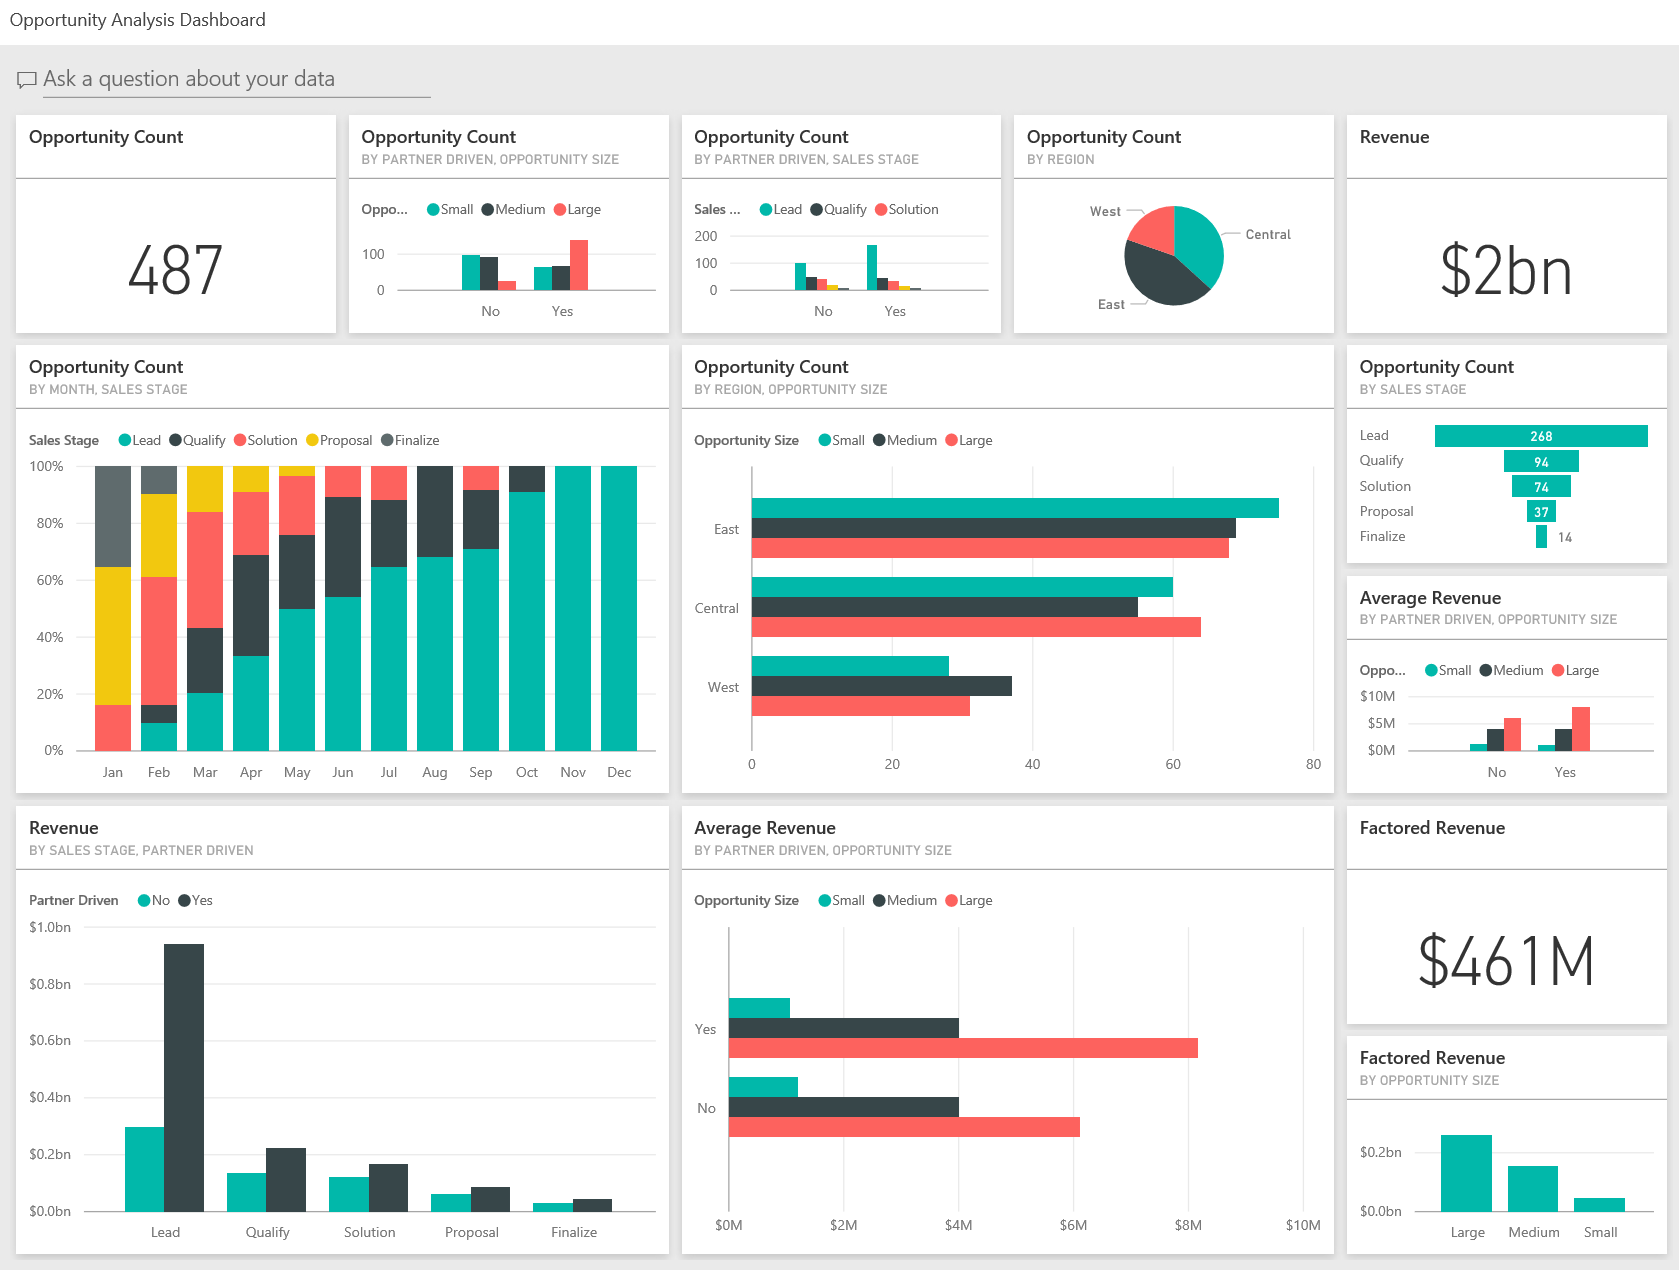
With the built-in sample in the Power BI service, you have a report and a dashboard. Let's start the tour at the dashboard that the sales manager has created to track those metrics most important to them. When they see something interesting, they can select a tile to look into the data:
- Company revenue is \$2 billion and factored revenue is \$461 million.
- Opportunity count and revenue follow a familiar funnel pattern, with totals decreasing with each subsequent stage.
- Most of our opportunities are in the East region.
- Large opportunities generate more revenue than medium or small opportunities.
- Large partner deals generate more revenue: \$8 million on average versus \$6 million for direct sales.
Because the effort to land a deal is the same whether the deal is classified as large, medium, or small, our company should analyze the data to learn more about large opportunities.
In the Power BI service, find the workspace where you saved the sample, then select the Opportunity Analysis Sample dashboard.
If you're using Power BI Desktop, open the .pbix file and select the Opportunity Count tab.
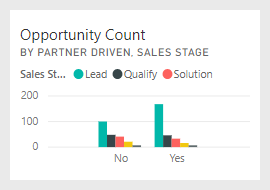
Select the Opportunity Count by Partner Driven, Sales Stage tile to open the first page of the Opportunity Analysis Sample report.
Get the .pbix file for this sample
Alternatively, you can download the Opportunity Analysis sample as a .pbix file, which is designed for use with Power BI Desktop.
After you open the file in Power BI Desktop, select File > Publish > Publish to Power BI or choose Publish in the Home ribbon.
In the Publish to Power BI dialog, choose a workspace and then Select.
In the Power BI service, in your workspace, scroll down to the Opportunity Analysis Sample report and select to open.
From the More options (...) menu, select Pin to a dashboard. Select New dashboard, enter a name, and choose Pin live.
The dashboard that you create this way isn't the same as the sample dashboard created by the built-in sample. You can still use Q&A and make changes to your dashboard.
Get the Excel workbook for this sample
If you want to view the data source for this sample, it's also available as an Excel workbook. To see the raw data, enable the Data Analysis add-ins, and then select Power Pivot > Manage.
If you want to get and use the Excel file in the Power BI service, follow these steps:
Download the sample from Power BI Desktop samples. The file is called Opportunity Tracking Sample no PV.xlsx.
Open the file in Excel and then select File > Publish > Publish to Power BI.
Select a workspace, such as My workspace, and choose Export.
There are different ways to work with Excel files. For more information, see Explore the Excel samples in Excel.
In the Power BI service, the exported data appears as a semantic model in the selected workspace. Select More options (...) > Auto-create report.
Select Save, enter a name for your report, and then choose Save.
From the More options (...) menu, select Pin to a dashboard. Select New dashboard, enter a name, and choose Pin live.
The dashboard that you create this way isn't the same as the sample dashboard created by the built-in sample. You can still use Q&A and make changes to your dashboard.
Explore the pages in the report
View each page in the report by selecting the page tabs on the side navigation.
Opportunity Count Overview page
Note the following details:
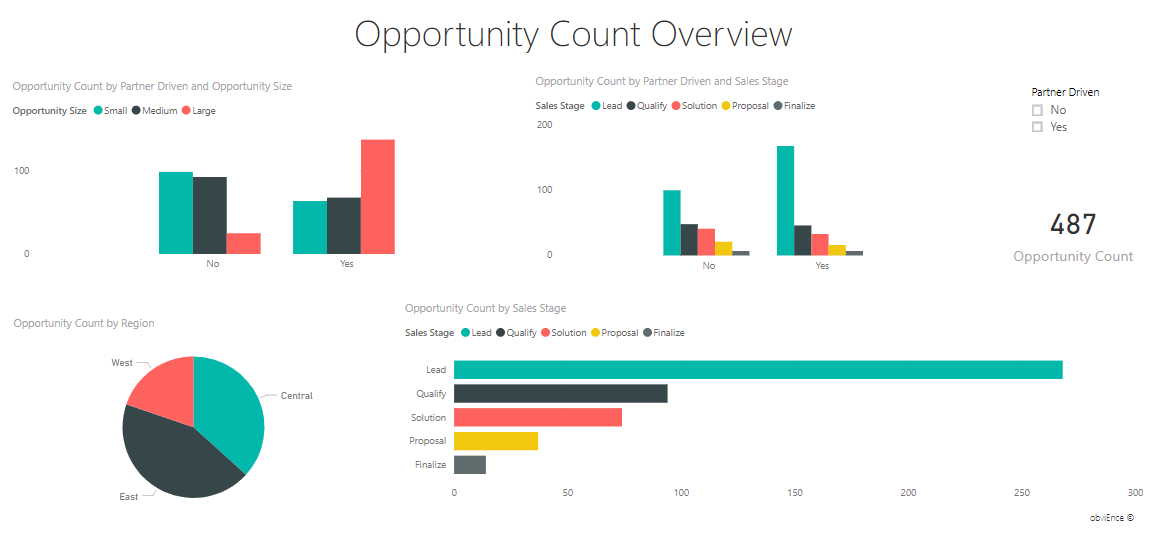
- East is our biggest region in terms of opportunity counts.
- On the Opportunity Count by Region pie chart, select each region in turn to filter the page by region. For each region, notice that partners are pursuing significantly more large opportunities.
- The Opportunity Count by Partner Driven and Opportunity Size column chart shows that most of the large opportunities are partner driven, while most of the small and medium opportunities are not.
- In the Opportunity Count by Sales Stage bar chart, select each Sales Stage in turn to see the difference in regional count. Notice that although the East region has the largest opportunity count, all three regions in the Solution, Proposal, and Finalize sales stages have comparable counts. This result means we close a higher percent of deals in the Central and West regions.
Revenue Analysis page
This page takes a similar look at the data, but uses a revenue perspective instead of count.
Note the following details:
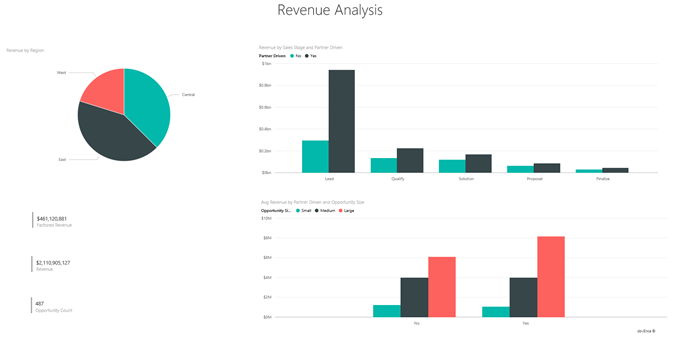
- East is our biggest region, not only in opportunity count but also in revenue.
- If you filter the Revenue by Sales Stage and Partner Driven chart by selecting Yes for Partner Driven, you see a revenue of \$1.5 billion and a factored revenue of \$294 million. Compare these amounts to \$644 million and \$166 million for non-partner driven revenue.
- Average revenue for large accounts is larger at \$8 million if the opportunity is partner driven, compared to \$6 million for non-partner driven business.
- For partner driven businesses, average revenue for large-sized opportunities is almost double that of medium-sized opportunities.
- Average revenue for small and medium businesses is comparable for both partner driven and non-partner driven business.
Clearly our partners are doing a better job than non-partners selling to customers. It might make sense to funnel more deals through our partners.
Opportunity Count by Region and Stage
This page of the report looks at data similar to the data on the previous page but breaks it down by region and stage.
Note the following details:
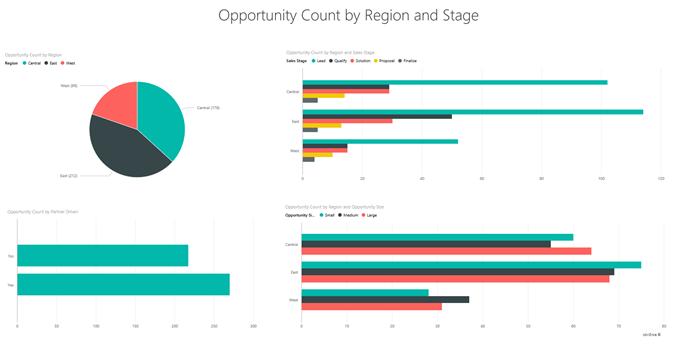
- If you select East in the Opportunity Count by Region pie chart to filter by the East region, you see that the opportunities in this region are split almost equally between partner driven and non-partner driven.
- Large opportunities are most common in the Central region, small opportunities are most common in the East region, and medium opportunities are most common in the West region.
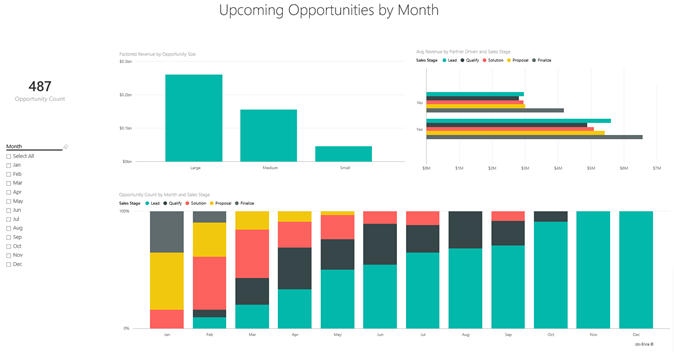
Upcoming Opportunities by Month page
This page looks at similar factors, but from a date and time perspective.
Our CFO uses this page to manage workload. By looking at the revenue opportunities by sales stage and month, they can plan accordingly.
Note the following details:
- Average revenue for the Finalize sales stage is the highest. Closing these deals is a top priority.
- If you filter by month (by selecting a month in the Month slicer), you see that January has a high proportion of large deals in the Finalize sales stage with a factored revenue of $75 million. February, on the other hand, has mostly medium deals in the Solution and Proposal sales stages.
- In general, the factored revenue numbers fluctuate based on sales stage, number of opportunities, and deal size. Add filters for these factors by using the Filter pane on the right to discover further insights.
Edit the report
Select Edit in the Power BI header bar to explore in the editing view:
- See how the pages are made, the fields in each chart, and the filters on the pages.
- Add pages and charts, based on the same data.
- Change the visualization type for each chart.
- Pin charts of interest to your dashboard.
Related content
This environment is a safe one to play in, because you can choose not to save your changes. But if you do save them, you can always return to the Learning center for a new copy of this sample.
We hope this tour has shown how Power BI dashboards, Q&A, and reports can provide insights into sample data. Now it's your turn. Connect to your own data. With Power BI, you can connect to a wide variety of data sources. To learn more, see Get started creating in the Power BI service.
