What is Power BI Desktop?
Power BI Desktop is a free application you install on your local computer that lets you connect to, transform, and visualize your data. With Power BI Desktop, you can connect to multiple different sources of data, and combine them (often called modeling) into a data model. This data model lets you build visuals, and collections of visuals you can share as reports, with other people inside your organization. Most users who work on business intelligence projects use Power BI Desktop to create reports, and then use the Power BI service to share their reports with others.

The most common uses for Power BI Desktop are as follows:
- Connect to data.
- Transform and clean data to create a data model.
- Create visuals, such as charts or graphs that provide visual representations of the data.
- Create reports that are collections of visuals on one or more report pages.
- Share reports with others by using the Power BI service.
People who are responsible for such tasks are often considered data analysts (sometimes referred to as analysts) or business intelligence professionals (often referred to as report creators). Many people who don't consider themselves an analyst or a report creator use Power BI Desktop to create compelling reports, or to pull data from various sources. They can build data models, and then share the reports with their coworkers and organizations.
Important
Power BI Desktop is updated and released on a monthly basis, incorporating customer feedback and new features. Only the most recent version of Power BI Desktop is supported; customers who contact support for Power BI Desktop will be asked to upgrade to the most recent version. You can get the most recent version of Power BI Desktop from the Windows Store, or as a single executable containing all supported languages that you download and install on your computer.
There are three views available in Power BI Desktop, which you select on the left side of the canvas. The views, shown in the order they appear, are as follows:
- Report: You create reports and visuals, where most of your creation time is spent.
- Data: You see the tables, measures, and other data used in the data model associated with your report, and transform the data for best use in the report's model.
- Model: You see and manage the relationships among tables in your data model.
The following image shows the three views, as displayed along the left side of the canvas:
![]()
Connect to data
To get started with Power BI Desktop, the first step is to connect to data. There are many different data sources you can connect to from Power BI Desktop.
To connect to data:
From the Home ribbon, select Get Data > More.
The Get Data window appears, showing the many categories to which Power BI Desktop can connect.

When you select a data type, you're prompted for information, such as the URL and credentials, necessary for Power BI Desktop to connect to the data source on your behalf.

After you connect to one or more data sources, you may want to transform the data so it's useful for you.
Transform and clean data, create a model
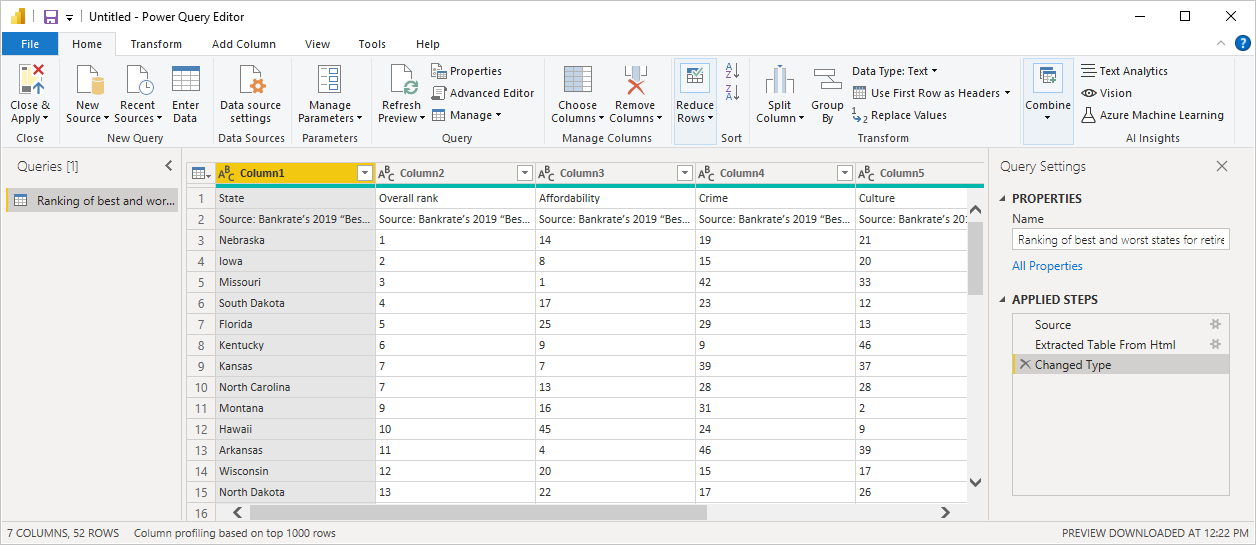
In Power BI Desktop, you can clean and transform data using the built-in Power Query Editor. With Power Query Editor, you make changes to your data, such as changing a data type, removing columns, or combining data from multiple sources. It's like sculpting: you start with a large block of clay (or data), then shave off pieces or add others as needed, until the shape of the data is how you want it.
To start Power Query Editor:
On the Home ribbon, in the Queries section, select Transform data.
The Power Query Editor window appears.

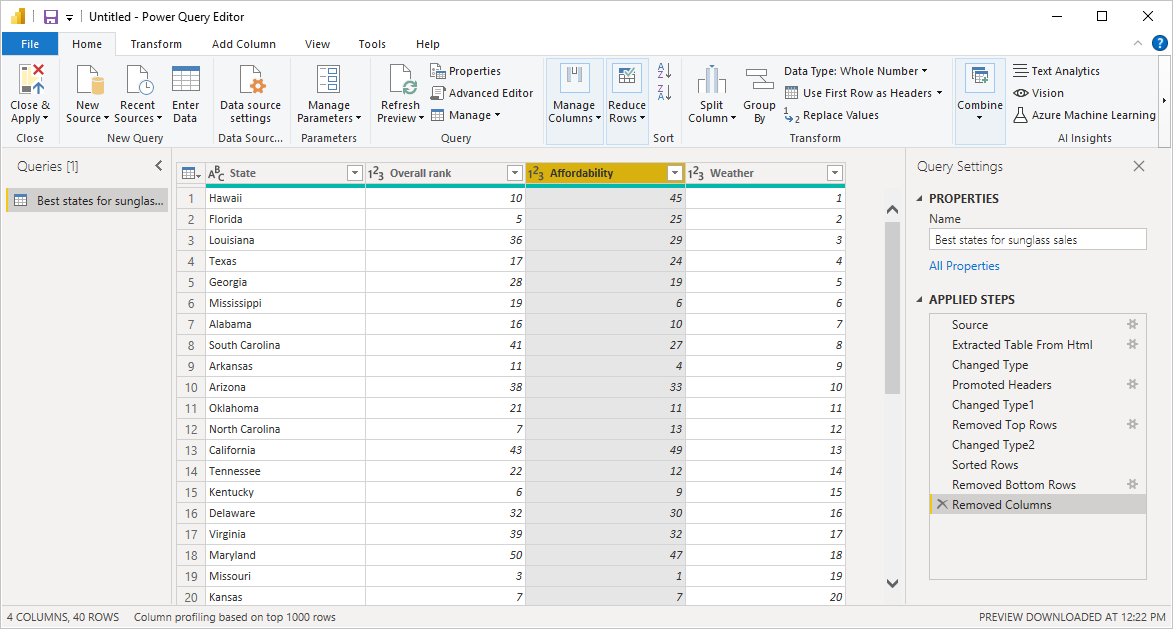
Each step you take in transforming data (such as renaming a table, transforming a data type, or deleting a column) is recorded by Power Query Editor. Every time this query connects to the data source, those steps are carried out so that the data is always shaped the way you specify.
The following image shows the Power Query Editor window for a query that was shaped, and turned into a model.

Once your data is how you want it, you can create visuals.
Create visuals
After you have a data model, you can drag fields onto the report canvas to create visuals. A visual is a graphic representation of the data in your model. There are many different types of visuals to choose from in Power BI Desktop. The following visual shows a simple column chart.

To create or change a visual:
From the Visualizations pane, select the Build visual icon.

If you already have a visual selected on the report canvas, the selected visual changes to the type you selected.
If no visual is selected on the canvas, a new visual is created based on your selection.
Create reports
More often, you'll want to create a collection of visuals that show various aspects of the data you've used to create your model in Power BI Desktop. A collection of visuals, in one Power BI Desktop file, is called a report. A report can have one or more pages, just like an Excel file can have one or more worksheets.
With Power BI Desktop you can create complex and visually rich reports, using data from multiple sources, all in one report that you can share with others in your organization.
In the following image, you see the first page of a Power BI Desktop report, named Overview, as seen on the tab near the bottom of the image.

Share reports
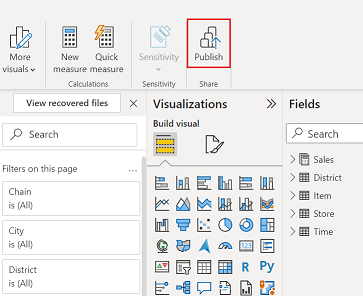
After a report is ready to share with others, you can publish the report to the Power BI service, and make it available to anyone in your organization who has a Power BI license.
To publish a Power BI Desktop report:
Select Publish from the Home ribbon.

Power BI Desktop connects you to the Power BI service with your Power BI account.
You're prompted to select where in the Power BI service you'd like to share the report. For example, your workspace, a team workspace, or some other location in the Power BI service.
You must have a Power BI license to share reports to the Power BI service.
Related content
The following articles can help you understand how Power BI Desktop fits into Microsoft's offerings:
To get started with Power BI Desktop, the first thing you need is to download and install the application. There are a few ways to get Power BI Desktop: