Įvykiai
Power BI DataViz Pasaulio čempionatas
02-14 16 - 03-31 16
Su 4 galimybes įvesti, galite laimėti konferencijos paketą ir padaryti jį LIVE Grand Finale Las Vegase
Sužinokite daugiauŠi naršyklė nebepalaikoma.
Atnaujinkite į „Microsoft Edge“, kad pasinaudotumėte naujausiomis funkcijomis, saugos naujinimais ir techniniu palaikymu.
APPLIES TO: ![]() Power BI Desktop
Power BI Desktop ![]() Power BI service
Power BI service
ArcGIS for Power BI is a mapping visualization that helps you to enrich your data, reports, and dashboards. It offers mapping capabilities, demographic data, location analytics, and spatial analysis tools. Use these tools to demonstrate patterns in and add insight to your data. You can create and view ArcGIS map visualizations in the Power BI service or Power BI Desktop. See the Considerations and limitations section in this article for details. This tutorial uses Power BI Desktop.
With ArcGIS for Power BI's robust mapping capabilities, use smart-map themes to predict the best way to illustrate your data, highlight areas in your report and use local demographics. These capabilities add relevant regional context, and refine the symbology you use to improve your report's overall clarity.
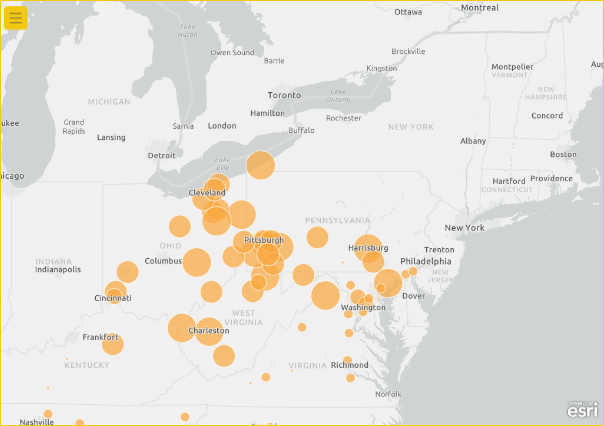
Combining authoritative data layers on a map with spatial analysis helps you explore the complexities behind your Power BI data. For example, you can use ArcGIS for Power BI to provide regional insight into sales figures. The following example shows regional sales by size on a per-City basis against a demographic layer of US Census average household income (dark blue=higher income) in the selected area.
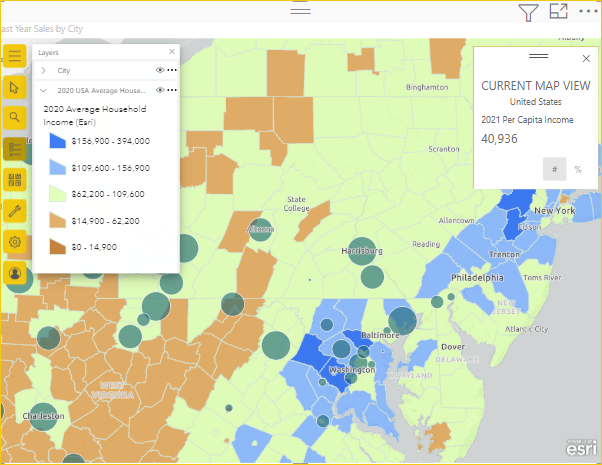
This demographic data layer provides insight, for example, into how household income and store locations might affect current sales and influence future purchasing, advertising, or store site selection decisions.
Patarimas
To learn about how your report consumers experience ArcGIS for Power BI, see Interact with ArcGIS maps that has been shared with you.
You can also visit the ArcGIS site, Esri's ArcGIS for Power BI:
Pastaba
As a report designer, you can share an ArcGIS for Power BI map with a colleague who can view and interact with the map. Your colleague cannot save changes to your map. Further, you currently cannot create an ArcGIS for Power BI map on a mobile device, but you can view and interact with it.
ArcGIS for Power BI is provided by Esri. Your use of ArcGIS for Power BI is subject to Esri's terms and privacy policy. Power BI users who use the ArcGIS for Power BI visualization must accept the terms on the consent dialog. This dialog appears only the first time you use ArcGIS for Power BI.
This tutorial uses Power BI Desktop and the PBIX Retail Analysis sample. You can also use the Power BI service to create a map visualization with ArcGIS for Power BI.
Start by adding a new page to your report.
To add a map to a report, follow these steps:
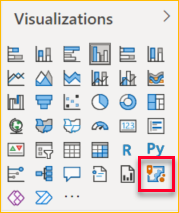
Select the ArcGIS for Power BI icon in the Visualizations pane.
An Esri user consent dialog might appear the first time you use ArcGIS for Power BI. Select OK to continue.
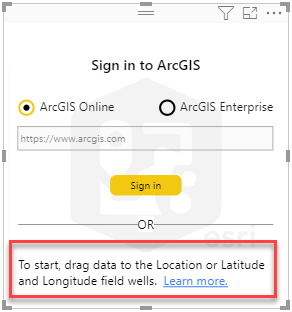
Power BI adds an empty template to the report canvas and provides an optional sign-in prompt.
This tutorial uses the Standard version of ArcGIS for Power BI. However, if you sign in to a valid, licensed ArcGIS account, you have access to more features. For details about account types, visit the ArcGIS for Power BI online help.
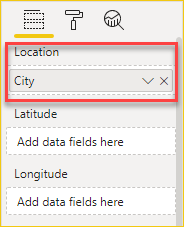
To begin adding data, select the Store > City data field on the Fields pane and drag it to the Location field well on the Visualizations pane. You can also drag coordinates into the appropriate Latitude and Longitude field wells.
Drag the Sales > Last Year Sales measure from the Fields pane to the Size field well on the Visualizations pane to adjust how the data is shown.
The map now shows Last Year Sales for U.S. Cities using Counts and Amounts (size) symbols, as shown in the image. You can zoom in to view this data visualization and pan around the map.
You have created your first ArcGIS for Power BI visualization. Next, learn how to refine and format the visualization using basemaps, location types, themes, and more.
You can embed a map-enabled ArcGIS for Power BI report containing private, secure, or proprietary ArcGIS data in a secure website or app. Viewers of the report must sign in to an ArcGIS account to view it. See Content sharing for general information about embedding ArcGIS content.
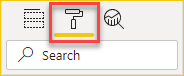
To access ArcGIS for Power BI formatting features, in the Visualizations pane, select the Format tab to view the formatting options.
ArcGIS map formatting options include:
 is visible in the expanded Map tools, define the position of the Layers list, and anchor the list over the map. The Layers list is visible by default.
 is visible in the expanded Map tools, lock the map extent in its current position, and define the position of the infographics cards on the map. Zoom tools and the Basemaps button aren't visible by default.
 is visible in the expanded Map tools. Search is visible by default.
Pastaba
Reset to default returns all formatting options to their original configuration.
After you add data to the map visualization, the Map tools button  becomes available.
Pastaba
This tutorial shows only the features and options available in the Standard version of ArcGIS for Power BI. If you're signed in to a valid, licensed ArcGIS account with the proper licensing, you'll have access to more features.
Select the Map tools button
to expand the tools.
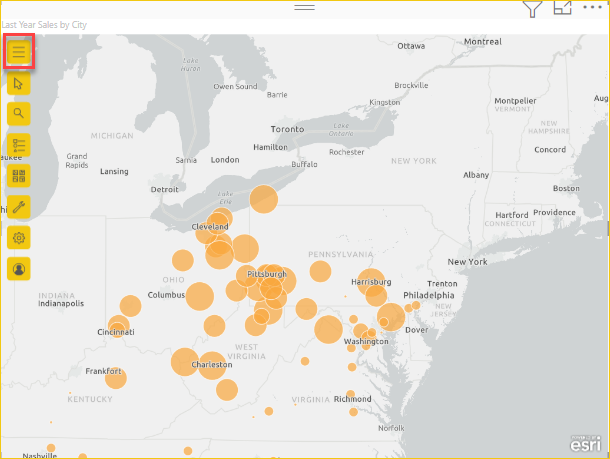
The map tools expand to show the available features. Each feature, when selected, opens a task pane that provides detailed options.
Patarimas
Esri provides comprehensive documentation about using ArcGIS for Power BI.
A basemap provides a background, or visual context, for the data in a map. For example, a basemap showing streets can provide context for your address data. The Standard account provides four base maps: Dark Gray Canvas, Light Gray Canvas, OpenStreetMap, and Streets.
To change the basemap, follow these steps:
Select to expand the Map tools
, if necessary, and then select Basemap
to display the gallery of available basemaps.
Pastaba
You must have Basemaps set to On in the Visualizations pane on the Format tab ![]() .
.
Select the Dark Gray Canvas basemap.
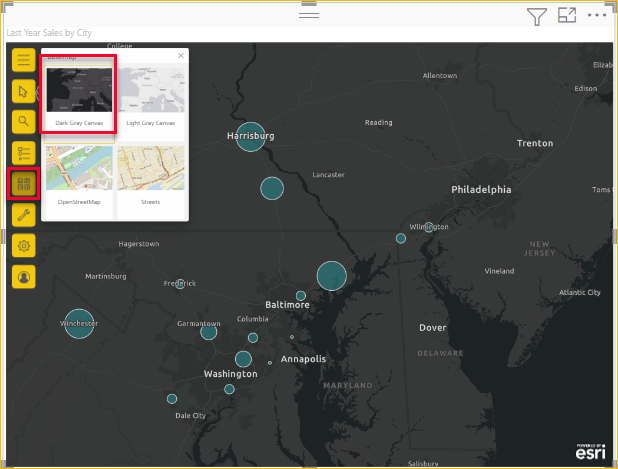
The map updates using the new basemap.
For more information about changing the basemap, visit the ArcGIS for Power BI online help.
In ArcGIS for Power BI, you work with geographic data through layers. Layers contain logical collections of geographic data that are used to create maps. They're also the basis for geographic analysis.
To display the Layers list, select
to expand the Map tools, if necessary, and select Layers
.
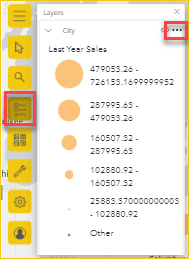
The Layers list displays your data as a layer added to the basemap. You can configure the layer’s dynamic options to customize how the data in your layer is displayed.
Different options appear in the menu depending on the type of data in your selected layer. For example, you can change the Symbology and Location type settings for a layer created using Power BI data, like the City layer you created for this tutorial, but those options aren't available for reference or drive-time layers.
For more information about working with layers, visit the ArcGIS for Power BI online help.
ArcGIS for Power BI uses geo enabling technology to accurately position location data on the map and automatically render items as points or boundaries by default, based on the type of data they represent. For example, a latitude, longitude coordinate is rendered as a point on the map, whereas a city is rendered as a boundary (polygon).
You can improve how accurately different locations are rendered on the map by establishing their location type.
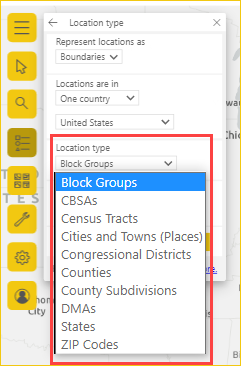
Boundaries are typically standard geographic areas, such as countries/regions, provinces, and ZIP codes. When you establish boundaries and a specific country/region for your data locations, you can then choose from a subset of related, standard boundaries, such as census tracts, districts, or municipalities. Various location types are available for each country or region.
To modify your data's location type, follow these steps:
Select to expand the Map tools
, if necessary, and select Layers
.
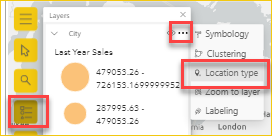
On your data layer, select more options and choose Location type from the dropdown menu.
Accept the default values to render the locations as points on the map and in one country/region, the United States.
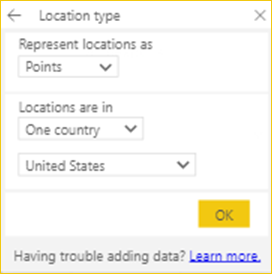
Select OK to save your settings.
For more information about specifying the location type, visit the ArcGIS for Power BI online help.
ArcGIS for Power BI uses values in the Fields pane to determine how it should render locations on your map with predictive smart mapping. Use the Symbology feature to modify the default styles.
You can choose a different style theme and customize the symbols and colors you use to represent locations on the map. The available themes and style options depend on the values you added to the Fields pane.
To change a layer's symbology, follow these steps:
Select to expand the Map tools
, if necessary, and select Layers
.
On your data layer, select more options  and choose Symbology from the menu.
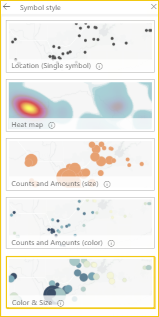
The Symbol style pane appears, displaying the available symbol style themes.
In this tutorial, because you added values to both the Location and Size fields, the map uses the Counts and Amounts (size) theme by default.
To change the theme, follow these steps:
Choose some of the other map themes to see how your map changes.
Pastaba
Not all themes appear in the style pane if your selected data values do not match the options for that style.
For this tutorial, choose the Counts and Amounts (size) theme.
For more information about themes, visit the ArcGIS for Power BI online help.
Symbol styles allow you to fine-tune how data is presented on the map. The available, default symbol styles are based on the selected location type and theme. The available style options presented to you vary depending on which field wells contain values and the nature of those values.
To change the symbol style, follow these steps:
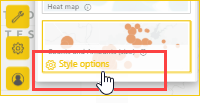
In the Symbology pane, hover over the Counts and Amounts (size) panel to expand the Style options link.
The Symbology library is dynamic and responds to the nature of your data and selected theme. From Symbology, you can generally change the shape, fill color, and transparency of symbols and outlines and set a color ramp. Classification settings, such as area of influence, method, classes, the ability to exclude specific null values, size range, and other settings may also be visible on this tab, depending on your data and theme.
For more information about the different data classification types, visit the ArcGIS for Power BI online help.
Expand the Symbology category and select Advanced options.
Select Fill.
Change your symbol color to green by dragging the color sliders and set Fill transparency to 30 percent.
This example shows the theme set to Counts and Amounts (size) with a green symbol set to 30 percent transparency.
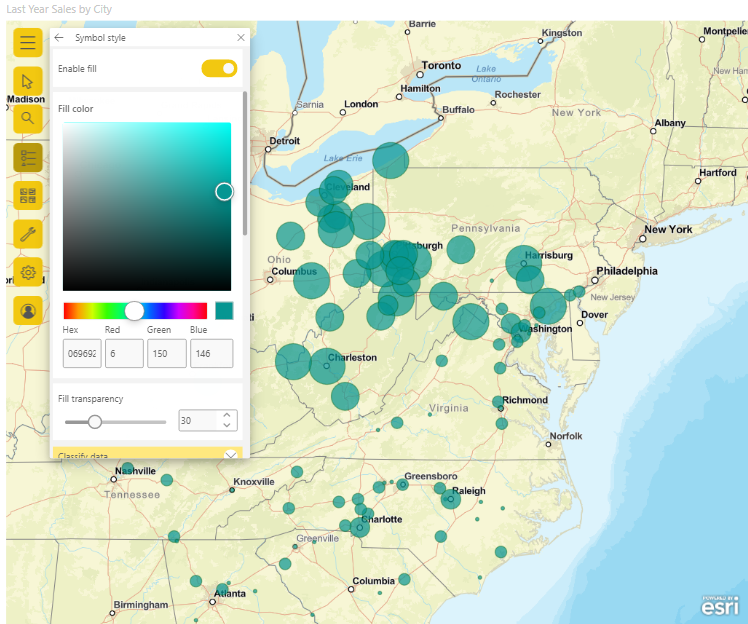
Close the Symbol style pane.
ArcGIS for Power BI provides tools to help you discover patterns in your data and tell a compelling story with a map.
Analysis features include the following features:
Choose from several tools to select locations on the map.
To display the selection tools, follow these steps:
Select to expand the Map tools
, if necessary, and select Selection tools  to expand the toolset.
There are several selection tools. The tools available in the Selection tools menu vary depending on the type of layer that is currently active.
| Tool | Description |
|---|---|
| Single select |
|
| Select by rectangle |
|
Select by circle 
|
|
Select by polygon 
|
|
Select by freehand polygon 
|
|
| Reference layer select |
|
| Drive-time select |
|
| Clear selection |
|
Select one or more locations or features on the map.
You can select a maximum of 250 data points at a time. When the Buffer/Drive Time pane is active, map selection tools are temporarily unavailable.
For more information about selection tools, visit the ArcGIS for Power BI online help. For more information about reference layers, see Add a reference layer. For more information about buffer or drive time areas, see Create buffers and drive time areas.
Pin a specific address, place, or point of interest on the map. For this tutorial, you’ll search for the Pittsburgh International Airport.
To pin a location, follow these steps:
Select to expand the Map tools
, if necessary, and select Search
the Search pane.
Type the keywords Pittsburgh international in the search field.
Keywords can include an address, place, or point of interest. As you type, similar recent searches or suggestions based on similar keywords appear.
From the results list, choose Pittsburgh International Airport and select Close.
A symbol appears on the map, and the map automatically zooms to the location, pinning it for the duration of your session.
Pastaba
Pins remain in place on the map only during the current session; you cannot save a pinned location with the map.
For more information, see Pin a location in the ArcGIS for Power BI online help.
When you use Power BI data to create an ArcGIS for Power BI map visualization, you're creating a data layer. You can then add reference layers that provide context to your data. For example, if your data layer shows the location of fast-food restaurants, you can add a reference layer showing the proximity of nearby schools, the consumer spending habits of the community, or the age demographic of the surrounding neighborhood.
Reference layers can consist of regional demographic data, such as income, age, and educational attainment. They can also include publicly shared feature layers available from ArcGIS Online that provide various types of information about areas surrounding the locations on your map. Reference layers maximize your data to provide a bigger picture.
After you add a reference layer to a map, you can create a join between the reference layer and Power BI data attributes to gain more insight into your data. To learn more about joining layers, visit the ArcGIS for Power BI help.
The Standard ArcGIS for Power BI account includes a curated selection of United States Census Bureau demographic information layers that help contextualize your data from Power BI.
To add a demographic layer, follow these steps:
Select to expand the Map tools
, if necessary, and select Analysis tools  to expand the toolset.
Select the Reference layer button ![]() .
.
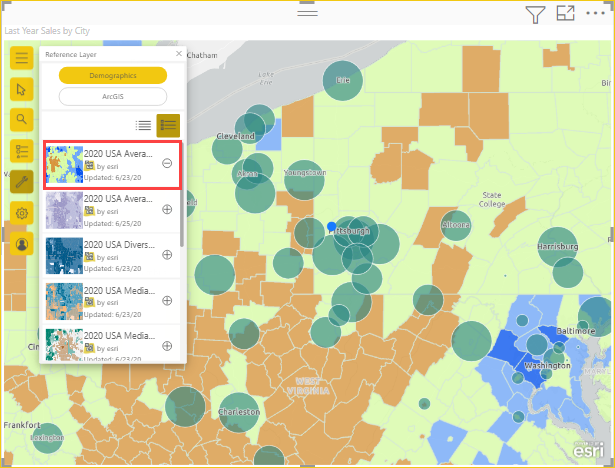
The Reference layer pane appears, displaying the Demographics tab and its selection of layers.
You can view these layers as a list  or a detailed view
Scroll through the gallery and select Add  on the layer you want to add to your map.
For this tutorial, find the 2020 USA Average Household Income layer and select Add
.
The map updates to include the reference layer.
Demographic reference layers are interactive. You can select an area to view a tooltip containing more information about that area. You can also select areas on the map that fall within an area on the reference layer.
ArcGIS for Power BI allows you to search for publicly shared feature layers on ArcGIS. This library contains thousands of reference layers that provide information curated to enrich your data. Further, when you sign in to ArcGIS for Power BI using a valid, licensed ArcGIS account, you're granted access to yet more data content which you can share within your organization. This data content includes the authenticated and extensive library of ArcGIS content, such as the ArcGIS Living Atlas of the World. Share this data content within your organization and your organization's groups.
Pastaba
Layers added from ArcGIS must support HTTPS.
For this tutorial, because you're using a Standard account, only publicly shared content appears in the search results.
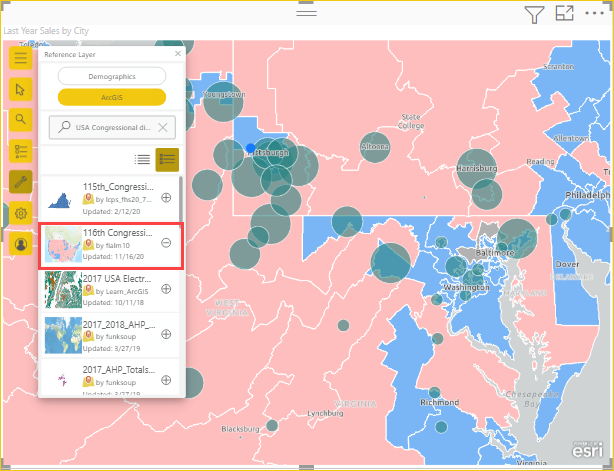
To add an ArcGIS reference layer, follow these steps:
In the Reference pane, select the ArcGIS tab.
In the search field, type USA Congressional districts and press Enter.
The gallery populates with several possible results.
Locate the USA 117th Congressional Districts layer and select Add
.
The map updates to include this ArcGIS public reference layer.
ArcGIS reference layers are interactive. Select an area to view a tooltip containing more information. You can also select areas on the map that fall within an area on the reference layer.
You can use locations on your map, including a pinned location, as a starting point to find and select nearby locations on your map. For example, if you search for a particular place of interest, you can select locations on your map that are within a specified drive time or distance (ring buffer) of that place.
In this tutorial, you use the Pittsburgh International Airport you pinned earlier as a starting point to find locations within 50 miles of the airport. Use similar steps to find locations within a specified drive time.
To find locations within a specific distance, or ring buffer, of the point of origin, follow these steps:
Select to expand the Map tools
, if necessary, and select Analysis tools
to expand the toolset.
Select Drive-time ![]() .
.
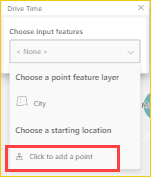
The Drive Time pane appears.
From the Choose input features menu, choose the starting point for the calculation.
You can select a layer in the map, use your current location, or choose Click to add a point to select a location manually.
Choose Click to add a point and, on the map, select the Pittsburgh International Airport location you pinned earlier.
Patarimas
If your map is styled using Clustering, you won't be able to select the clustered locations on the map. Choose a different theme and try again.
From the Choose analysis type menu in the Drive Time pane, choose how the area around the point you selected is measured:
For this tutorial, choose Ring buffer and 50 miles and select Run Analysis.
The map shows a circle surrounding the pinned airport location.
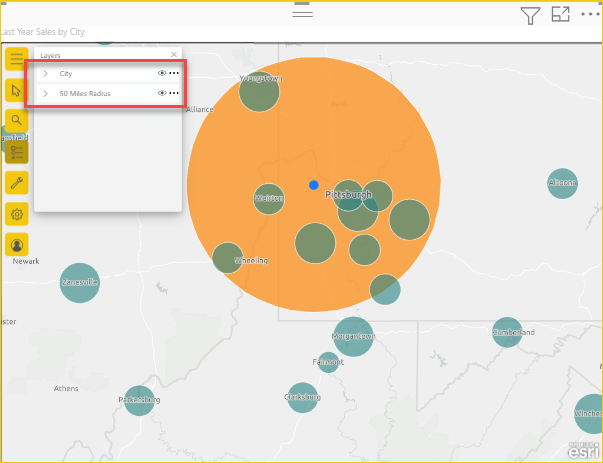
The ring buffer area also appears as a layer in the Layers list. You can rename the layer, show or hide it  , change the sequence in which it's shown (to bring Last Year Sales to the top) by dragging items in the list of layers, or remove it from the map, as you can with each layer.
Pastaba
A map can contain only one search area at a time. If a search area already exists, you must delete it before you can create a new one.
Close the Drive Time pane to reactivate the map selection tools.
For more information about finding nearby locations, visit the ArcGIS for Power BI online help.
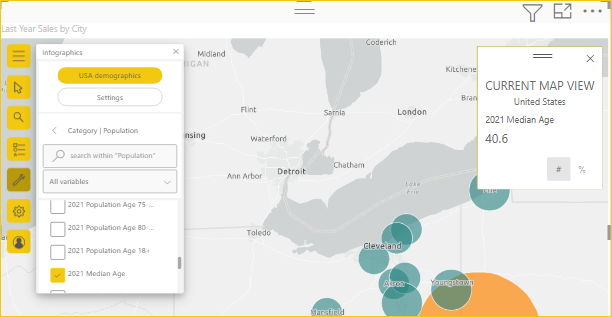
Like reference layers, infographics cards provide more details about areas on the map. Infographics cards are layered on top of the map and display specific demographic information about either the area immediately surrounding a selected location, or about the general area displayed in the current map extent. You can choose from a wide range of demographic categories, such as population details, age distribution, income levels, and more.
Infographics cards are interactive. Their content updates depending on the layer or feature that has cursor focus. They're also configurable, and the properties for an infographics card depends on the chosen demographic category.
To add an infographics card to a map, follow these steps:
Select to expand the Map tools
, if necessary, and Analysis tools
to expand the toolset.
Select Infographics  . The Infographics pane appears.
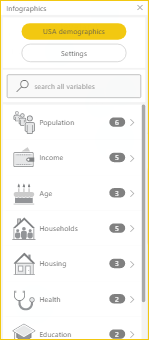
The ArcGIS for Power BI visualization built into Power BI includes a limited number of demographics for the United States only. When you sign in to ArcGIS for Power BI using a valid, licensed ArcGIS account, you can choose from thousands of United States and global demographic variables.
Select the arrow next to a category to view the variables available for that category. For example, select Population to expand that category and then expand Age 5 Year Increments to view available subcategories.
For this tutorial, select Population > (Year) Age: 5-Year Increments > (Year) Median Age.
An infographic appears on the map displaying 2021 Median Age for the current extent of the map.
Patarimas
You can also search for a demographic by name in the Infographics pane search field.
For more details about adding infographics cards, visit the ArcGIS for Power BI online help.
Esri provides comprehensive online documentation for ArcGIS for Power BI.
To access the ArcGIS for Power BI online help from the visualization, follow these steps:
Select to expand the Map tools
, if necessary, and select the Settings button  .
.
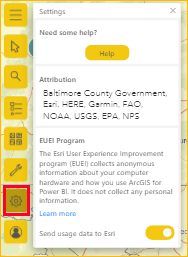
In the Settings pane, select the Help button.
Select OK on the confirmation window that appears.
The ArcGIS for Power BI online help opens in a browser window.
From Esri's content pages, you can use the following resources:
On the Settings pane, you can also view dynamic map attribution that updates for each map extent, read about the Esri EUEI (End User Experience) program, and turn Send usage data to Esri on or off.
Power BI allows designers, tenant administrators, and IT administrators to manage their use of ArcGIS for Power BI. The next sections outline the actions each role can take.
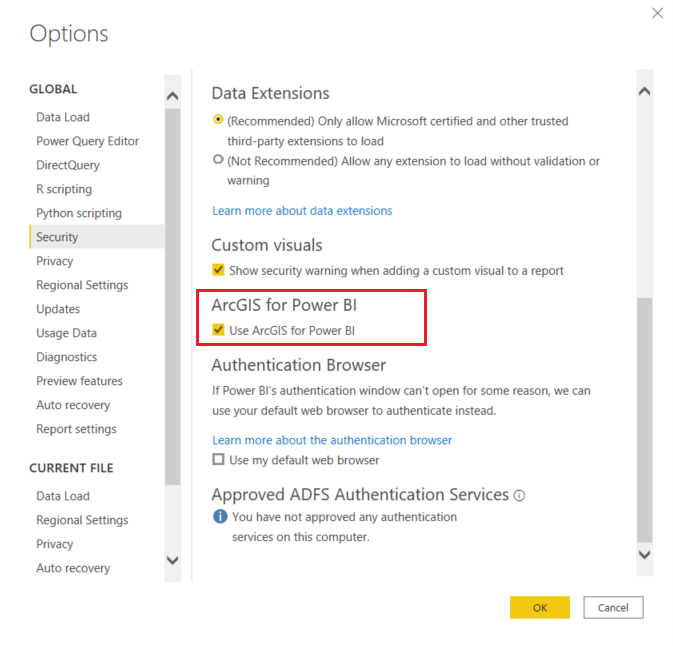
In Power BI Desktop, designers can disable ArcGIS for Power BI on the security tab. Select File > Options and settings and then select Options > Security. When disabled, ArcGIS doesn't load by default.
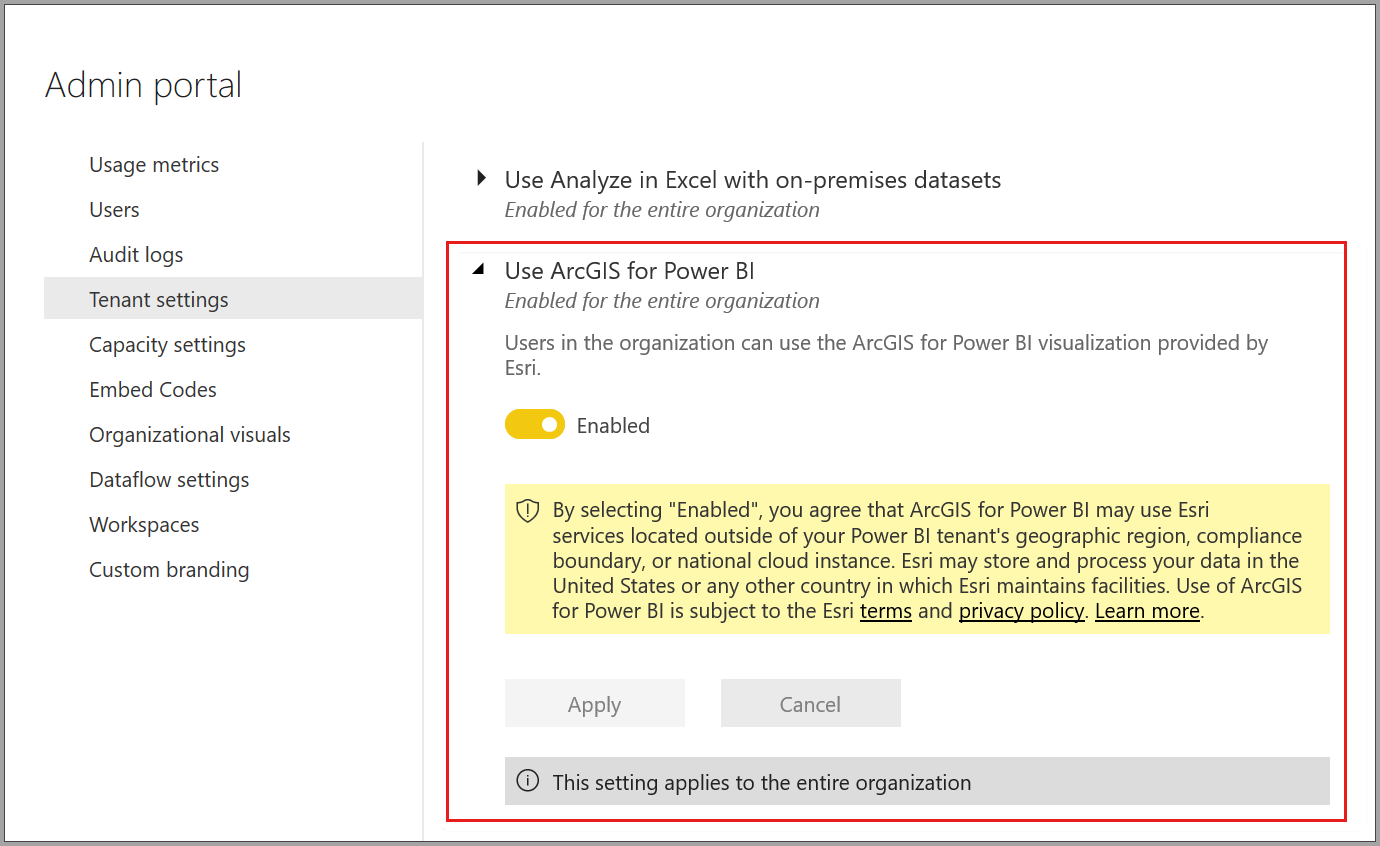
On PowerBI.com, tenant administrators can turn off ArcGIS for Power BI for all users. Select Settings > Admin Portal > Tenant settings. When disabled, Power BI doesn't display the ArcGIS for Power BI icon in the visualizations pane.
Power BI Desktop supports using Group Policy to disable ArcGIS for Power BI across an organization's deployed computers.
| Attribute | Value |
|---|---|
| Key | Software\Policies\Microsoft\Power BI Desktop |
| valueName | EnableArcGISMaps |
A value of 1 (decimal) enables ArcGIS for Power BI.
A value of 0 (decimal) disables ArcGIS for Power BI.
ArcGIS for Power BI is available in the following services and applications:
| Service/Application | Availability |
|---|---|
| Power BI Desktop | Yes |
| Power BI service (powerbi.com) | Yes |
| Power BI mobile applications* | Yes |
| Power BI publish to web | Yes, for designers signed in to a valid, licensed ArcGIS account |
| Power BI Embedded | Yes, for designers signed in to a valid, licensed ArcGIS account |
| Power BI service embedding (powerbi.com) | No |
| Power BI Report Server | Yes, when signed in to a valid ArcGIS Enterprise account through Report Server (online environment only); not supported in a disconnected environment or with ArcGIS Online. Accessing Report Server with ArcGIS for Power BI consumes ArcGIS credits; for more information about credits, visit Understand credits. |
*In mobile environments, you can view maps created using the ArcGIS for Power BI visualization included with Power BI (Standard account). Maps that contain premium content from ArcGIS aren't supported in mobile environments.
In services or applications where ArcGIS for Power BI isn't available, the visualization show as an empty visual with the Power BI logo.
The following table compares the standard features available to all Power BI users to those features available to signed-in ArcGIS users:
| Feature | ||
|---|---|---|
| Basemaps | Four basic basemaps | All Esri basemaps, access to your organization's basemaps, includes any custom basemaps |
| Geocoding | 3,500 locations per map | 10,000 locations per map |
| 10,000 locations per month | No monthly limit | |
| Reference layers | 10 curated reference layers that contain US demographic data | Access to all global web maps and layers as defined by your ArcGIS organization/account. Includes access to ArcGIS Living Atlas of the World maps and layers (feature services) |
| Publicly shared feature layers in ArcGIS | Publicly shared feature layers in ArcGIS | |
| Infographics | A curated gallery of US demographic data variables | Access to all global demographic data variables as defined by your ArcGIS organization/account. Includes access to the ArcGIS GeoEnrichment data browser |
| A maximum of two variables | A maximum of five variables | |
| Support for Drive Time and Radius settings | Support for all distance and travel settings |
Įvykiai
Power BI DataViz Pasaulio čempionatas
02-14 16 - 03-31 16
Su 4 galimybes įvesti, galite laimėti konferencijos paketą ir padaryti jį LIVE Grand Finale Las Vegase
Sužinokite daugiauMokymas
Mokymosi kelias
Use advance techniques in canvas apps to perform custom updates and optimization - Training
Use advance techniques in canvas apps to perform custom updates and optimization
Sertifikatas
Microsoft Certified: Power BI Data Analyst Associate - Certifications
Demonstrate methods and best practices that align with business and technical requirements for modeling, visualizing, and analyzing data with Microsoft Power BI.
Dokumentacija
Use Shape maps in Power BI Desktop (Preview) - Power BI
Create relative comparisons to regions using Shape maps in Power BI Desktop.
Tips and Tricks for maps (including Bing Maps integration) - Power BI
Tips and Tricks for Power BI Map visualizations, visuals, locations, longitude and latitude, and how they work with Bing Maps.
Create and use filled maps (choropleth maps) in Power BI - Power BI
Learn how to create and use filled maps (choropleth maps) in Power BI Desktop and the Power BI service.