Quickstart: Monitor your first metric by using the web portal
Important
Starting on the 20th of September, 2023 you won’t be able to create new Metrics Advisor resources. The Metrics Advisor service is being retired on the 1st of October, 2026.
When you provision an instance of Azure AI Metrics Advisor, you can use the APIs and web-based workspace to interact with the service. The web-based workspace can be used as a straightforward way to quickly get started with the service. It also provides a visual way to configure settings, customize your model, and perform root cause analysis.
Prerequisites
- An Azure subscription. Create one for free.
- When you have your Azure subscription, create a Metrics Advisor resource in the Azure portal to deploy your instance of Metrics Advisor.
Tip
- It can take 10 to 30 minutes for your Metrics Advisor resource to deploy. Select Go to resource after it successfully deploys.
- If you want to use the REST API to interact with the service, you need the key and endpoint from the resource you create. You can find them on the Keys and endpoints tab in the created resource.
This document uses a SQL database as an example for creating your first monitor.
Sign in to your workspace
After your resource is created, sign in to the Metrics Advisor portal with your Active Directory account. From the landing page, select your Directory, Subscription, and Workspace that you just created, and then select Get started. To use time series data, select Add data feed from the left menu.
Currently you can create one Metrics Advisor resource at each available region. You can switch workspaces in the Metrics Advisor portal at any time.
Time series data
Metrics Advisor provides connectors for different data sources, such as Azure SQL Database, Azure Data Explorer, and Azure Table Storage. The steps for connecting data are similar for different connectors, although some configuration parameters might vary. For more information, see Connect different data sources.
This quickstart uses a SQL database as an example. You can also ingest your own data by following the same steps.
Data schema requirements and configuration
Azure AI Metrics Advisor is a service for time series anomaly detection, diagnostics, and analysis. As an AI-powered service, it uses your data to train the model used. The service accepts tables of aggregated data with the following columns:
- Measure (required): A measure is a fundamental or unit-specific term and a quantifiable value of the metric. It means one or more columns containing numeric values.
- Timestamp (optional): Zero or one column, with type of
DateTimeorString. When this column isn't set, the timestamp is set as the start time of each ingestion period. Format the timestamp as follows:yyyy-MM-ddTHH:mm:ssZ. - Dimension (optional): A dimension is one or more categorical values. The combination of those values identifies a particular univariate time series (for example, country/region, language, and tenant). The dimension columns can be of any data type. Be cautious when working with large volumes of columns and values, to prevent excessive numbers of dimensions from being processed.
If you're using data sources such as Azure Data Lake Storage or Azure Blob Storage, you can aggregate your data to align with your expected metrics schema. This is because these data sources use a file as metrics input.
If you're using data sources such as Azure SQL or Azure Data Explorer, you can use aggregation functions to aggregate data into your expected schema. This is because these data sources support running a query to get metrics data from sources.
Configure connection settings and query
Add the data feeds by connecting to your time series data source. Start by selecting the following parameters:
- Source Type: The type of data source where your time series data is stored.
- Granularity: The interval between consecutive data points in your time series data (for example, yearly, monthly, or daily). The shortest interval supported is 60 seconds.
- Ingest data since (UTC): The start time for the first timestamp to be ingested.
Load data
After you input the connection and query strings, select Load data. Metrics Advisor checks the connection and permission to load data, checks the necessary parameters used in the query, and checks the column name from the data source.
If there's an error at this step:
- Check if the connection string is valid.
- Confirm that there's sufficient permissions and that the ingestion worker IP address is granted access.
- Check if the required parameters (
@IntervalStartand@IntervalEnd) are used in your query.
Schema configuration
After the data is loaded by running the query, select the appropriate fields.
| Selection | Description | Notes |
|---|---|---|
| Timestamp | The timestamp of a data point. If the timestamp is omitted, Metrics Advisor uses the timestamp when the data point is ingested instead. For each data feed, you can specify at most one column as timestamp. | Optional. Should be specified with at most one column. |
| Measure | The numeric values in the data feed. For each data feed, you can specify multiple measures, but at least one column should be selected as measure. | Should be specified with at least one column. |
| Dimension | Categorical values. A combination of different values identifies a particular single-dimension time series. Examples include country/region, language, and tenant. You can select none, or an arbitrary number of columns as dimensions. If you're selecting a non-string column as dimension, be cautious with dimension explosion. | Optional. |
| Ignore | Ignore the selected column. | Optional. For data sources that support using a query to get data, there's no ignore option. |
After configuring the schema, select Verify schema. Metrics Advisor performs the following checks:
- Whether the timestamp of the queried data falls into one single interval.
- Whether there are duplicate values returned for the same dimension combination within one metric interval.
Automatic roll-up settings
Important
If you want to enable root cause analysis and other diagnostic capabilities, configure the automatic roll-up settings. After you enable the analysis, you can't change the automatic roll-up settings.
Metrics Advisor can automatically perform aggregation on each dimension during ingestion. Then the service builds a hierarchy that you can use in root cause analysis and other diagnostic features. For more information, see Automatic roll-up settings.
Give a custom name for the data feed, which will be shown in your workspace. Select Submit.
Tune detection configuration
After the data feed is added, Metrics Advisor attempts to ingest metric data from the specified start date. It will take some time for data to be fully ingested, and you can view the ingestion status by selecting Ingestion progress at the top of the data feed page. If data is ingested, Metrics Advisor will apply detection, and continue to monitor the source for new data.
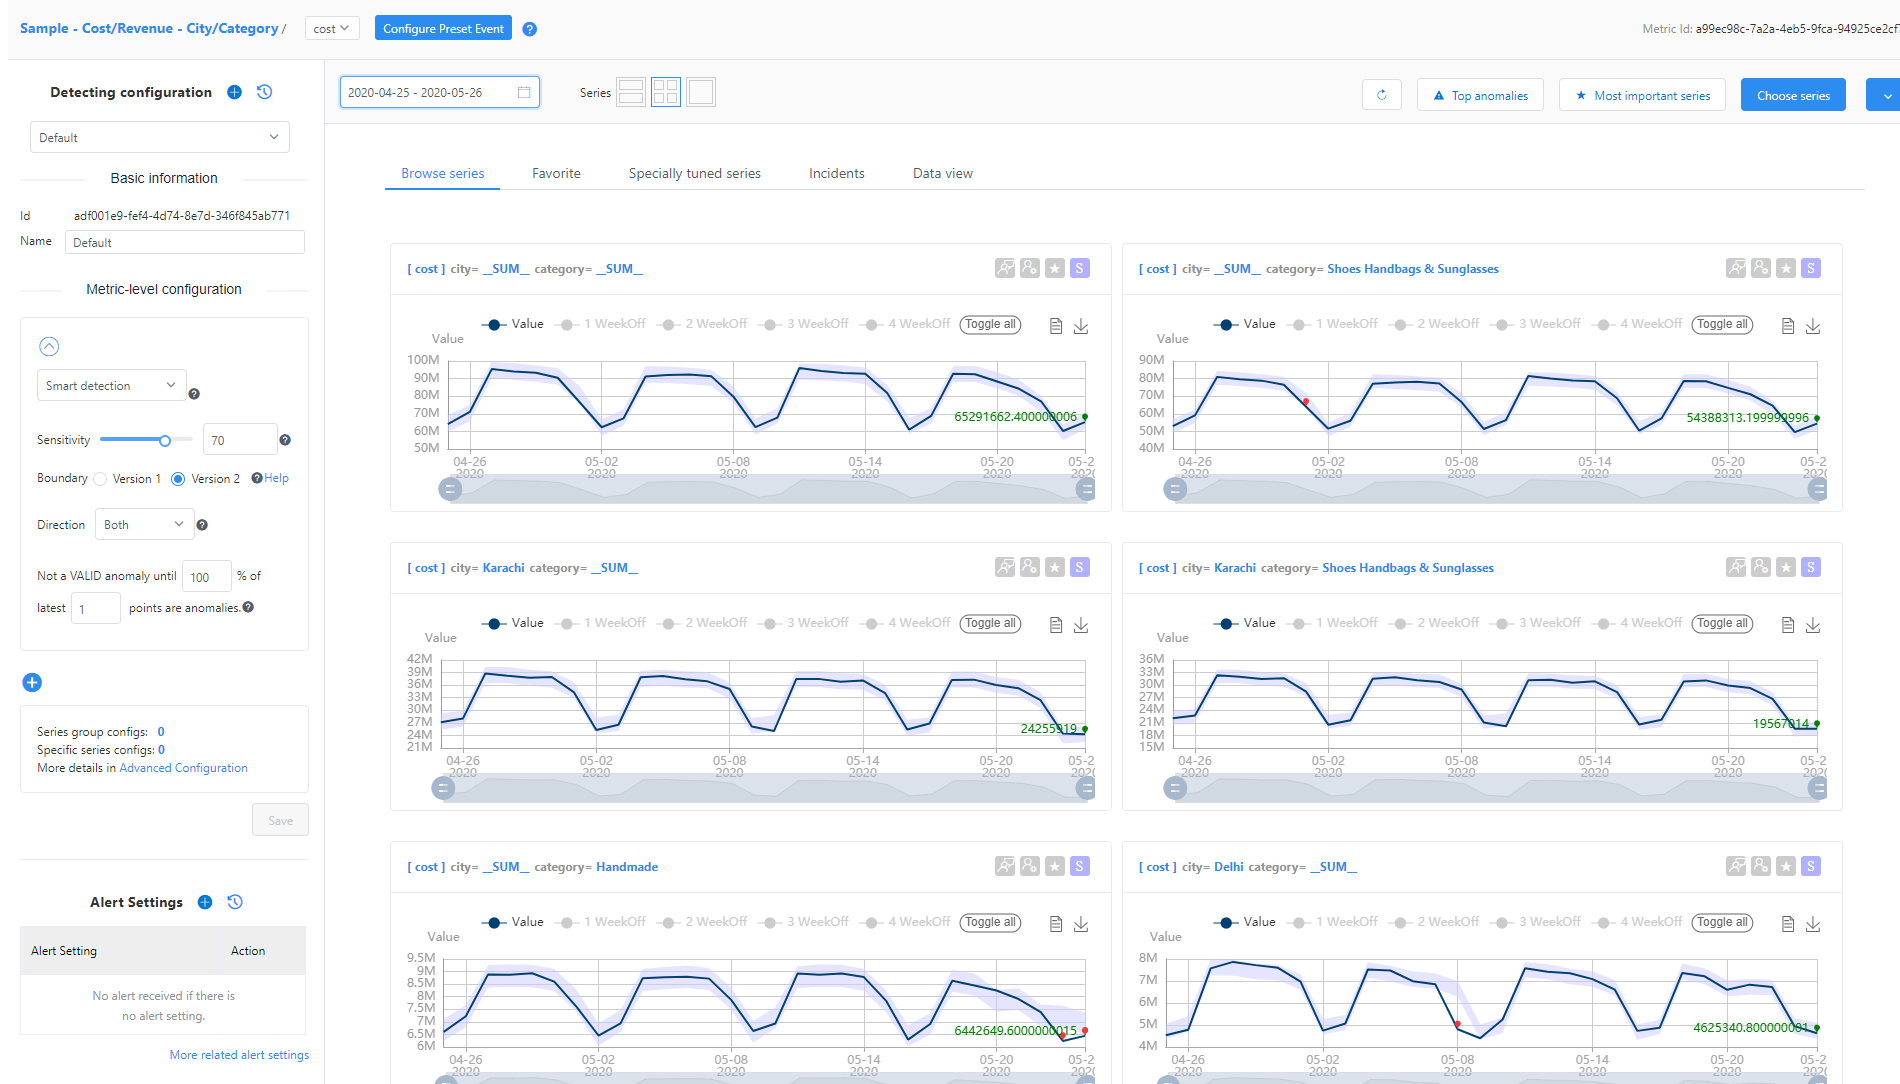
When detection is applied, select one of the metrics listed in the data feed to find the Metric detail page. Here, you can:
- View visualizations of all time series' slices under this metric.
- Update detection configuration to meet expected results.
- Set up notification for detected anomalies.
View diagnostic insights
After tuning the detection configuration, you should find that detected anomalies reflect actual anomalies in your data. Metrics Advisor performs analysis on multidimensional metrics to locate the root cause to a specific dimension. The service also performs cross-metrics analysis by using the metrics graph feature.
To view diagnostic insights, select the red dots on time series visualizations. These red dots represent detected anomalies. A window will appear with a link to the incident analysis page.
On the incident analysis page, you see a group of related anomalies and diagnostic insights. The following sections cover the major steps to diagnose an incident.
Check the summary of the current incident
You can find the summary at the top of the incident analysis page. This summary includes basic information, actions and tracings, and an analyzed root cause. Basic information includes the top impacted series with a diagram, the impact start and end time, the severity, and the total anomalies included.
The analyzed root cause is an automatically analyzed result. Metrics Advisor analyzes all anomalies that are captured on a time series, within one metric with different dimension values at the same timestamp. Then the service performs correlation, clustering group-related anomalies together, and generates advice about a root cause.
Based on these, you can already get a straightforward view of the current abnormal status, the impact of the incident, and the most likely root cause. You can then take immediate action to resolve the incident.
View cross-dimension diagnostic insights
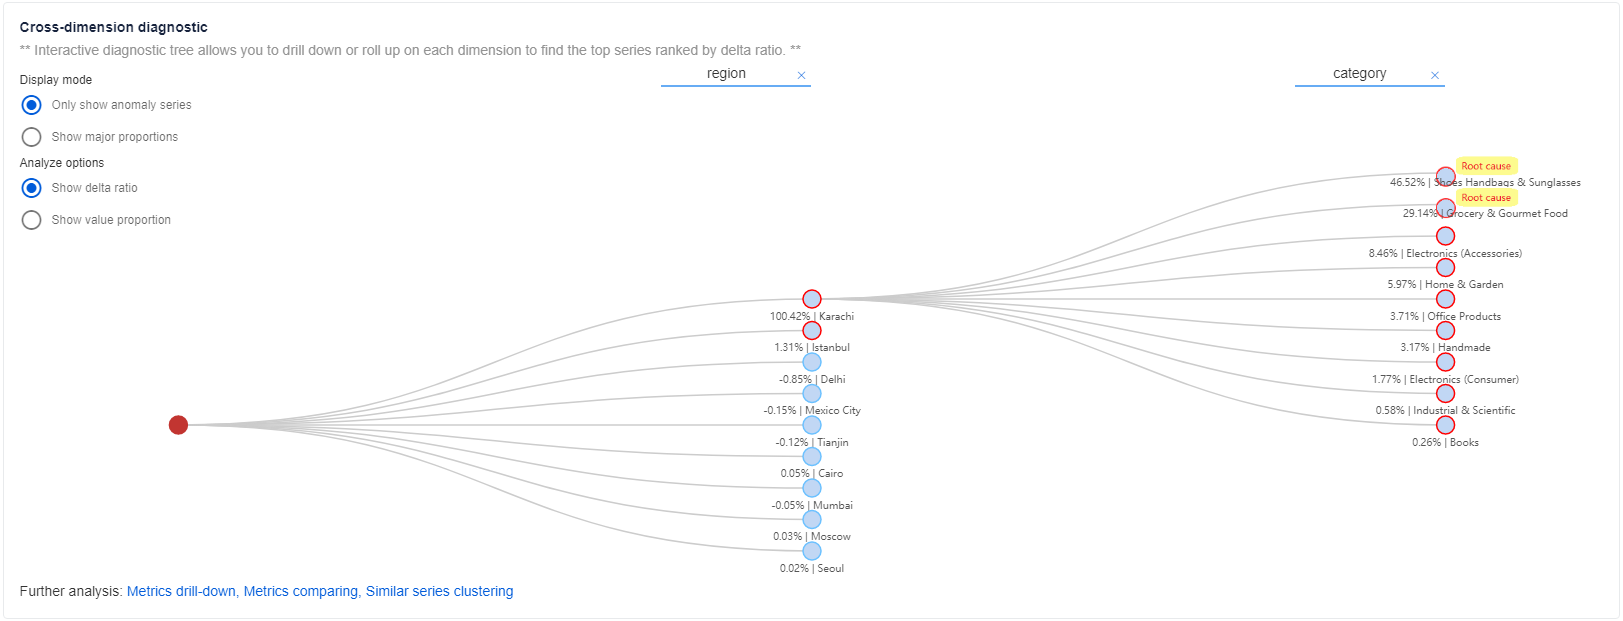
You can also get more detailed info on abnormal status on other dimensions within the same metric in a holistic way, by using the diagnostic tree feature.
For metrics with multiple dimensions, Metrics Advisor categorizes the time series into a hierarchy (called a diagnostic tree). For example, a revenue metric is monitored by two dimensions: region and category. You need to have an aggregated dimension value, such as SUM. Then, the time series of region = SUM and category = SUM is categorized as the root node within the tree. Whenever there's an anomaly captured at the SUM dimension, you can analyze it to locate which specific dimension value has contributed the most to the parent node anomaly. Select each node to expand it for detailed information.
View cross-metrics diagnostic insights
Sometimes, it's hard to analyze an issue by checking the abnormal status of a single metric, and you need to correlate multiple metrics together. To do this, configure a metrics graph, which indicates the relationships between metrics.
By using the cross-dimension diagnostic result described in the previous section, you can identify that the root cause is limited to a specific dimension value. Then use a metrics graph to filter by the analyzed root cause dimension, to check the anomaly status on other metrics.
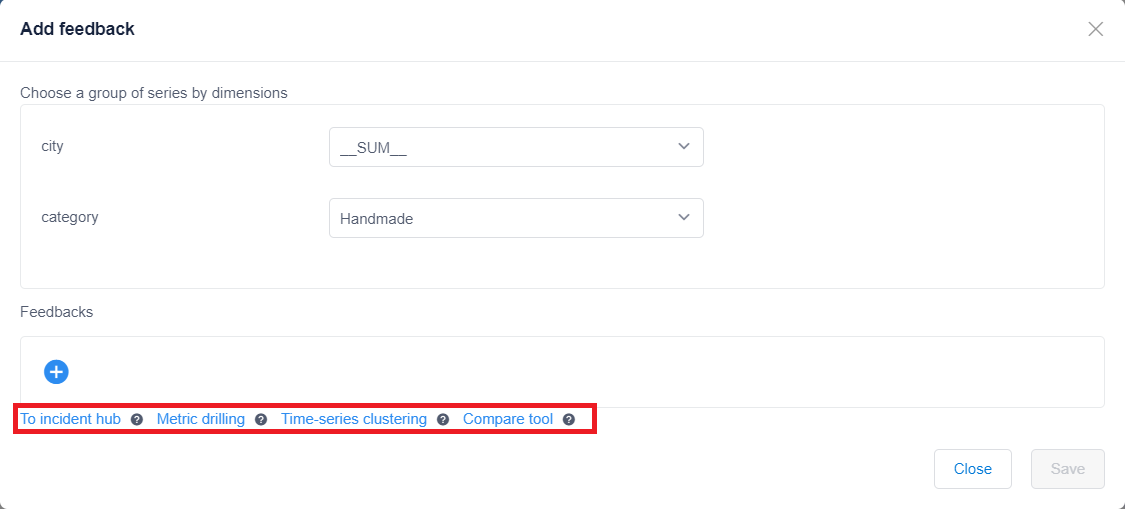
You can also pivot across more diagnostic insights by using additional features. These features help you drill down on dimensions of anomalies, view similar anomalies, and compare across metrics. For more information, see Diagnose an incident.
Get notified when new anomalies are found
If you want to get alerted when an anomaly is detected in your data, you can create a subscription for one or more of your metrics. Metrics Advisor uses hooks to send alerts. Three types of hooks are supported: email hook, web hook, and Azure DevOps. We'll use web hook as an example.
Create a web hook
In Metrics Advisor, you can use a web hook to surface an anomaly programmatically. The service calls a user-provided API when an alert is triggered. For more information, see Create a hook.
Configure alert settings
After creating a hook, an alert setting determines how and which alert notifications should be sent. You can set multiple alert settings for each metric. Two important settings are Alert for, which specifies the anomalies to be included, and Filter anomaly options, which defines which anomalies to include in the alert. For more information, see Add or edit alert settings.


