Quickstart: Start using Cost analysis
Before you can control and optimize your costs, you first need to understand where they originated – from the underlying resources used to support your cloud projects to the environments they get deployed in and the owners who manage them. Full visibility backed by a thorough tagging strategy is critical to accurately understand your spending patterns and enforce cost control mechanisms.
In this quickstart, you use Cost analysis to explore and get quick answers about your costs. You can see a summary of your cost over time to identify trends and break costs down to understand how you're being charged for the services you use. For advanced reporting, use Power BI or export raw cost details.
Prerequisites
Cost Management isn't available for classic Cloud Solution Provider and sponsorship subscriptions. For more information about supported subscription types, see Understand Cost Management data.
You must have Read access to use Cost Management. You might need to wait 48 hours to view new subscriptions in Cost Management.
Get started
Cost analysis is your tool for interactive analytics and insights. It should be your first stop when you need to explore or get quick answers about your costs. You explore and analyze costs using views. A view is a customizable report that summarizes and allows you to drill into your costs. Cost analysis comes with various built-in views that summarize:
- Cost of your resources at various levels.
- Overarching services spanning all your resources.
- Amortized reservation usage.
- Cost trends over time.
The first time you open Cost analysis, you start with either a list of available cost views or a customizable area chart. This section walks through the list of views. If Cost analysis shows an area chart by default, see Analyze costs with customizable views.
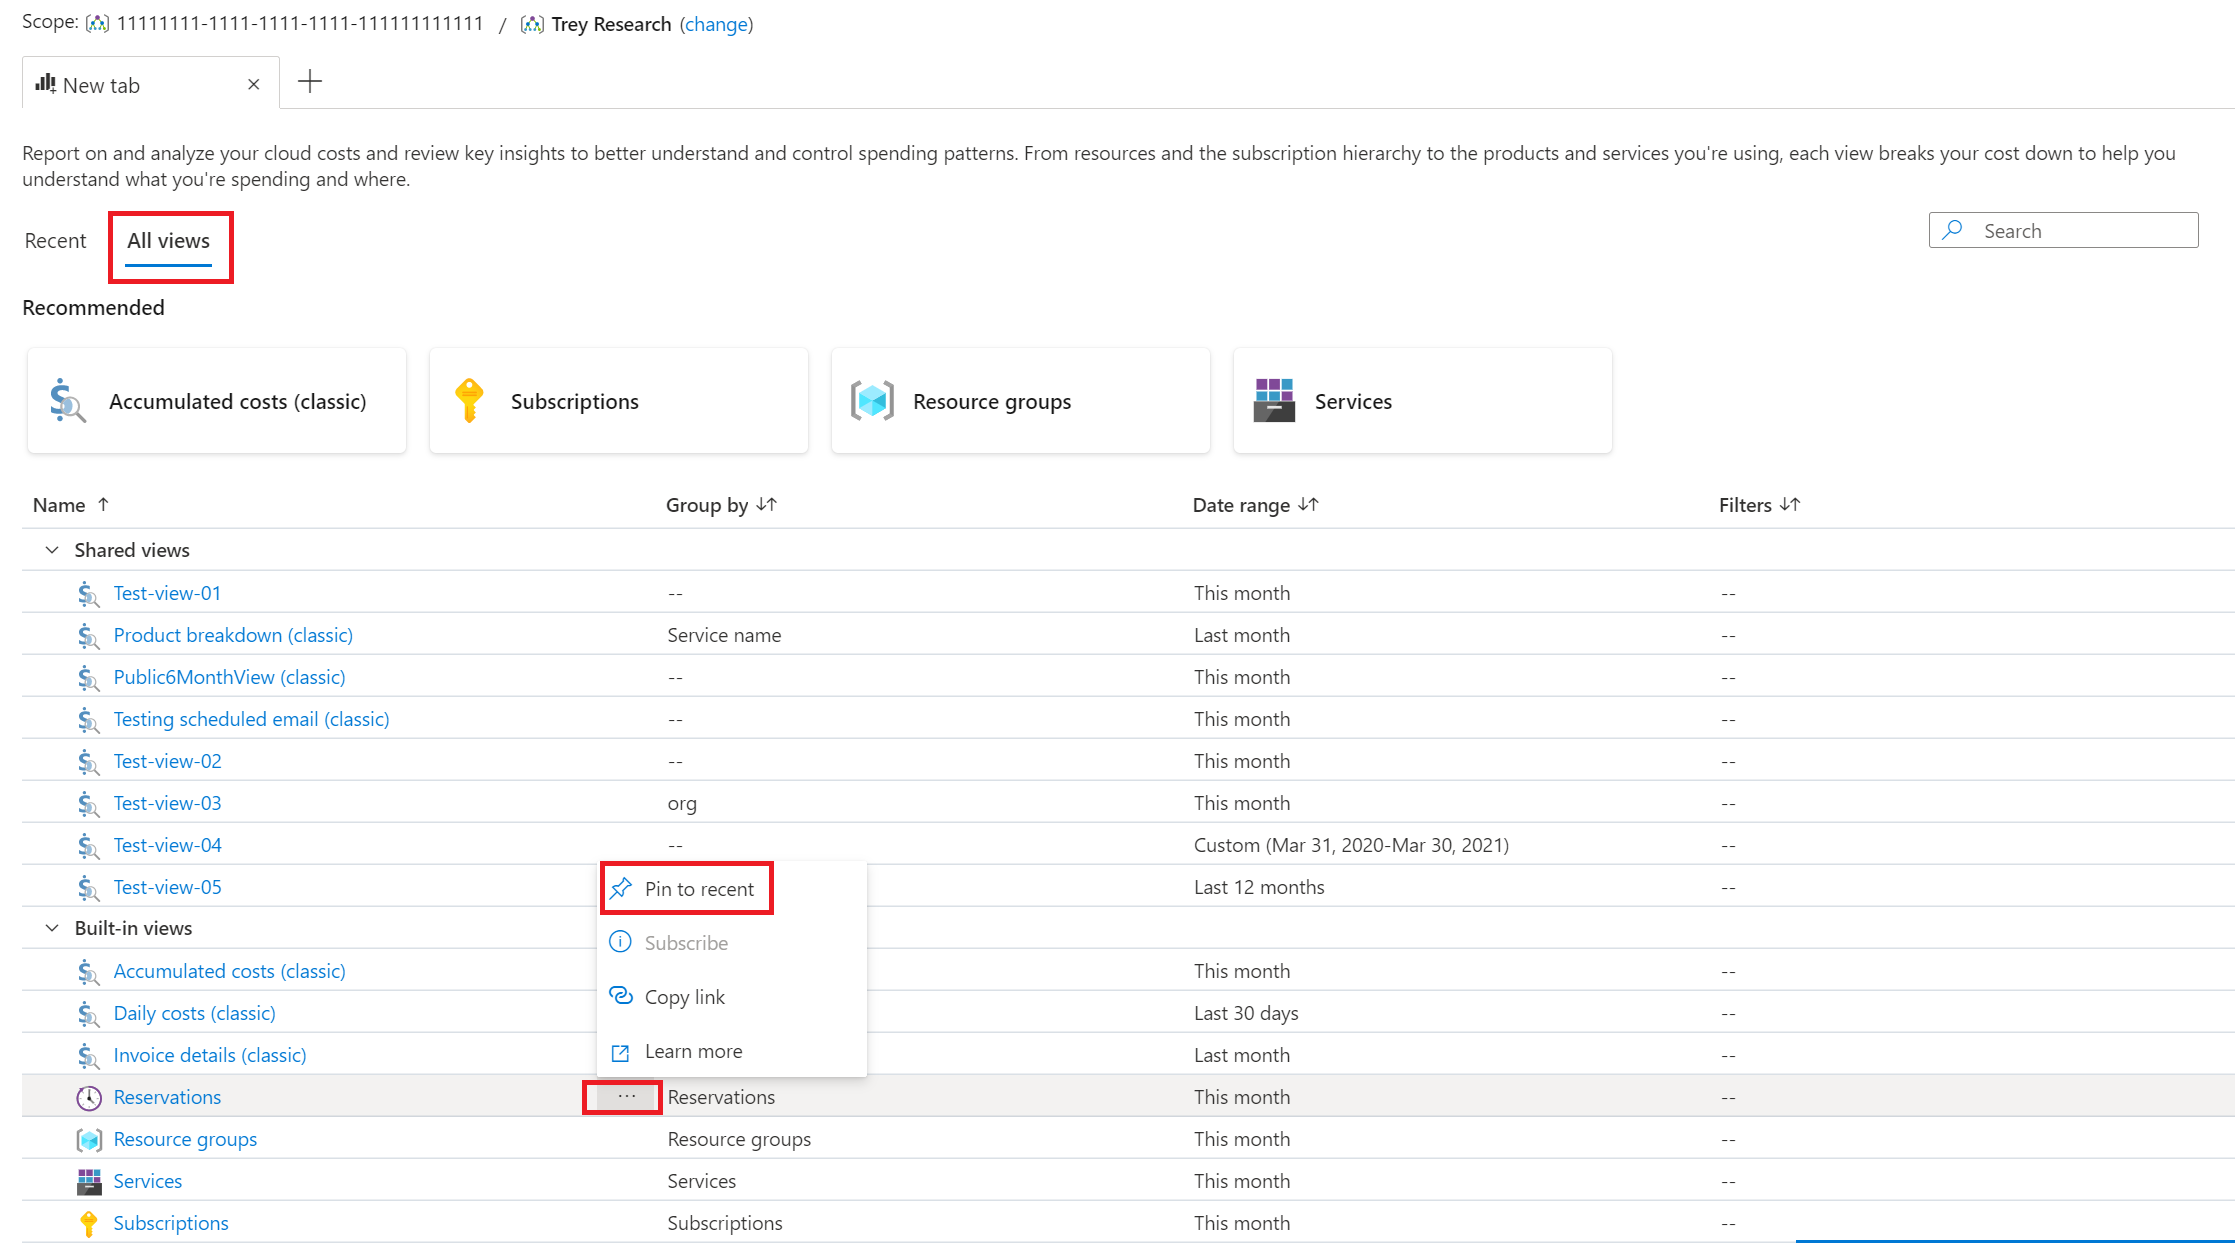
Cost analysis has two types of views: smart views that offer intelligent insights and more details by default and customizable views you can edit, save, and share to meet your needs. Smart views open in tabs in Cost analysis. To open a second view, select the + symbol to the right of the list of tabs. You can open up to five tabs at one time. Customizable views open outside of the tabs in the custom view editor.
As you explore the different views, notice that Cost analysis remembers which views you've used in the Recent section. Switch to the All views section to explore all of your saved views and the ones Microsoft provides out of the box. If there's a specific view that you want quick access to, select Pin to recent from the All views list.
Views in the Recommended list might vary based on what users most commonly use across Azure.
Analyze costs with smart views
If you're new to Cost analysis, we recommend starting with a smart view, like the Resources view. Smart views include:
- Key performance indicators (KPIs) to summarize your cost
- Intelligent insights about your costs like anomaly detection
- Expandable details with the top contributors
- A breakdown of costs at the next logical level in the resource or product hierarchy
When you first open a smart view, note the date range for the period. Most views show the current calendar month, but some use a different period that better aligns to the goals for the view. As an example, the Reservations view shows the last 30 days by default to give you a clearer picture of reservation utilization over time. To choose a different date range, use the arrows in the date pill to switch to the previous or next period, or select the text to open a menu with other options.
Check the Total cost KPI at the top of the page to confirm it matches your expectations. Note the small percentage next to the total – it's the change compared to the previous period. Check the Average cost KPI to note whether costs are trending up or down unexpectedly.
If showing three months or less, the Average cost API compares the cost from the start of the period (up to but not including today) to the same number of days in the previous period. If showing more than three months, the comparison looks at the cost up to but not including the current month.
We recommend checking your cost weekly to ensure each KPI remains within the expected range. If you recently deployed or changed resources, we recommend checking daily for the first week or two to monitor the cost changes.
Note
If you want to monitor your forecasted cost, you can enable the Forecast KPI preview feature in Cost Management Labs, available from the Try preview command.
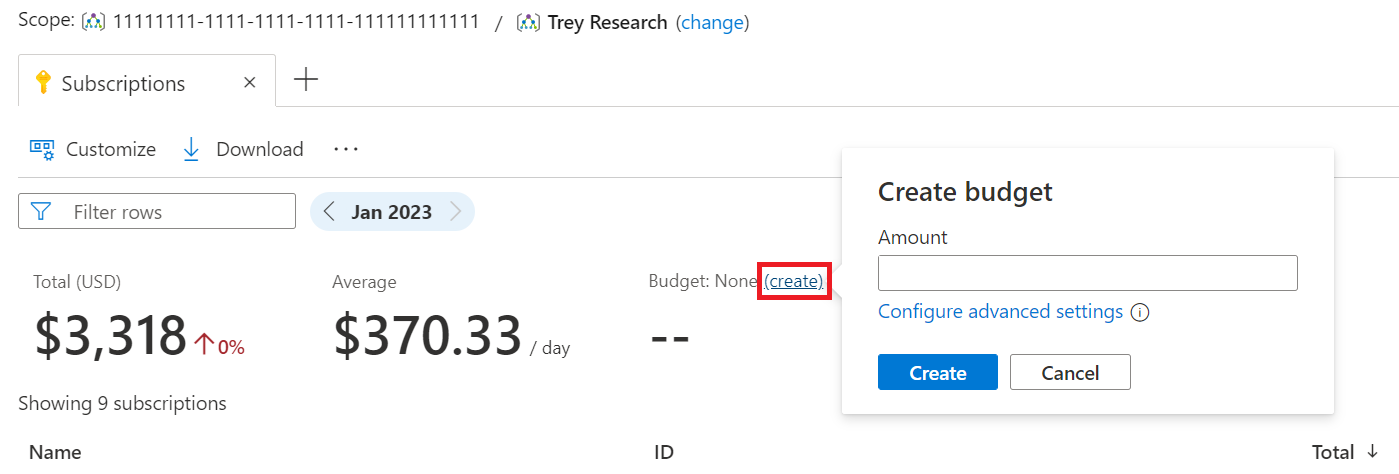
If you don't have a budget, select the create link in the Budget KPI and specify the amount you expect to stay under each month. To create a quarterly or yearly budget, select the Configure advanced settings link.
Depending on the view and scope you're using, you might also see cost insights below the KPIs. Cost insights show important datapoints about your cost – from discovering top cost contributors to identifying anomalies based on usage patterns. Select the See insights link to review and provide feedback on all insights. Here's an insights example.
Lastly, use the table to identify and review your top cost contributors and drill in for more details.
This view is where you spend most of your time in Cost analysis. To explore further:
- Expand rows to take a quick peek and see how costs are broken down to the next level. Examples include resources with their product meters and services with a breakdown of products.
- Select the name to drill down and see the next level details in a full view. From there, you can drill down again and again, to get down to the finest level of detail, based on what you have interest in. Examples include selecting a subscription, then a resource group, and then a resource to view the specific product meters for that resource.
- To see related costs, select the shortcut menu (⋯). Examples include filtering the list of resource groups to a subscription or filtering resources to a specific location or tag.
- Select the shortcut menu (⋯) to open the management screen for that resource, resource group, or subscription. From this screen, you can stop or delete resources to avoid future charges.
- Open other smart views to get different perspectives on your costs.
- Open a customizable view and apply other filters or group the data to explore further.
Note
If you want to visualize and monitor daily trends within the period, enable the chart preview feature in Cost Management Labs, available from the Try preview command.
Data sources for smart views are as follows:
- Reservations – Source data is from amortized usage and charges.
- Resource groups – Source data is from actual usage and charges.
- Services – Source data is from actual usage and charges.
- Subscriptions – Source data is from actual usage and charges.
- Resources – Source data is from actual usage and charges.
Analyze costs with customizable views
While smart views offer a highly curated experience for targeted scenarios, custom views allow you to drill in further and answer more specific questions. Like smart views, custom views include a specific date range, granularity, group by, and one or more filters. Five custom views are provided for you to show how costs change over time. They're separated by resource and product. All aspects of custom views can be changed to help answer simple questions. If you require more advanced reporting, like grouping by multiple attributes or fully customizable reports, use Power BI or export raw cost details.
Here's an example of the Accumulated Costs customizable view.
After you customize your view to meet your needs, you might want to save and share it with others. To share views with others:
- Save the view on a subscription, resource group, management group, or billing account.
- Share a URL with view configuration details, which they can use on any scope they have access to.
- Ping the view to an Azure portal dashboard. Pinning requires access to the same scope.
- Download an image of the chart or summarized cost details in an Excel or CSV file.
- Subscribe to scheduled alerts on a daily, weekly, or monthly basis.
All saved views are available from the All views list discussed previously.
Download cost details
While all smart and custom views can be downloaded, there are a few differences between them.
Customizable chart views are downloaded as an image, smart views aren't. To download an image of the chart, use customizable views.
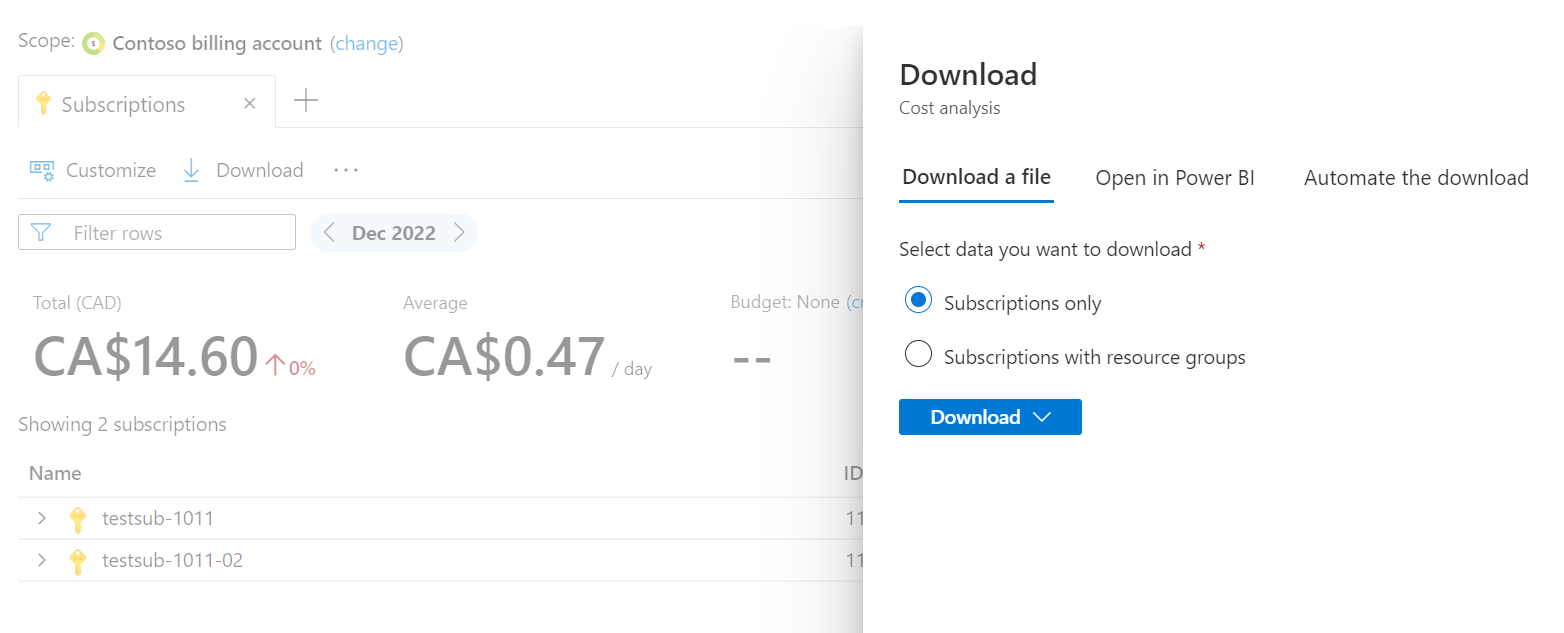
When you download table data, smart views include an extra option to include nested details. There are a few extra columns available in smart views. We recommend starting with smart views when you download data.
Although Power BI is available for all Microsoft Customer Agreement billing profiles and Enterprise Agreement billing accounts, you only see the option from the smart view Download pane when using a supported scope.
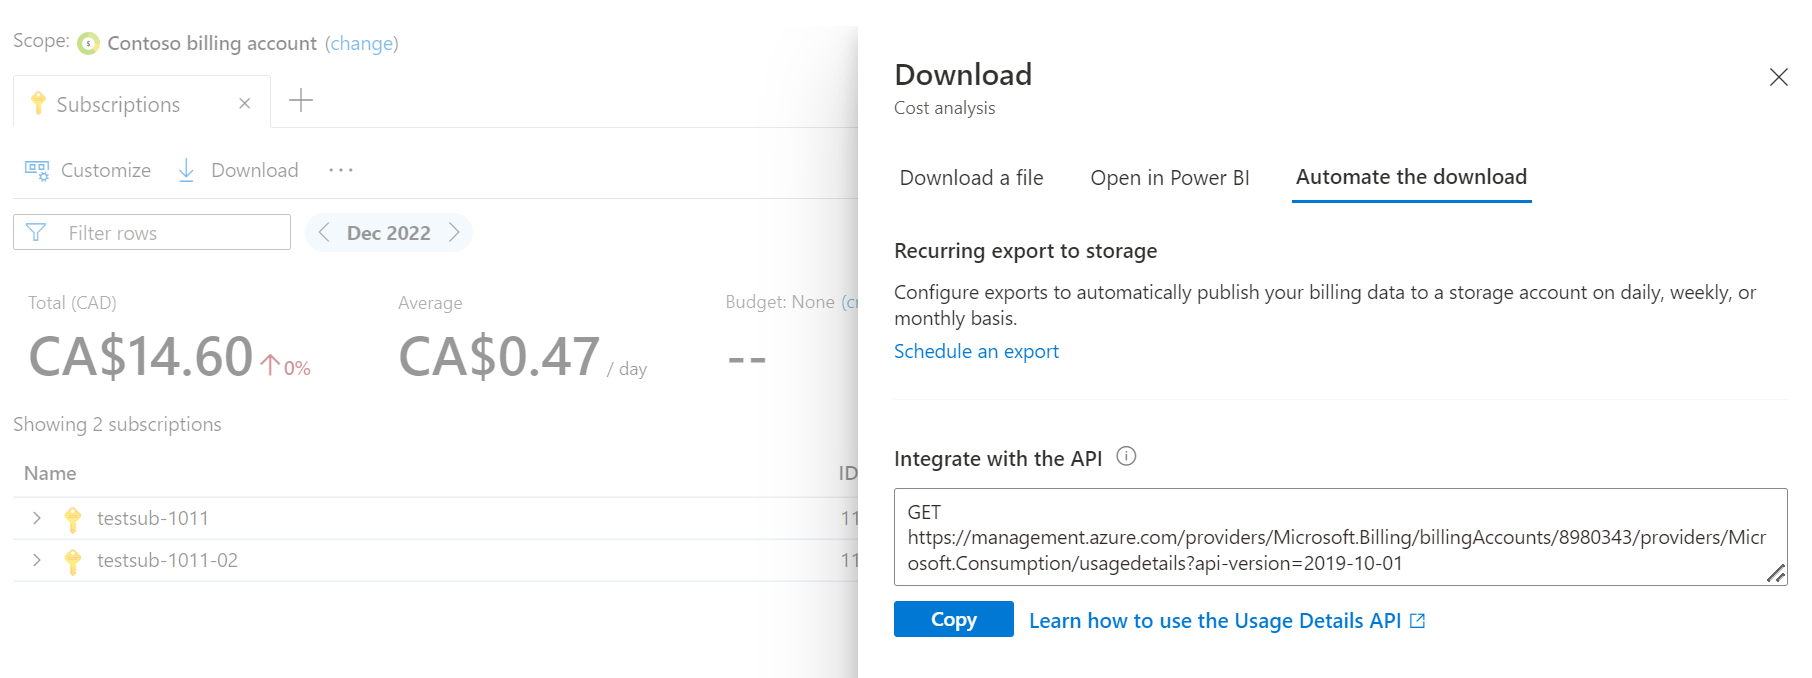
Regardless of whether you start on smart or customizable views, if you need more details, we recommend that you export raw details for full flexibility. Smart views include the option under the Automate the download section.
Forecasting costs in Cost Analysis
Forecast costs are available in both smart and custom views when you select either an area or column stacked chart type. In either case, the forecast is calculated the same way based on your historical usage patterns for up to a year in the future.
Your forecast is a projection of your estimated costs for the selected period. Your forecast changes depending on what data is available for the period, how long of a period you select, and what filters you apply. If you notice an unexpected spike or drop in your forecast, expand the date range, and use grouping to identify large increases or decreases in historical cost. You can filter them out to normalize the forecast. A few key considerations:
Forecasting employs a time series linear regression model, which adjusts to factors such as reserved instance purchases that temporarily affect forecasted costs. Following such purchases, the forecasted costs typically stabilize in alignment with usage trends within a few days. You can filter out these temporary spikes to obtain a more normalized forecasted cost.
For accurate long-term forecasting, it's essential to have sufficient historical data. New subscriptions or contracts with limited historical data might result in less accurate forecasts. At least 90 days of historical data are recommended for a more precise annual forecast.
When you select a budget in a custom view, you can also see if or when your forecast would exceed your budget.
Here's a table to help you understand how the forecast duration and lookback period are calculated based on the forecast period:
| Forecast Duration | Lookback Period |
|---|---|
| Up to 28 days | 28 days |
| Above 28 days | Same as Forecast Duration |
| Above 90 days | 90 days |
More information
For more information about using features in costs analysis, see the following articles:
- For built-in views, see Use built-in views in Cost analysis.
- To learn more about customizing views, see Customize views in cost analysis.
- Afterward you can Save and share customized views.
If you need advanced reporting outside of cost analysis, like grouping by multiple attributes or fully customizable reports, you can use:
- Power BI Desktop
- Cost Management Power BI App
- Usage data from exports or APIs
- See Choose a cost details solution to help you determine if exports from the Azure portal or if cost details from APIs are right for you.
To help drive accountability and cost control, configure subscription anomaly alerts and set up a budget.
Next steps
Advance to the first tutorial to learn how to create and manage budgets.


