Notikumi
Veidojiet inteliģentas lietotnes
17. marts 23 - 21. marts 23
Pievienojieties meetup sērijai, lai kopā ar citiem izstrādātājiem un ekspertiem izveidotu mērogojamus AI risinājumus, kuru pamatā ir reālas lietošanas gadījumi.
Reģistrēties tūlītŠī pārlūkprogramma vairs netiek atbalstīta.
Jauniniet uz Microsoft Edge, lai izmantotu jaunāko līdzekļu, drošības atjauninājumu un tehniskā atbalsta sniegtās priekšrocības.
Azure DevOps Services | Azure DevOps Server 2022 - Azure DevOps Server 2019
Widgets display information and charts on dashboards. Many widgets are configurable or are scoped to a team or to the logged in user account. Many display information available from one or more data stores or charts maintained within the system. You add a widget to a dashboard or copy a widget from one dashboard to another. For more information, see Add a widget to a dashboard.
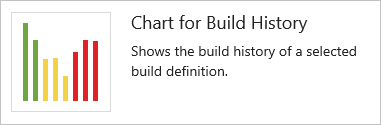
For example, you can add the Build History widget from the dashboard's Add Widget dialog.
This article provides a quick reference of all out of box (OOB) widgets that you can add to your dashboard. In addition to these widgets, you might find more widgets in the Marketplace or create your own.
Widgets listed in the following table are provided out-of-box. They're organized under the service they support:
Boards
Boards
Repos
Pipelines
Test Plans
Information and links
| Category | Requirements |
|---|---|
| Access levels | - Project member. - At least Basic access. |
| Permissions | To add widgets from the marketplace: Member of the Project Collection Administrators group. |
| Category | Requirements |
|---|---|
| Access levels | - Project member. - At least Stakeholder access. |
| Permissions | To add widgets from the marketplace: Member of the Project Collection Administrators group. |
Piezīme
Data displayed within a chart or widget is subject to permissions granted to the signed in user. For more information, see Access and permissions.
Add work tracking widgets to your dashboards that show status, progress, or trends. You use work items to plan and track work. For more information, see Add and update a work item.
In addition to the widgets listed here, you can add a work item query chart to your dashboard. For more information, see Track progress with status and trend query-based charts.

For more information, see Configure a burndown or burnup widget.
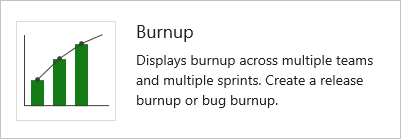
For more information, see Configure a burndown or burnup widget.
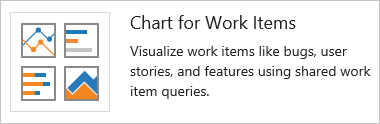
From the configuration dialog, select a shared query and specify the chart type and values.
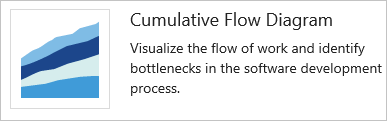
From the configuration dialog, specify the team, backlog level, and other parameters you want.
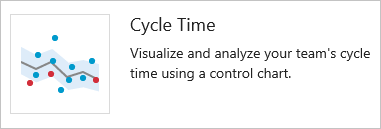
For more information, see Lead time and cycle time control charts.
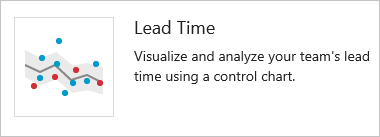
For more information, see Lead time and cycle time control charts.
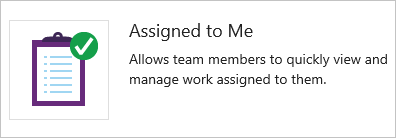
Enables you to add work items from the dashboard. Work items that you add using this widget are automatically scoped to the team's default Area Path. The Iteration Path assigned matches the last Iteration Path assigned to a work item by the currently signed in user.
To change team defaults, see About teams and Agile tools.
To create a shared query, see Use the query editor to list and manage queries.
To create a shared query, see Use the query editor to list and manage queries.
Teams use the burndown chart to mitigate risk and check for scope creep throughout the sprint cycle.
Teams use the burndown chart to mitigate risk and check for scope creep throughout the sprint cycle.
Teams use the burndown chart to mitigate risk and check for scope creep throughout the sprint cycle.
See Set capacity.
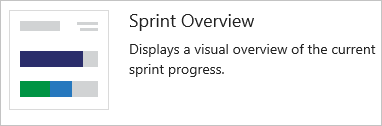
A configurable overview of sprint progress. You can choose between a count of story points or number of work items. Selecting the Show non-working days checkbox indicates to count all remaining days in the sprint, regardless of the days the team has selected as days off.
Teams plan their sprints by defining sprints and assigning backlog items to an iteration.
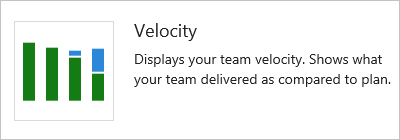
The Velocity widget tracks a team's capacity to deliver work sprint after sprint. You configure the widget by selecting a team, a work item type, an aggregation field, and the number of sprints. The widget takes advantage of Analytics data. You can track the velocity for a single team, not multiple teams.
For additional guidance, see Velocity.
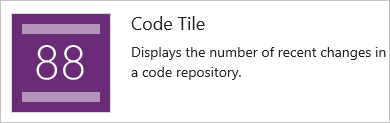
Add code tracking widgets to track changes made within a repository or get quick access to Git pull requests for your team.
For more information, see Review code with pull requests.
For more information, see Review code with pull requests.
This widget is currently in private preview
Add build and release pipeline widgets to track the health of your builds and releases.
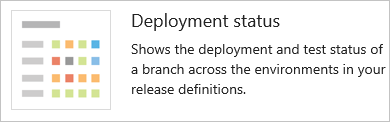
You can choose any cell to see a more detailed view for the selected environment.
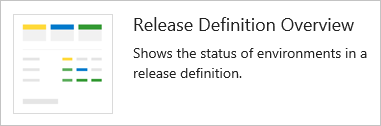
The color of the heading and the icon in each environment indicate the current status of the release, which are the same as are used on the Releases page. Select a release pipeline in the left column to filter the list to just releases for that pipeline.
For more information, see Requirements traceability
Add test tracking widgets to your dashboards to show status, progress, or trends of your testing efforts. In addition to the widgets listed here, you can add test tracking charts to your dashboard. For more information, see Track test status.
For more information, see Track your test results.
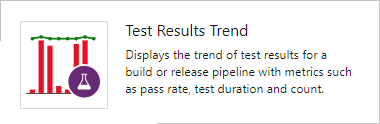
From the configuration dialog, select the build or release whose test results to monitor. There are multiple chart options to choose from, such as Line, Column, and Stacked Column, based on your preference. Optionally, map the trend of test duration on the existing chart by adding a secondary line chart.
To get deeper insights and higher configurability, see Test Analytics.
For more information, see Configure the Test Results Trend (Advanced) widget.
To support adding, add one or more of the following widgets:
The widget supports webpages that allow iframe embedding.

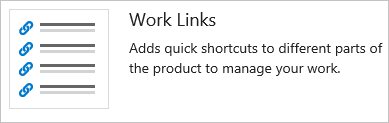
A configurable tile to display any type of information, guidance, or links that you want. You can also configure the widget to point to a file stored in your repository. From the configuration dialog, add the information you want to share with your team.
For more information, see Add Markdown to a dashboard.

For team admins, supports access to the quick dialog to add or remove team members.
Piezīme
This widget is a convenient way to add team members to specific teams within projects. If you remove it, you can still add users to your team from the team administration page.
The Visual Studio IDE client comes with the Team Explorer plug-in which provides quick access to several features, some of which aren't available through the web portal.
You might find more widgets of interest in the Marketplace.
If your organization owner or project collection administrator disables a marketplace widget, you see the following image:
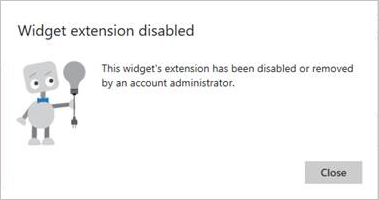
To regain access to it, request your admin to reinstate or reinstall the widget.
Using the REST API service, you can create a dashboard widget. For more information about the REST APIs for dashboards and widgets, see Dashboards (API).
Notikumi
Veidojiet inteliģentas lietotnes
17. marts 23 - 21. marts 23
Pievienojieties meetup sērijai, lai kopā ar citiem izstrādātājiem un ekspertiem izveidotu mērogojamus AI risinājumus, kuru pamatā ir reālas lietošanas gadījumi.
Reģistrēties tūlītApmācība
Mācību ceļš
Use advance techniques in canvas apps to perform custom updates and optimization - Training
Use advance techniques in canvas apps to perform custom updates and optimization
Dokumentācija
Add, rename, delete, and manage team dashboards - Azure DevOps
Learn how to create, rename, and delete team dashboards, manage dashboard permissions, and add widgets to view progress and trends in Azure DevOps.
Status and trend work item, query-based charts - Azure DevOps
Learn how to add status, progress, and trend charts to dashboards from flat-based queries in Azure DevOps.
Copy a dashboard - Azure DevOps
Learn how to copy a project or team dashboard in Azure DevOps.