Notikumi
Veidojiet inteliģentas lietotnes
17. marts 21 - 21. marts 10
Pievienojieties meetup sērijai, lai kopā ar citiem izstrādātājiem un ekspertiem izveidotu mērogojamus AI risinājumus, kuru pamatā ir reālas lietošanas gadījumi.
Reģistrēties tūlītŠī pārlūkprogramma vairs netiek atbalstīta.
Jauniniet uz Microsoft Edge, lai izmantotu jaunāko līdzekļu, drošības atjauninājumu un tehniskā atbalsta sniegtās priekšrocības.
Azure DevOps Services | Azure DevOps Server 2022 - Azure DevOps Server 2019
An Analytics view provides a simplified way to specify the filter criteria for a Power BI report based on Analytics data. Analytics views support Azure Boards data. Each view corresponds to a flat-list of work items. Work item hierarchies aren't supported.
Svarīgi
Analytics views only support Azure Boards data (work items). Analytics views don't support other data types, such as pipelines. Views provide a flat-list of work items and don't support work item hierarchies. At this point, we have no plans to update the connector to support other types of data. For information on other approaches, see About Power BI integration.
You can use a default Analytics view or create a custom view. Create custom views in the web portal for Azure DevOps. After you define a view that supports the data of interest, you can then open the view using Power BI Data Connector to create a report.
| Category | Requirements |
|---|---|
| Access levels | - Project member. - At least Basic access. |
| Permissions | By default, project members have permission to query Analytics and create views. For more information about other prerequisites regarding service and feature enablement and general data tracking activities, see Permissions and prerequisites to access Analytics. |
Users with Stakeholder access have no access to view or edit Analytics views.
Piezīme
If Boards is disabled, then Analytics views is also disabled. All widgets associated with work item tracking are also disabled in the widget catalog. To re-enable a service, see Turn on or off an Azure DevOps service.
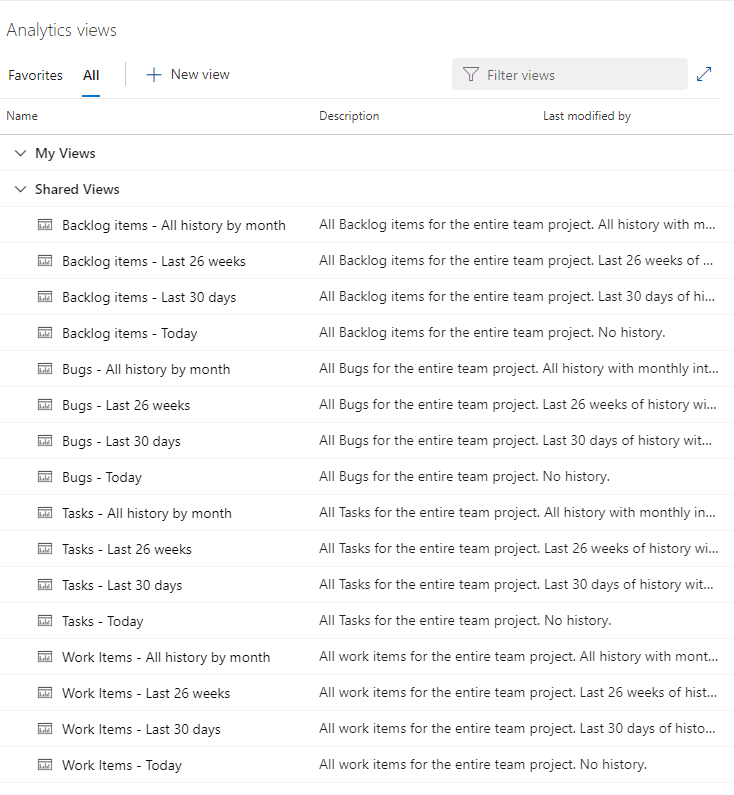
Azure DevOps provides default Analytics views. The default views are immediately accessible from Power BI. The view you select determines the set of records, fields, and history to pull into Power BI.
The following screenshot shows the default views created for a project based on the Agile process. For more information, see Manage Analytics views.
Piezīme
The labels for the default Analytics views differ depending on the process that was chosen for your team project: Basic, Agile, Scrum, or CMMI. The functionality available to you remains the same unless explicitly mentioned.
When you use the Power BI Data Connector, these same default views appear in the Navigator dialog. The view you select determines the set of records, fields, and history that is loaded into Power BI.
Select Azure DevOps as your data connector.

Enter your account information.

Select the data that you want to use.

Select Azure DevOps Server as your data connector.

Enter your server information.

Select the data that you want to use.
Default Analytics views work well for customers with small datasets. Each default Analytics view provides a combination of options for work item types and historical data. The following tables describe each set of options.
| Work item type option | Description |
|---|---|
| Bugs | Load current or historical state of Bugs only |
| Requirement Backlog | Load current or historical state of Stories, Backlog Items, or Requirements |
| Tasks | Load current or historical state of Tasks |
| Work Items | Load current or historical state of all work items |
| Historical option | Description |
|---|---|
| Today | Loads only the most recent revision for each work item |
| Last 30 days | Loads work item history for the last 30 days, on a daily interval |
| Last 26 weeks | Loads work item history for the last 26 weeks, on a weekly interval |
| All history by month | Loads all work item history, on a monthly interval |
The default Analytics views return all the specified data in a project. They work well for customers with smaller datasets. For larger datasets, the amount of data generated by a default view might be too large for Power BI to load.
In these cases, you can create a custom Analytics view to fine-tune the records, fields, and history loaded into Power BI.
If the default Analytics views don't meet your needs, you can create custom views to fine-tune the records, fields, and history returned to Power BI. With a custom view, you can define the following options:
For more information, see Create an Analytics view.
Default views automatically include the most common fields for the included work item types used for reporting. All custom fields are included.
For example, the following fields are included when filtered for bugs and work items. You can look up the description of most of these fields from the Entities and properties reference for Azure Boards or Work item field index.
Two fields that are reported on are only available from Analytics data: Cycle Time Days and Lead Time Days. For more information about how these days are calculated, see Lead time versus cycle time.
For more information on how the dataset is modeled when you use the Power BI Data Connector, see Analytics views dataset design.
These articles provide more information:
Notikumi
Veidojiet inteliģentas lietotnes
17. marts 21 - 21. marts 10
Pievienojieties meetup sērijai, lai kopā ar citiem izstrādātājiem un ekspertiem izveidotu mērogojamus AI risinājumus, kuru pamatā ir reālas lietošanas gadījumi.
Reģistrēties tūlītApmācība
Mācību ceļš
Use advance techniques in canvas apps to perform custom updates and optimization - Training
Use advance techniques in canvas apps to perform custom updates and optimization
Sertifikācija
Microsoft Certified: Power BI Data Analyst Associate - Certifications
Demonstrate methods and best practices that align with business and technical requirements for modeling, visualizing, and analyzing data with Microsoft Power BI.
Dokumentācija
Create an Analytics view - Azure DevOps
Learn how you can add a custom Analytics view for easy generation of Power BI reports for Azure DevOps.
Create a Power BI report with an Analytics view - Azure DevOps
Learn how to create a trend report using an Analytics view.
Manage Analytics views - Azure DevOps
Learn how to view, edit, and delete an Analytics view for Azure DevOps